SIREN has surged 107% over the past 24 hours, but trading volume has fallen nearly 40%, signaling the rally lacks organic demand and is likely speculative.
On-chain and derivatives data all point to weakening buy-side conviction and growing reversal risk.
SIREN faces critical resistance at the 0.5 Fibonacci level; failure to reclaim it could trigger a near-term dip.
BNB-based memecoin SIREN has posted a 100%-plus gain over the past 24 hours, outperforming a crypto market that has largely traded flat.
But a deeper look at on-chain and technical indicators reveals a rally built on speculation rather than organic demand for the altcoin. This raises the likelihood of a sharp reversal in the near term.
Here is why.
SIREN’s 107% Rally Is Losing Steam
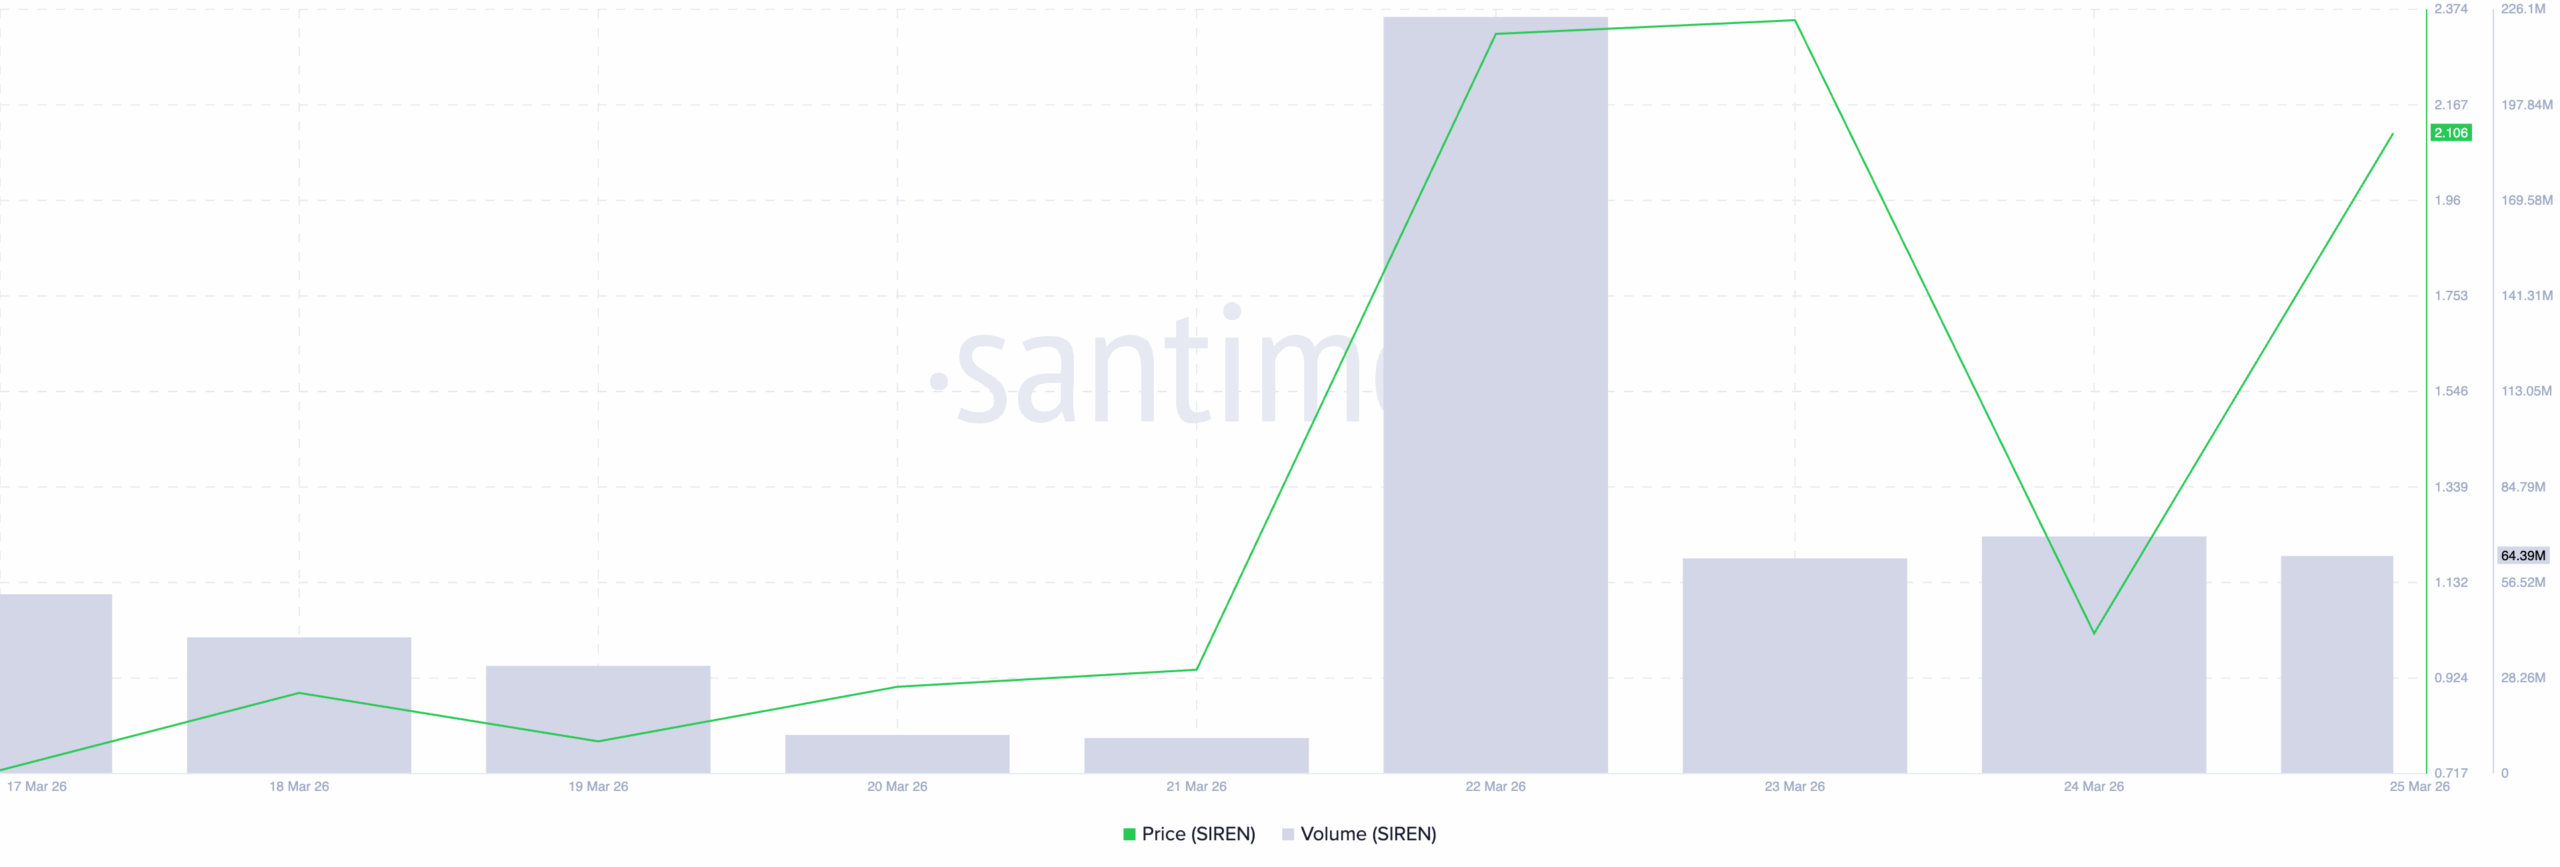
SIREN’s price is up 107% over the past 24 hours. However, its trading volume has declined, a classic sign that the upward move lacks genuine conviction.
SIREN Price and Trading Volume | Credit: Santiment
Per Santiment, this has totaled $64.39 million over the past day, and is down by nearly 40% during that window period.
Usually, sustained rallies are typically backed by rising volume. When prices rise, while trading volume falls, a negative divergence occurs. It signals that the rally is driven by dwindling speculative activity rather than organic demand.
This puts SIREN at risk of losing most of its recent gains as the pool of speculative buyers shrinks and momentum fades.
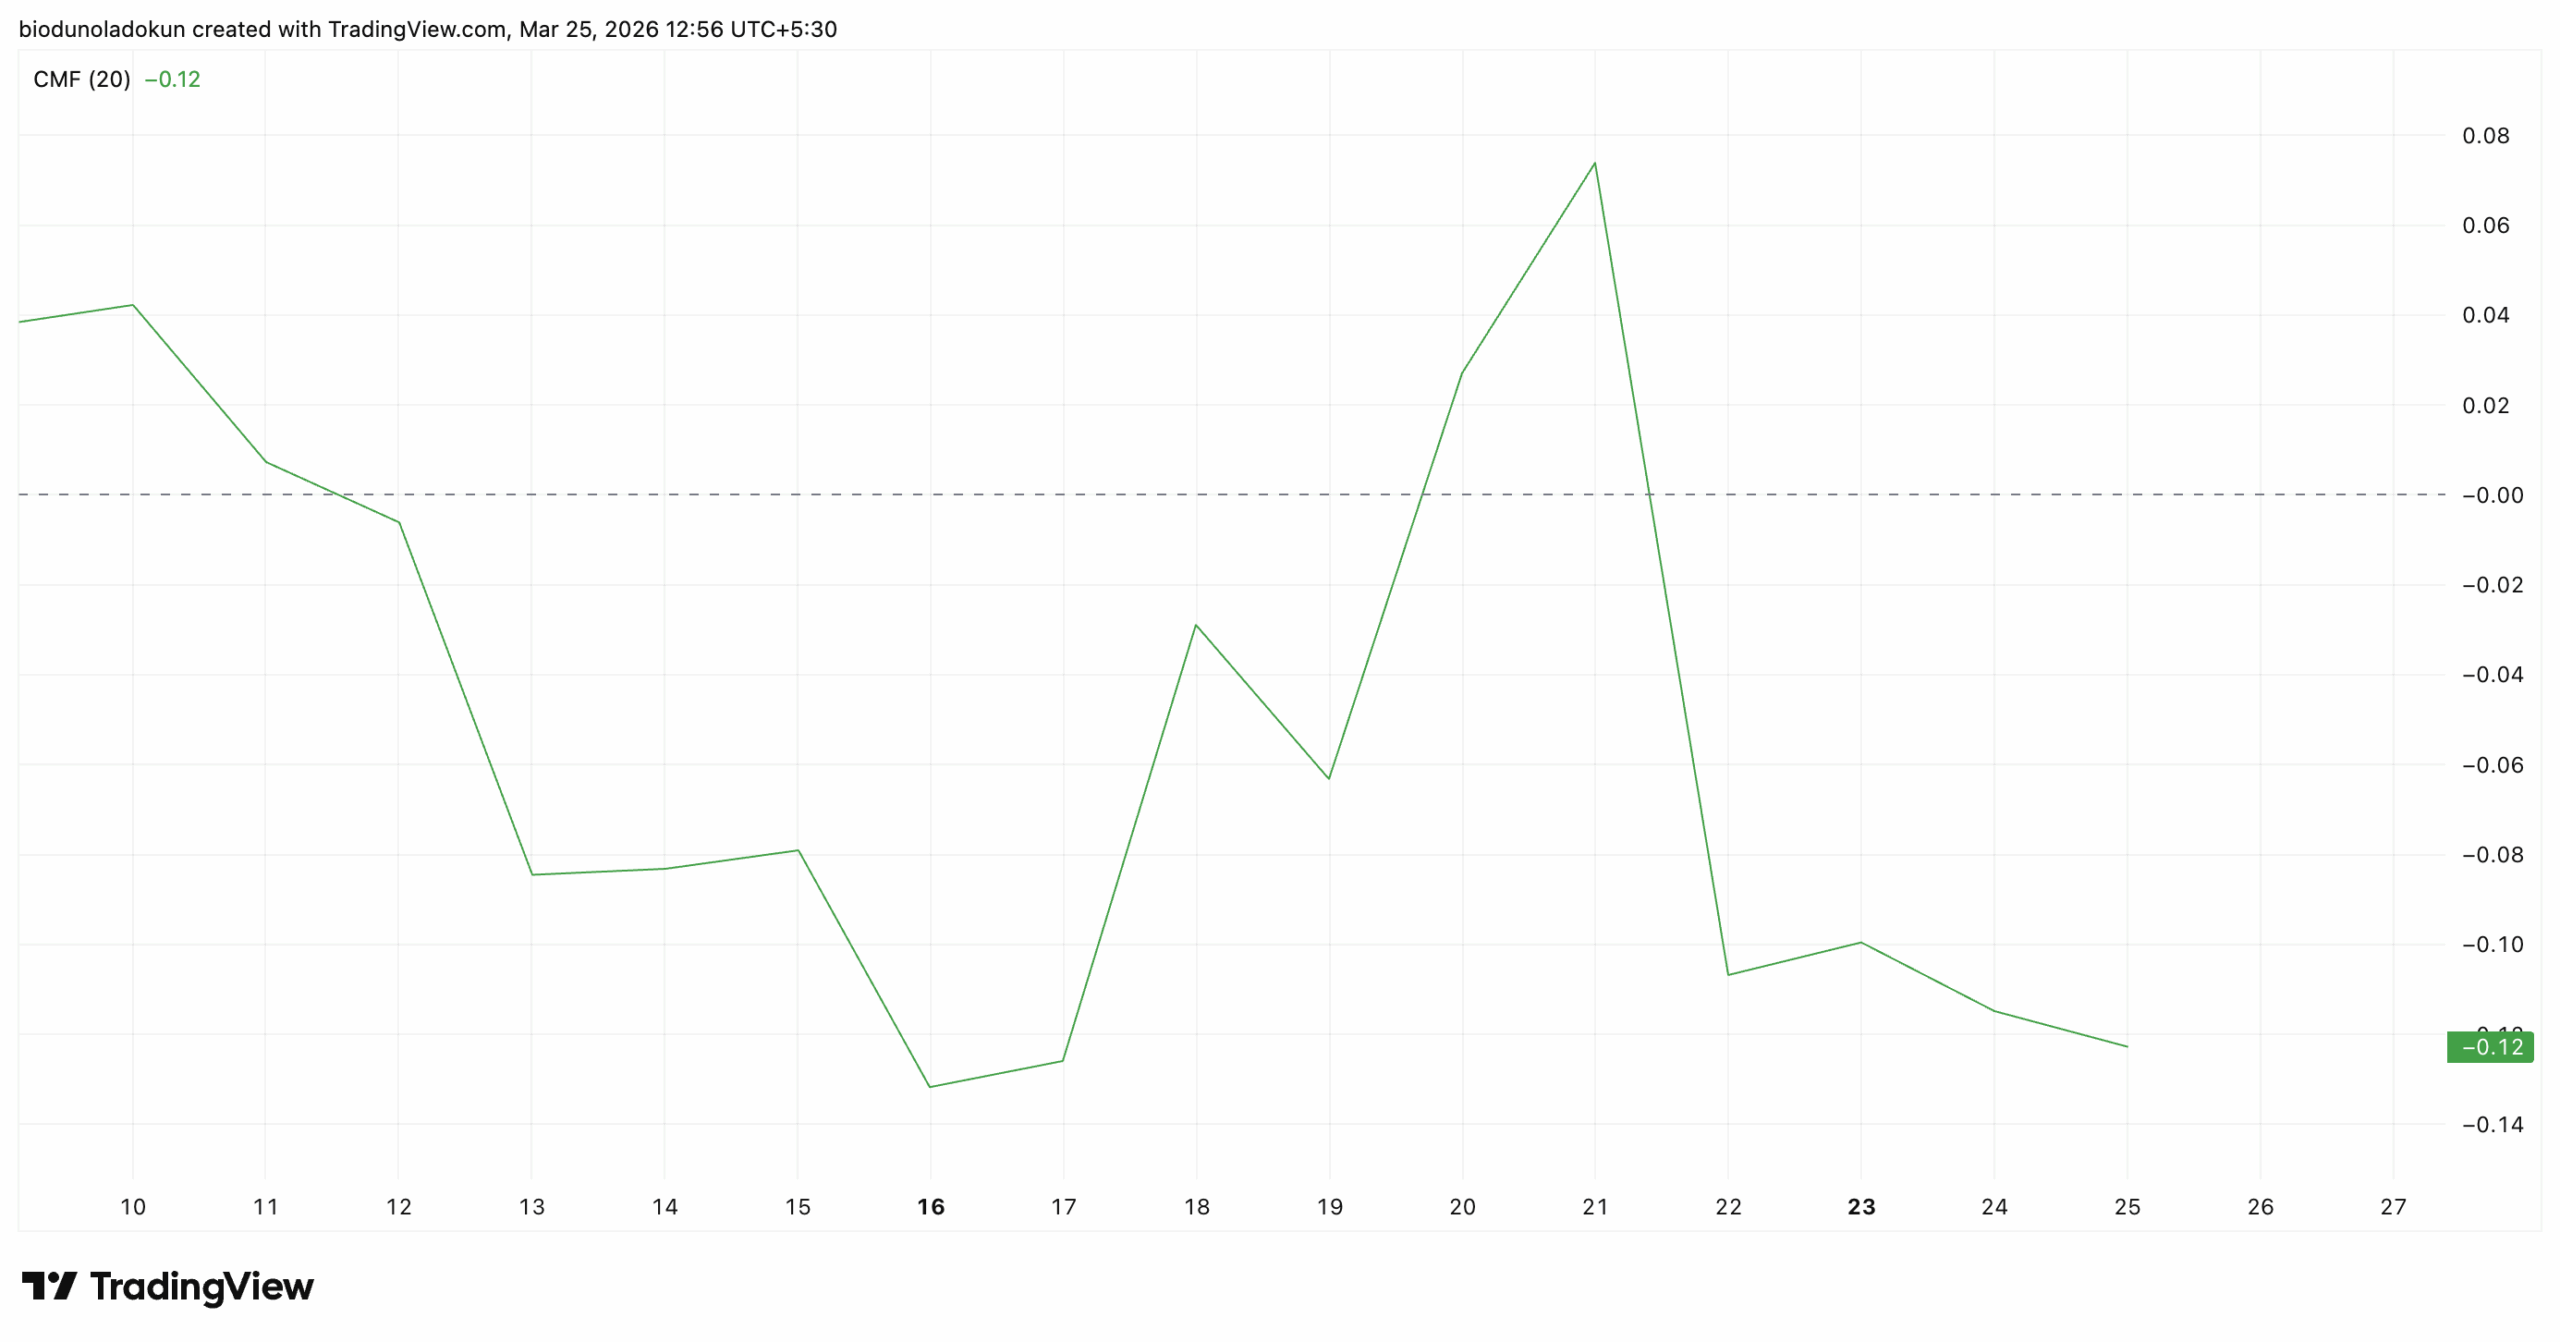
Moreover, on SIREN’s one-day chart, its Chaikin Money Flow (CMF) tells a similar story.
At press time, this momentum indicator sits below the zero line at -0.12 and continues to trend downward.
This signals that capital is flowing out of SIREN even as its price ticks higher, a pattern that historically precedes a correction.
The CMF indicator measures the flow of money into and out of an asset. When it trends lower and falls below zero during price rallies, it forms a bearish divergence.
This pattern signals that SIREN’s buying pressure is weakening beneath the surface despite the price appearing strong.
In scenarios like this, a price correction often follows once the remaining speculative momentum exhausts itself.
Derivatives Data Tells the Same Story
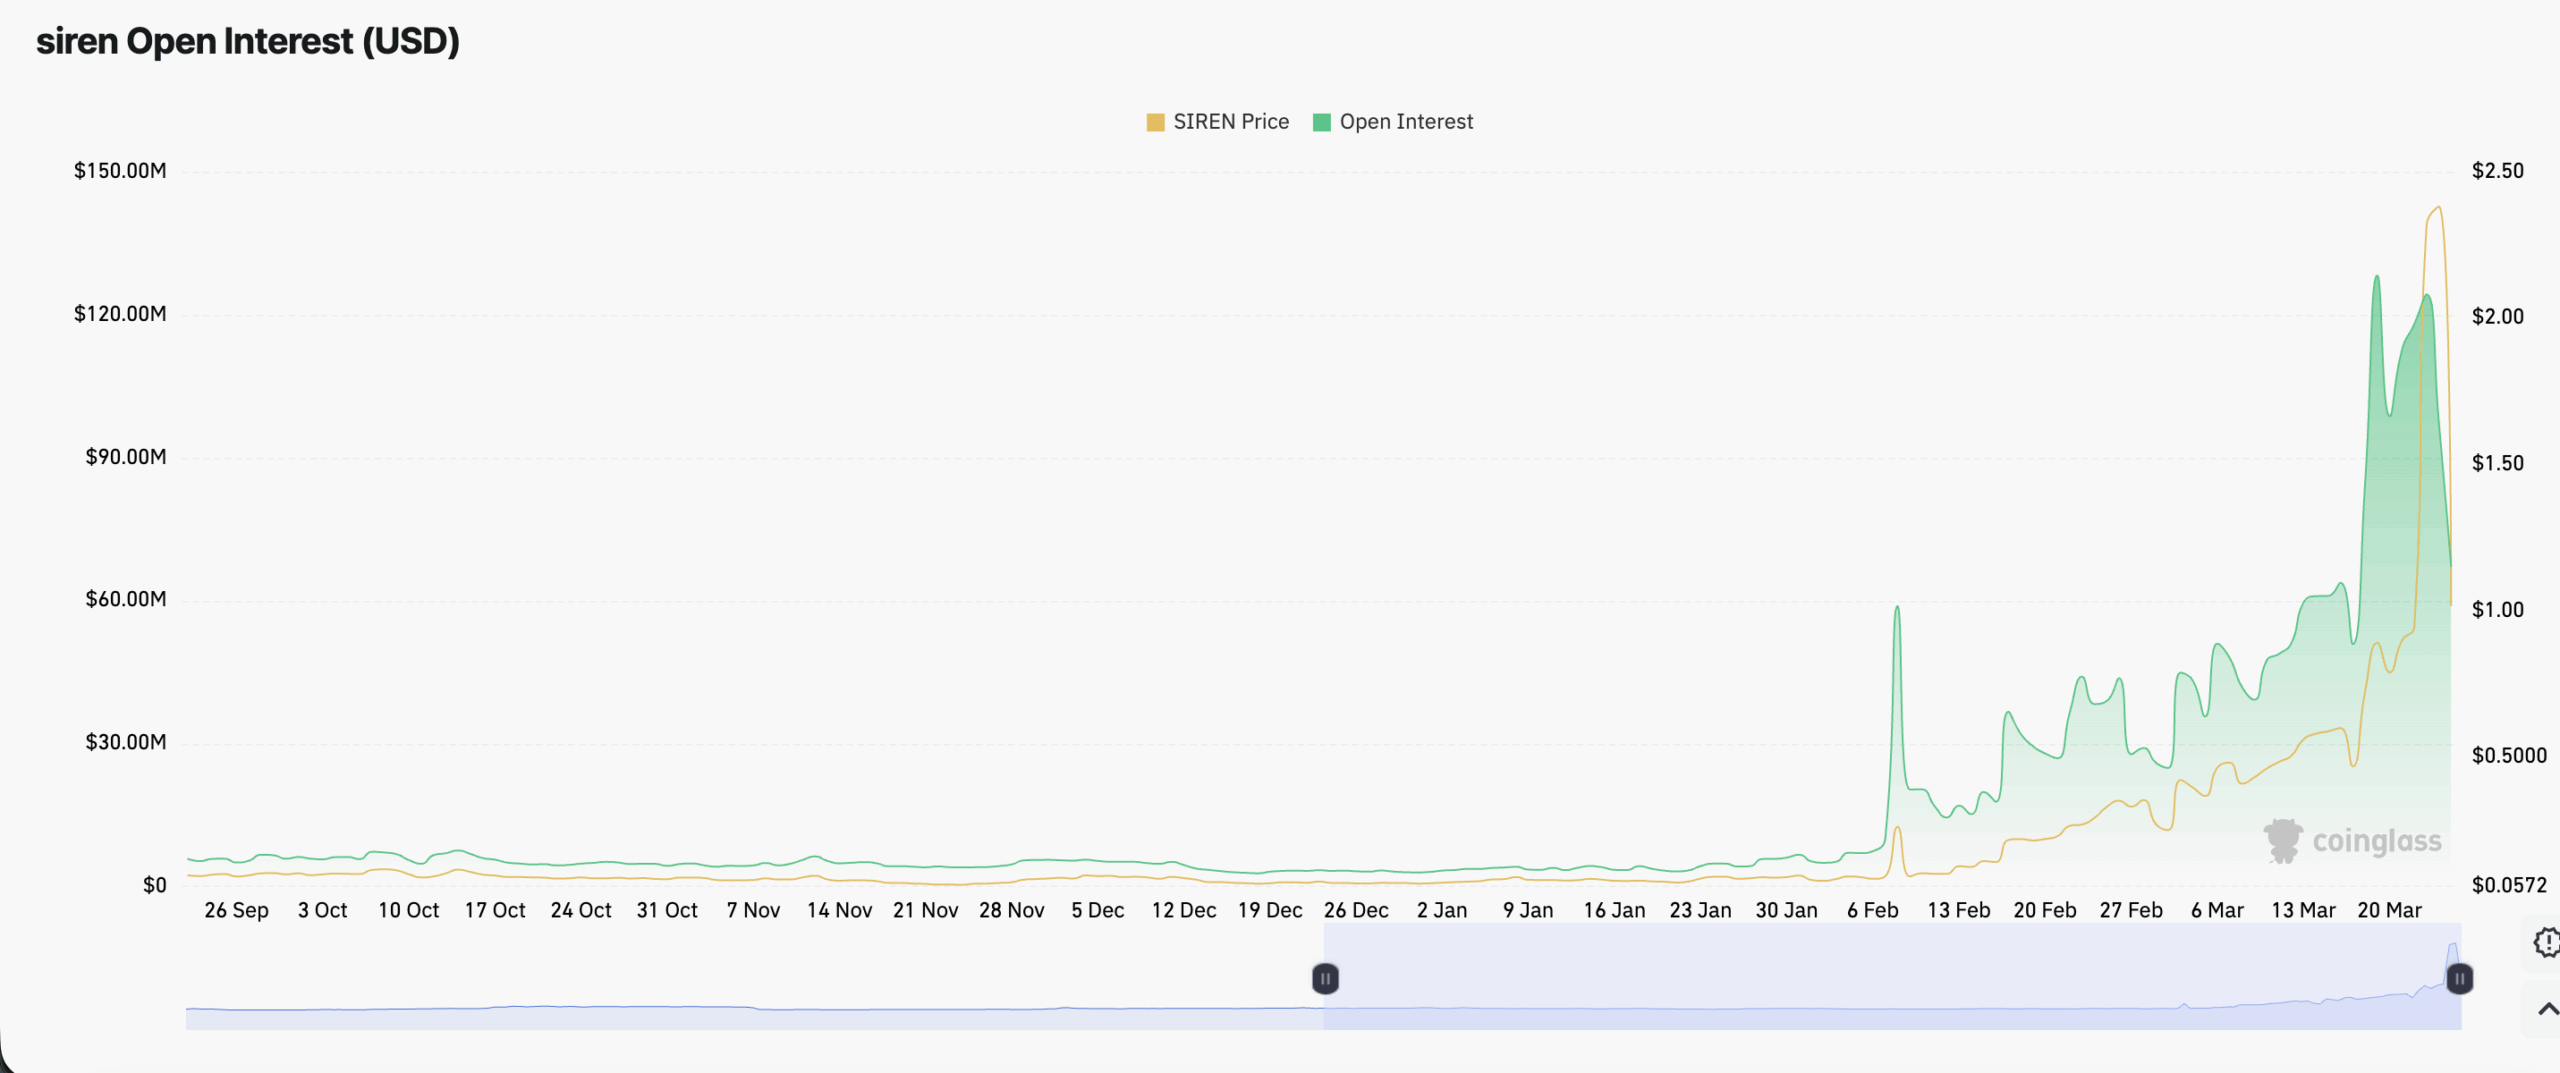
Among derivatives traders, sentiment is just as poor. Per Coinglass data, the token’s futures open interest has plummeted by 46% over the past two days and continues to decline at press time.
This kind of open interest drawdown against the backdrop of a 107% price surge is a significant red flag.
An asset’s open interest tracks the total value of active futures and options contracts in the market. When it falls as an asset’s price climbs, it means traders are closing out positions rather than opening new ones.
This is a sign that the rally is not attracting fresh capital from leveraged participants. Instead, existing positions are being unwound, which weakens SIREN’s uptrend and heightens the risk of a reversal.
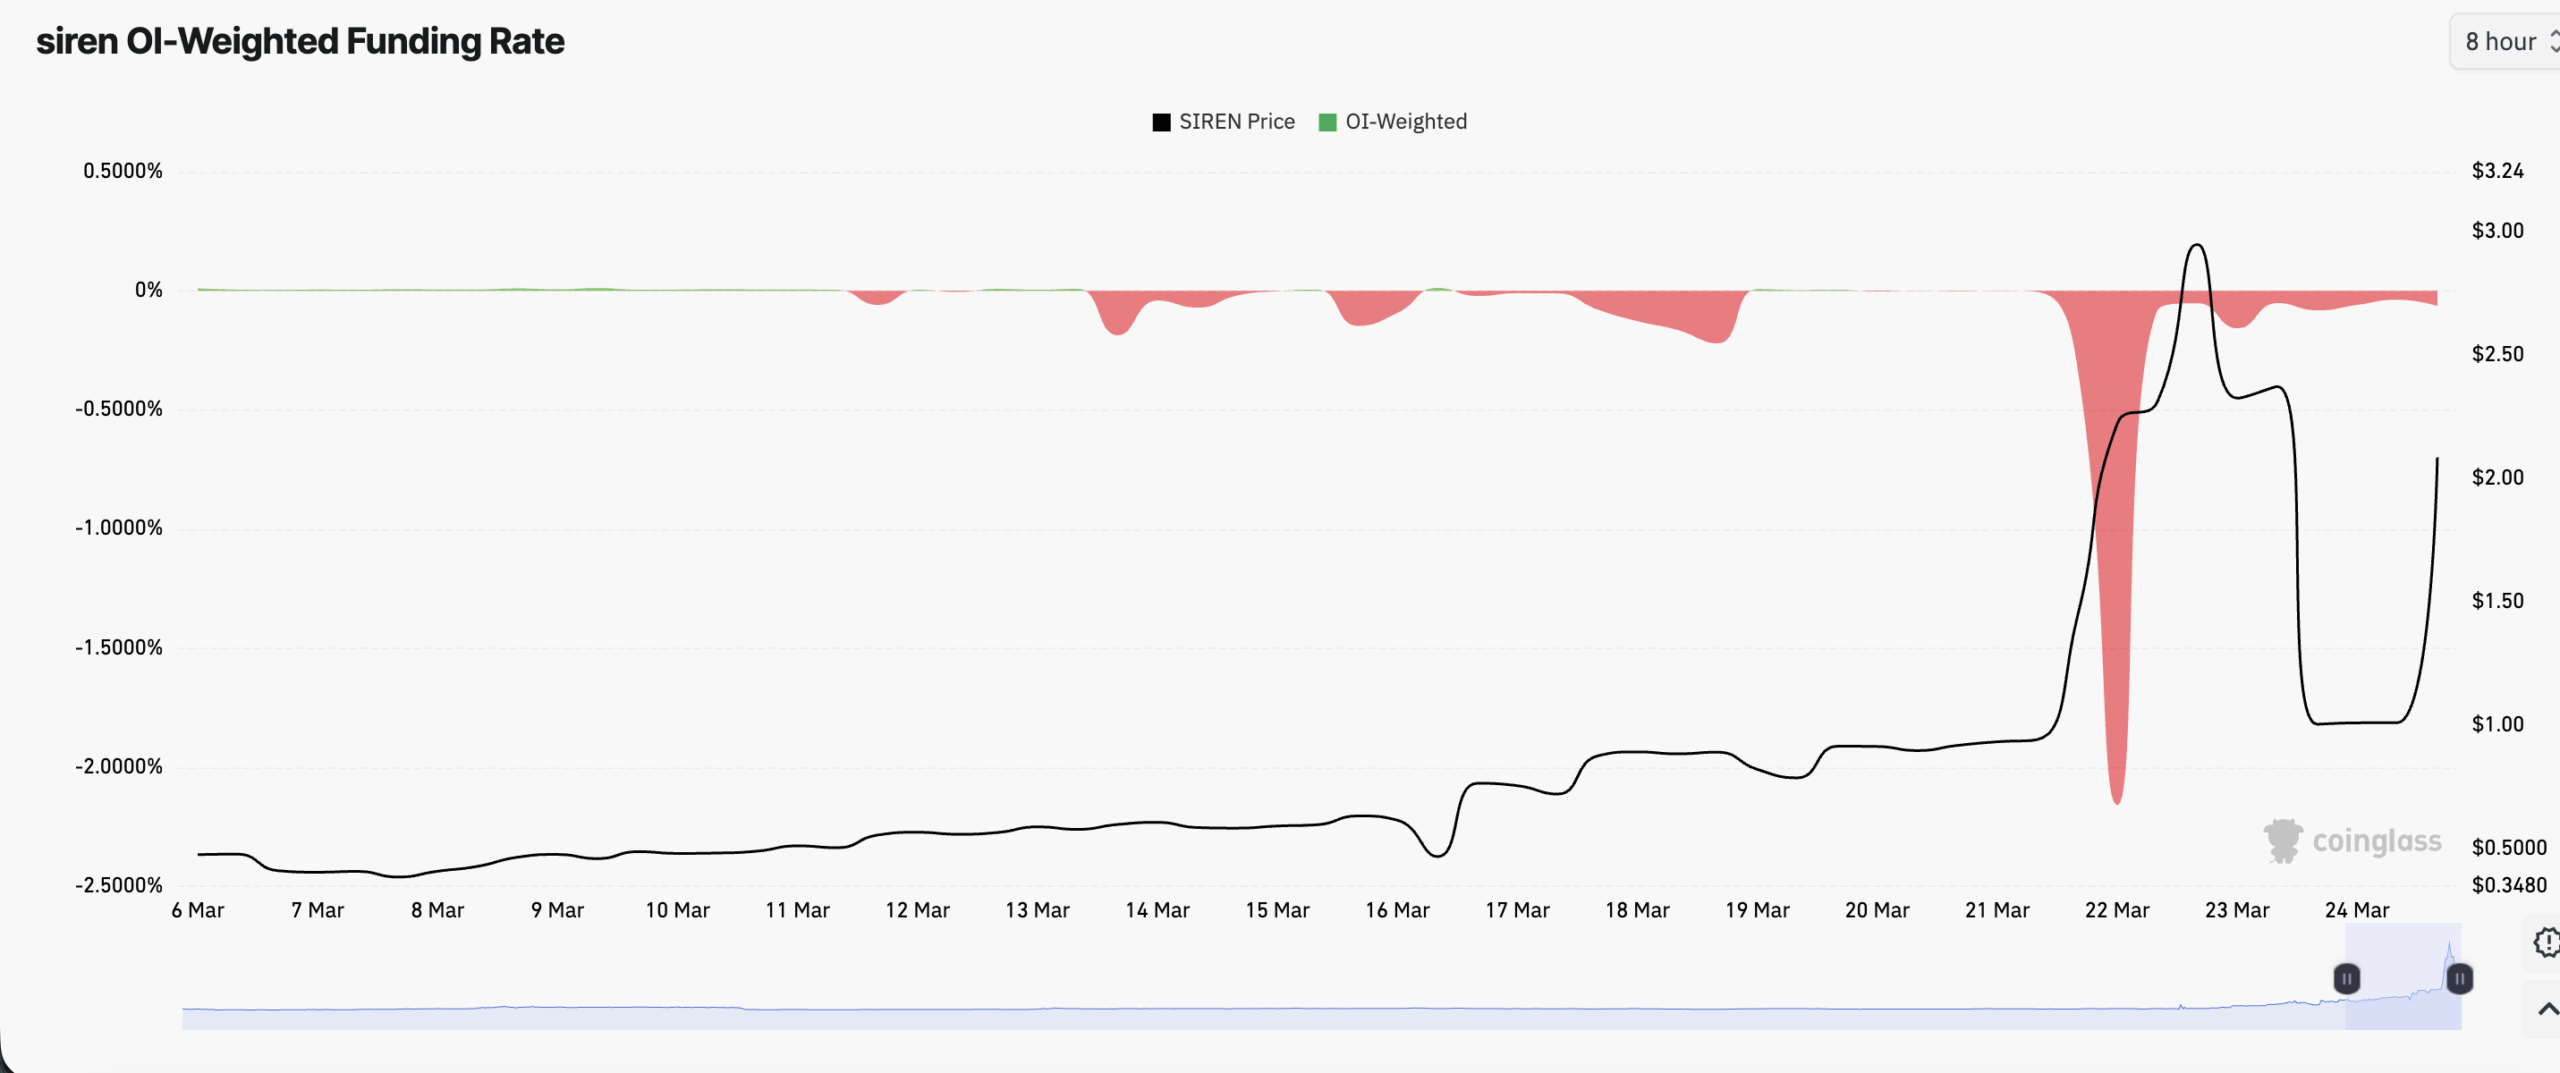
Furthermore, SIREN’s persistently negative funding rate since March 14 confirms this lack of derivatives-market confidence.
Per Coinglass data, the token’s funding rate has remained in negative territory for the better part of the past three weeks. At press time, it sits back below zero at -0.069%.
The funding rate is the periodic payment exchanged between long and short futures contract holders based on the difference between an asset’s spot price and futures price.
When an asset’s funding rate is positive, it means that long position holders are paying short, indicating a market bias toward bullish sentiment.
A persistently negative funding rate means short sellers are paying longs to hold their positions, reflecting dominant bearish sentiment among SIREN’s leveraged traders.
With open interest falling and funding rates negative, the derivatives market is signaling that the token’s current rally may be nearing its end.
One Level Separates a Recovery and a Wipeout
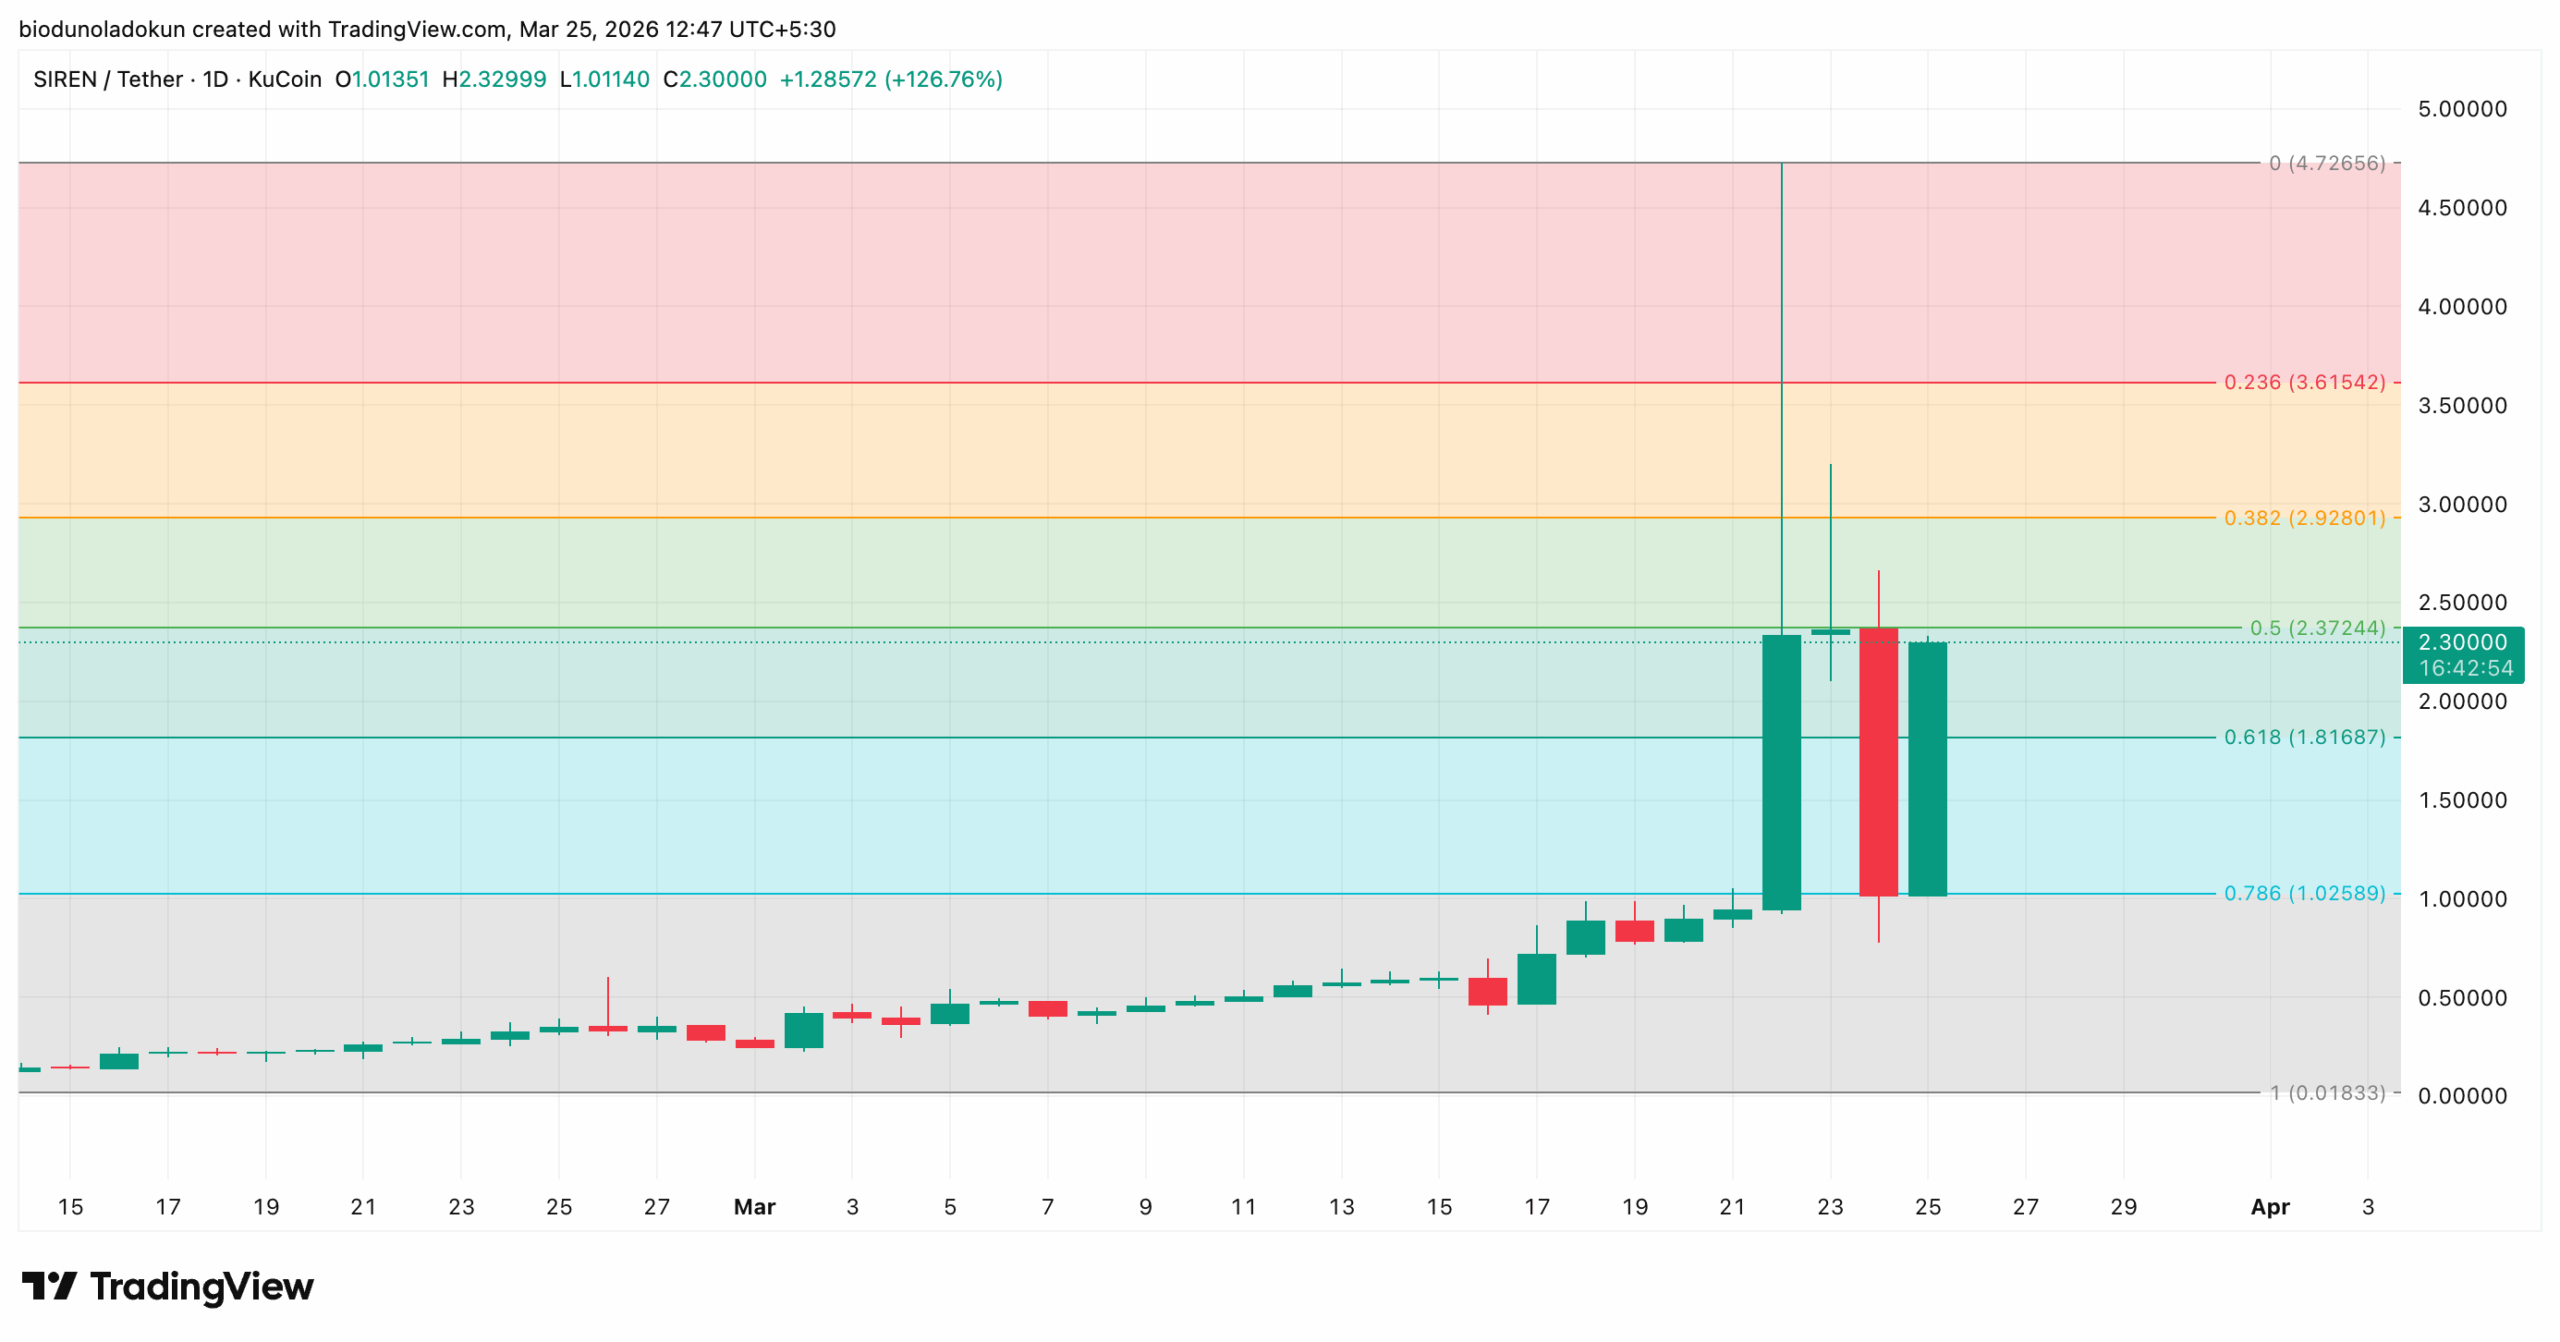
At press time, SIREN trades below the 0.5 Fibonacci retracement level at $2.37, which has solidified as a resistance zone over the past three days.
With technical and on-chain readings pointing to weakening buy-side pressure despite the token’s triple-digit surge, a reversal could see SIREN struggle to breach this resistance and pull back toward the support floor at $1.81.
A daily close below that level would open the door to a steeper decline toward $1.02.
However, if sentiment improves and fresh demand enters the market, this bearish outlook would be invalidated.
In that case, SIREN could clear the 0.5 Fibonacci level and climb toward the next resistance at $2.92.
Disclaimer:
The information provided in this article is for informational purposes only. It is not intended to be, nor should it be construed as, financial advice. We do not make any warranties regarding the completeness, reliability, or accuracy of this information. All investments involve risk, and past performance does not guarantee future results. We recommend consulting a financial advisor before making any investment decisions.
Abiodun Oladokun is a Research Analyst at CCN, where he covers cryptocurrency markets with a focus on on-chain analysis, technical assessments, and emerging trends across decentralized finance (DeFi), real-world assets (RWA), artificial intelligence (AI), decentralized physical infrastructure networks (DePIN), Layer 2s, and meme coins.
Prior to CCN, he served as a Senior On-Chain Analyst at BeInCrypto, producing market reports spanning diverse crypto sectors.
Before that, he conducted technical analysis and market assessments of various altcoins at AMBCrypto, where he also contributed long-form quarterly research papers on DeFi, NFTs, DAOs, and scaling architectures, leveraging on-chain platforms including Messari, Santiment, DefiLlama, and Dune Analytics.
He began his crypto career as a research analyst at SixthSense DAO, developing blockchain forensic tools to trace the history of stolen assets.
Abiodun is a lawyer called to the Nigerian Bar and the founder of Ilé Ijó, a Lagos-based electronic dance music collective.