Here's Why Silver Will Continue Rallying | Credit: Derek Fenech
Share
Key Takeaways
Silver reached a new all-time high price of $53.57 yesterday.
The metal has increased by 80% since the start of the year.
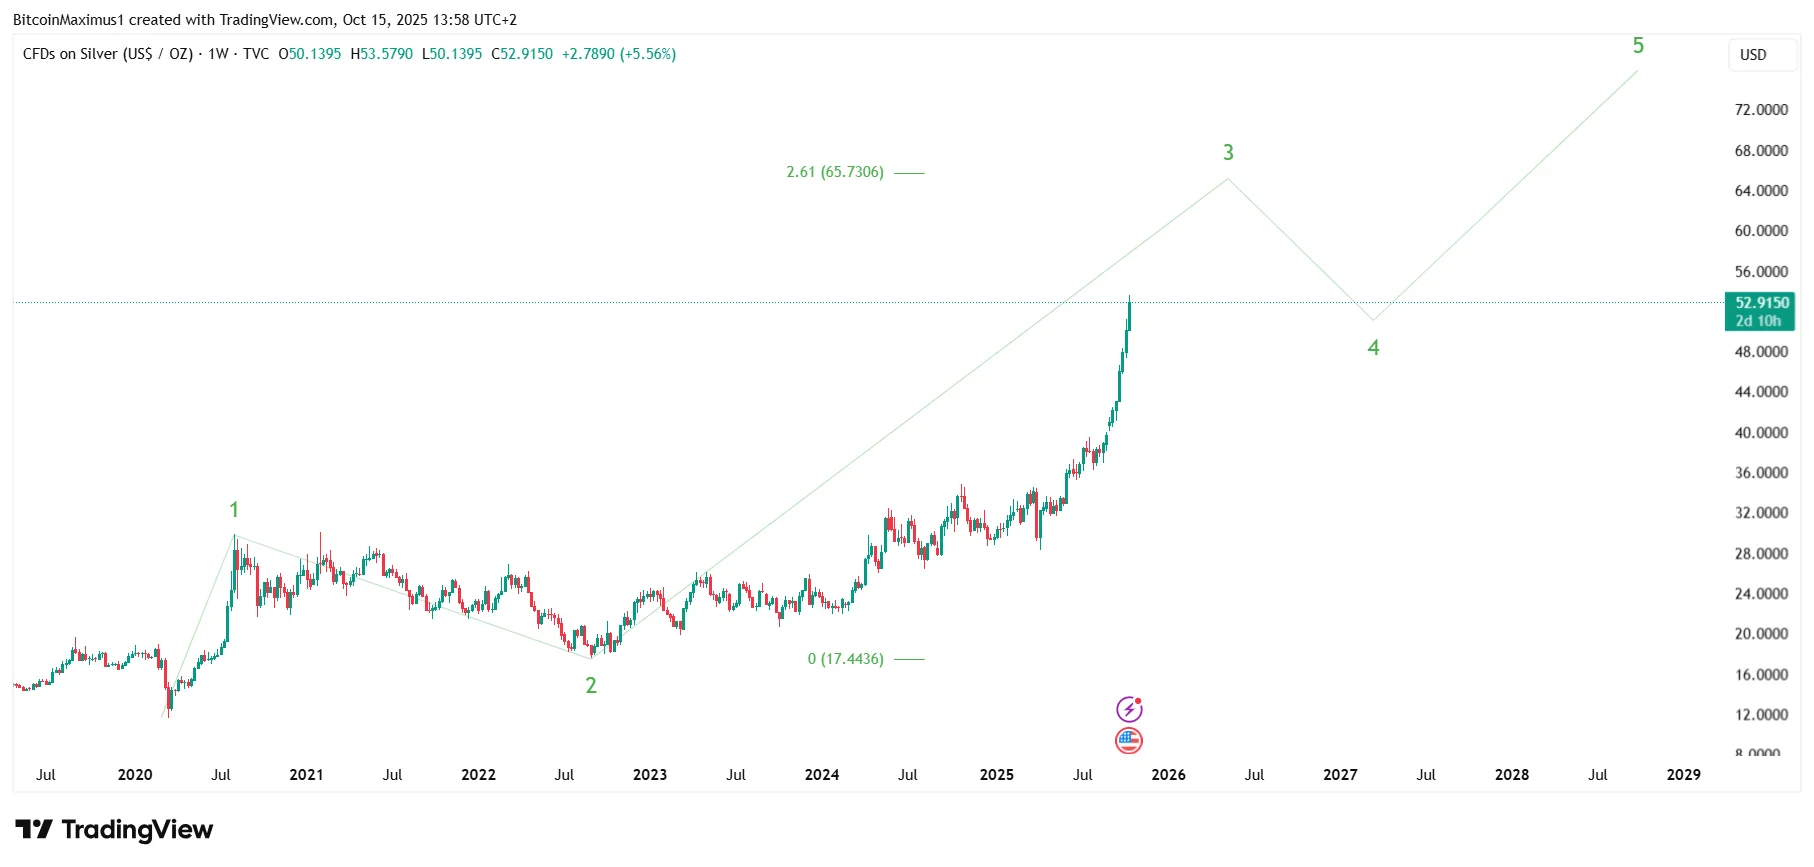
How long will Silver’s parabolic increase continue?
Silver (XAG) has set a new record, surging to an all-time high price of $53.57.
The precious metal has been on a tear in 2025, gaining 80% since the start of the year.
This breakout comes after decades of consolidation under long-term resistance levels.
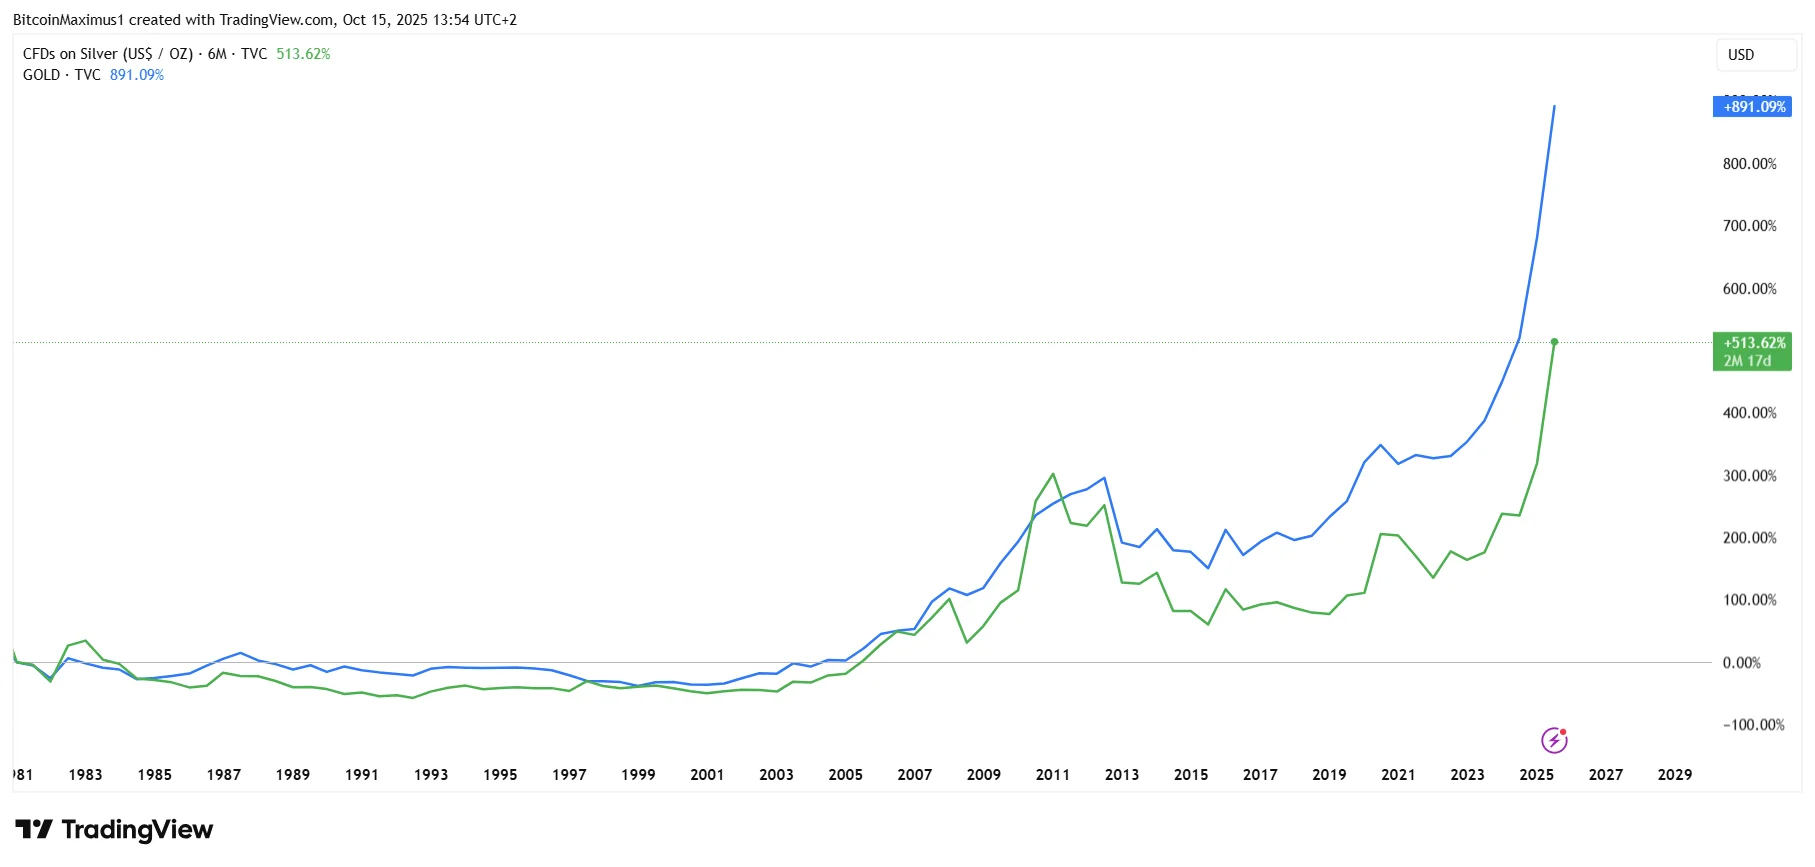
Gold (XAU) has previously led the way, and if Silver catches up, its parabolic rally will have room to run.
Silver Hits All-Time High
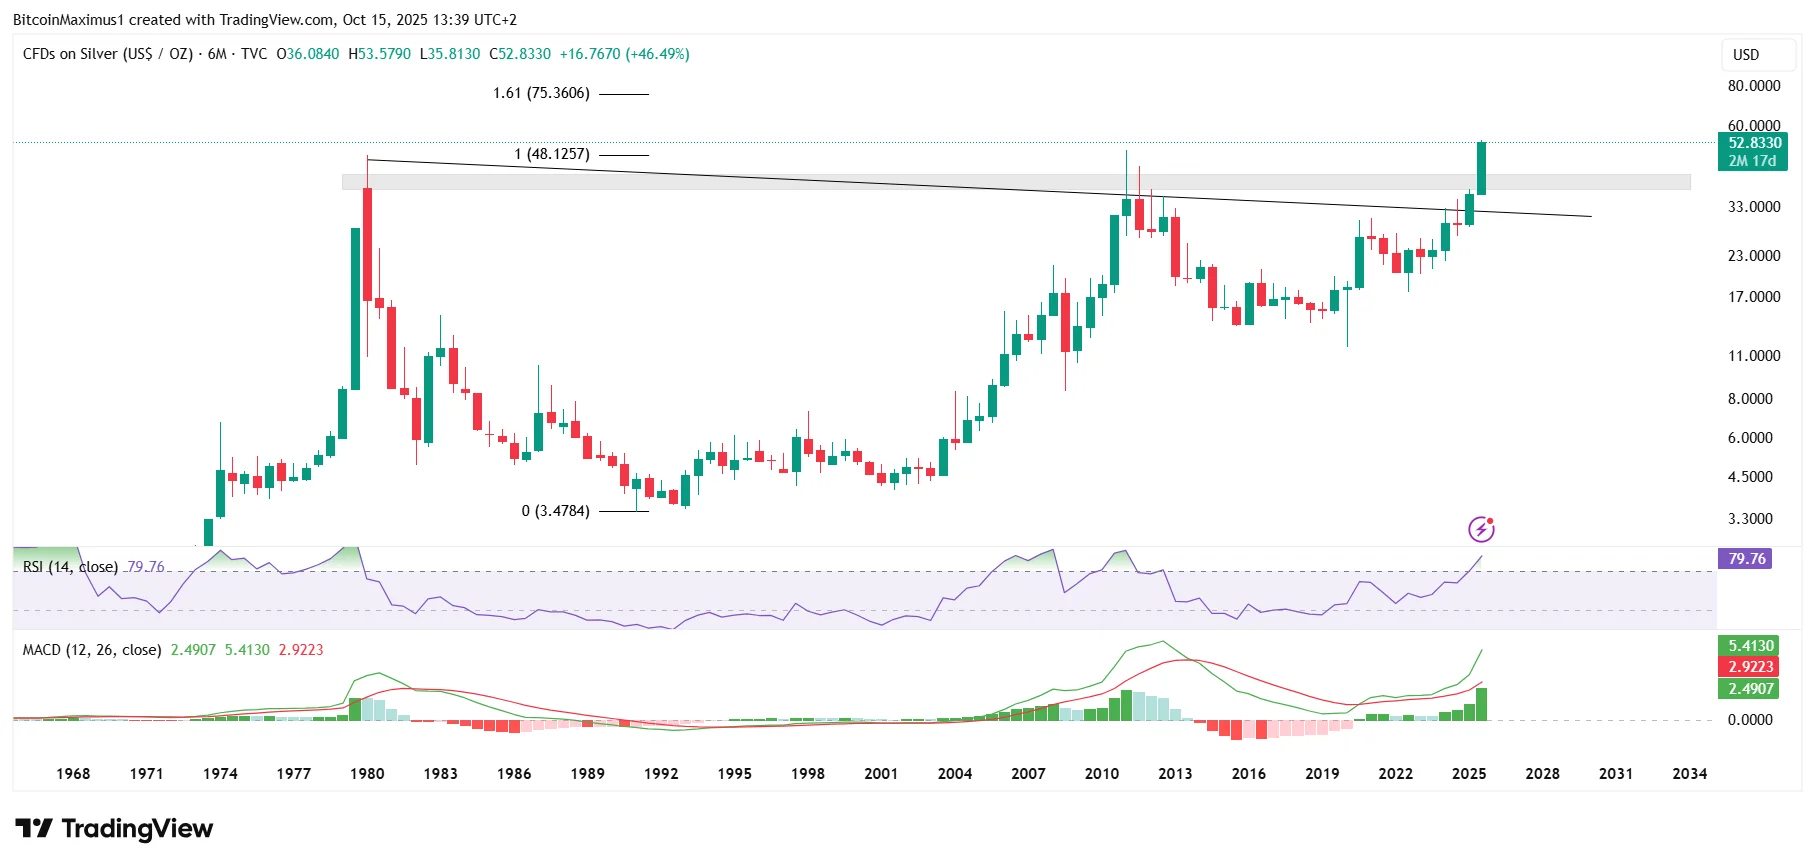
The SILVER price had declined since reaching its original all-time high of $48 in January 1980.
Since then, SILVER has fallen under a descending resistance trend line, and even though it briefly reached a new all-time high in January 2011, it failed to sustain that high.
The subsequent rejection created the $40 horizontal resistance area until this month.
Get These Top Crypto Casino Offers Now!
Sponsored
Disclosure
We sometimes use affiliate links in our content, when clicking on those we might receive a commission at no extra cost to you. By using this website you agree to our terms and conditions and privacy policy.
Disclaimer:
The information provided in this article is for informational purposes only. It is not intended to be, nor should it be construed as, financial advice. We do not make any warranties regarding the completeness, reliability, or accuracy of this information. All investments involve risk, and past performance does not guarantee future results. We recommend consulting a financial advisor before making any investment decisions.
Valdrin Tahiri is a cryptocurrency analyst and reporter at CCN, specializing in technical analysis with a focus on Elliott Wave theory, on-chain metrics, and fundamental research. He brings over seven years of experience in the crypto space as both a trader and writer.
He discovered cryptocurrencies in 2017 while earning his MSc in Financial Markets at the Barcelona School of Economics, which sparked a deep interest in blockchain and market dynamics. Since then, he’s contributed to top crypto outlets like BeInCrypto and CoinGape.
Valdrin also served as Community Manager of BeInCrypto’s Telegram group for three years, helping grow it into one of the largest crypto communities worldwide. His expertise in market structure and price patterns allows him to break down complex trends into clear, actionable insights.
He’s published thousands of articles covering altcoins, Bitcoin cycles, and macro trends.