Gold or Ethereum to $5K first? | Credit: Hameem Sarwar
Share
Key Takeaways
Gold surged over 50% YTD, while Ethereum’s price rose nearlty 30%.
ETH aims to follow the Elliott Wave structure of gold to validate the breakout.
Which asset will hit $5,000 first? This analysis examines that.
Gold has once again reminded investors this year why it’s considered the ultimate safe-haven asset.
Year-to-date (YTD), the metal has surged more than 50%, climbing above $4,000 before briefly pulling back below that threshold.
The rally has reignited discussions among analysts, with many predicting that Gold could reach $5,000 before the end of 2025.
Meanwhile, Ethereum (ETH), often referred to as the “crypto silver” to Bitcoin’s “digital gold,” has also recorded solid gains this year.
ETH’s price is up roughly 30% YTD, having flirted with the $5,000 zone earlier before retracing.
While both assets remain below this key milestone, the race to $5,000 is intensifying. Now, which one will get there first: Gold or Ethereum?
Ethereum vs. Gold
At press time, Ethereum’s price is $4,330, while Gold is hovering around $3,972. This puts both assets within striking distance of the coveted $5,000 mark.
When viewed side by side, the weekly charts of both markets tell an interesting story.
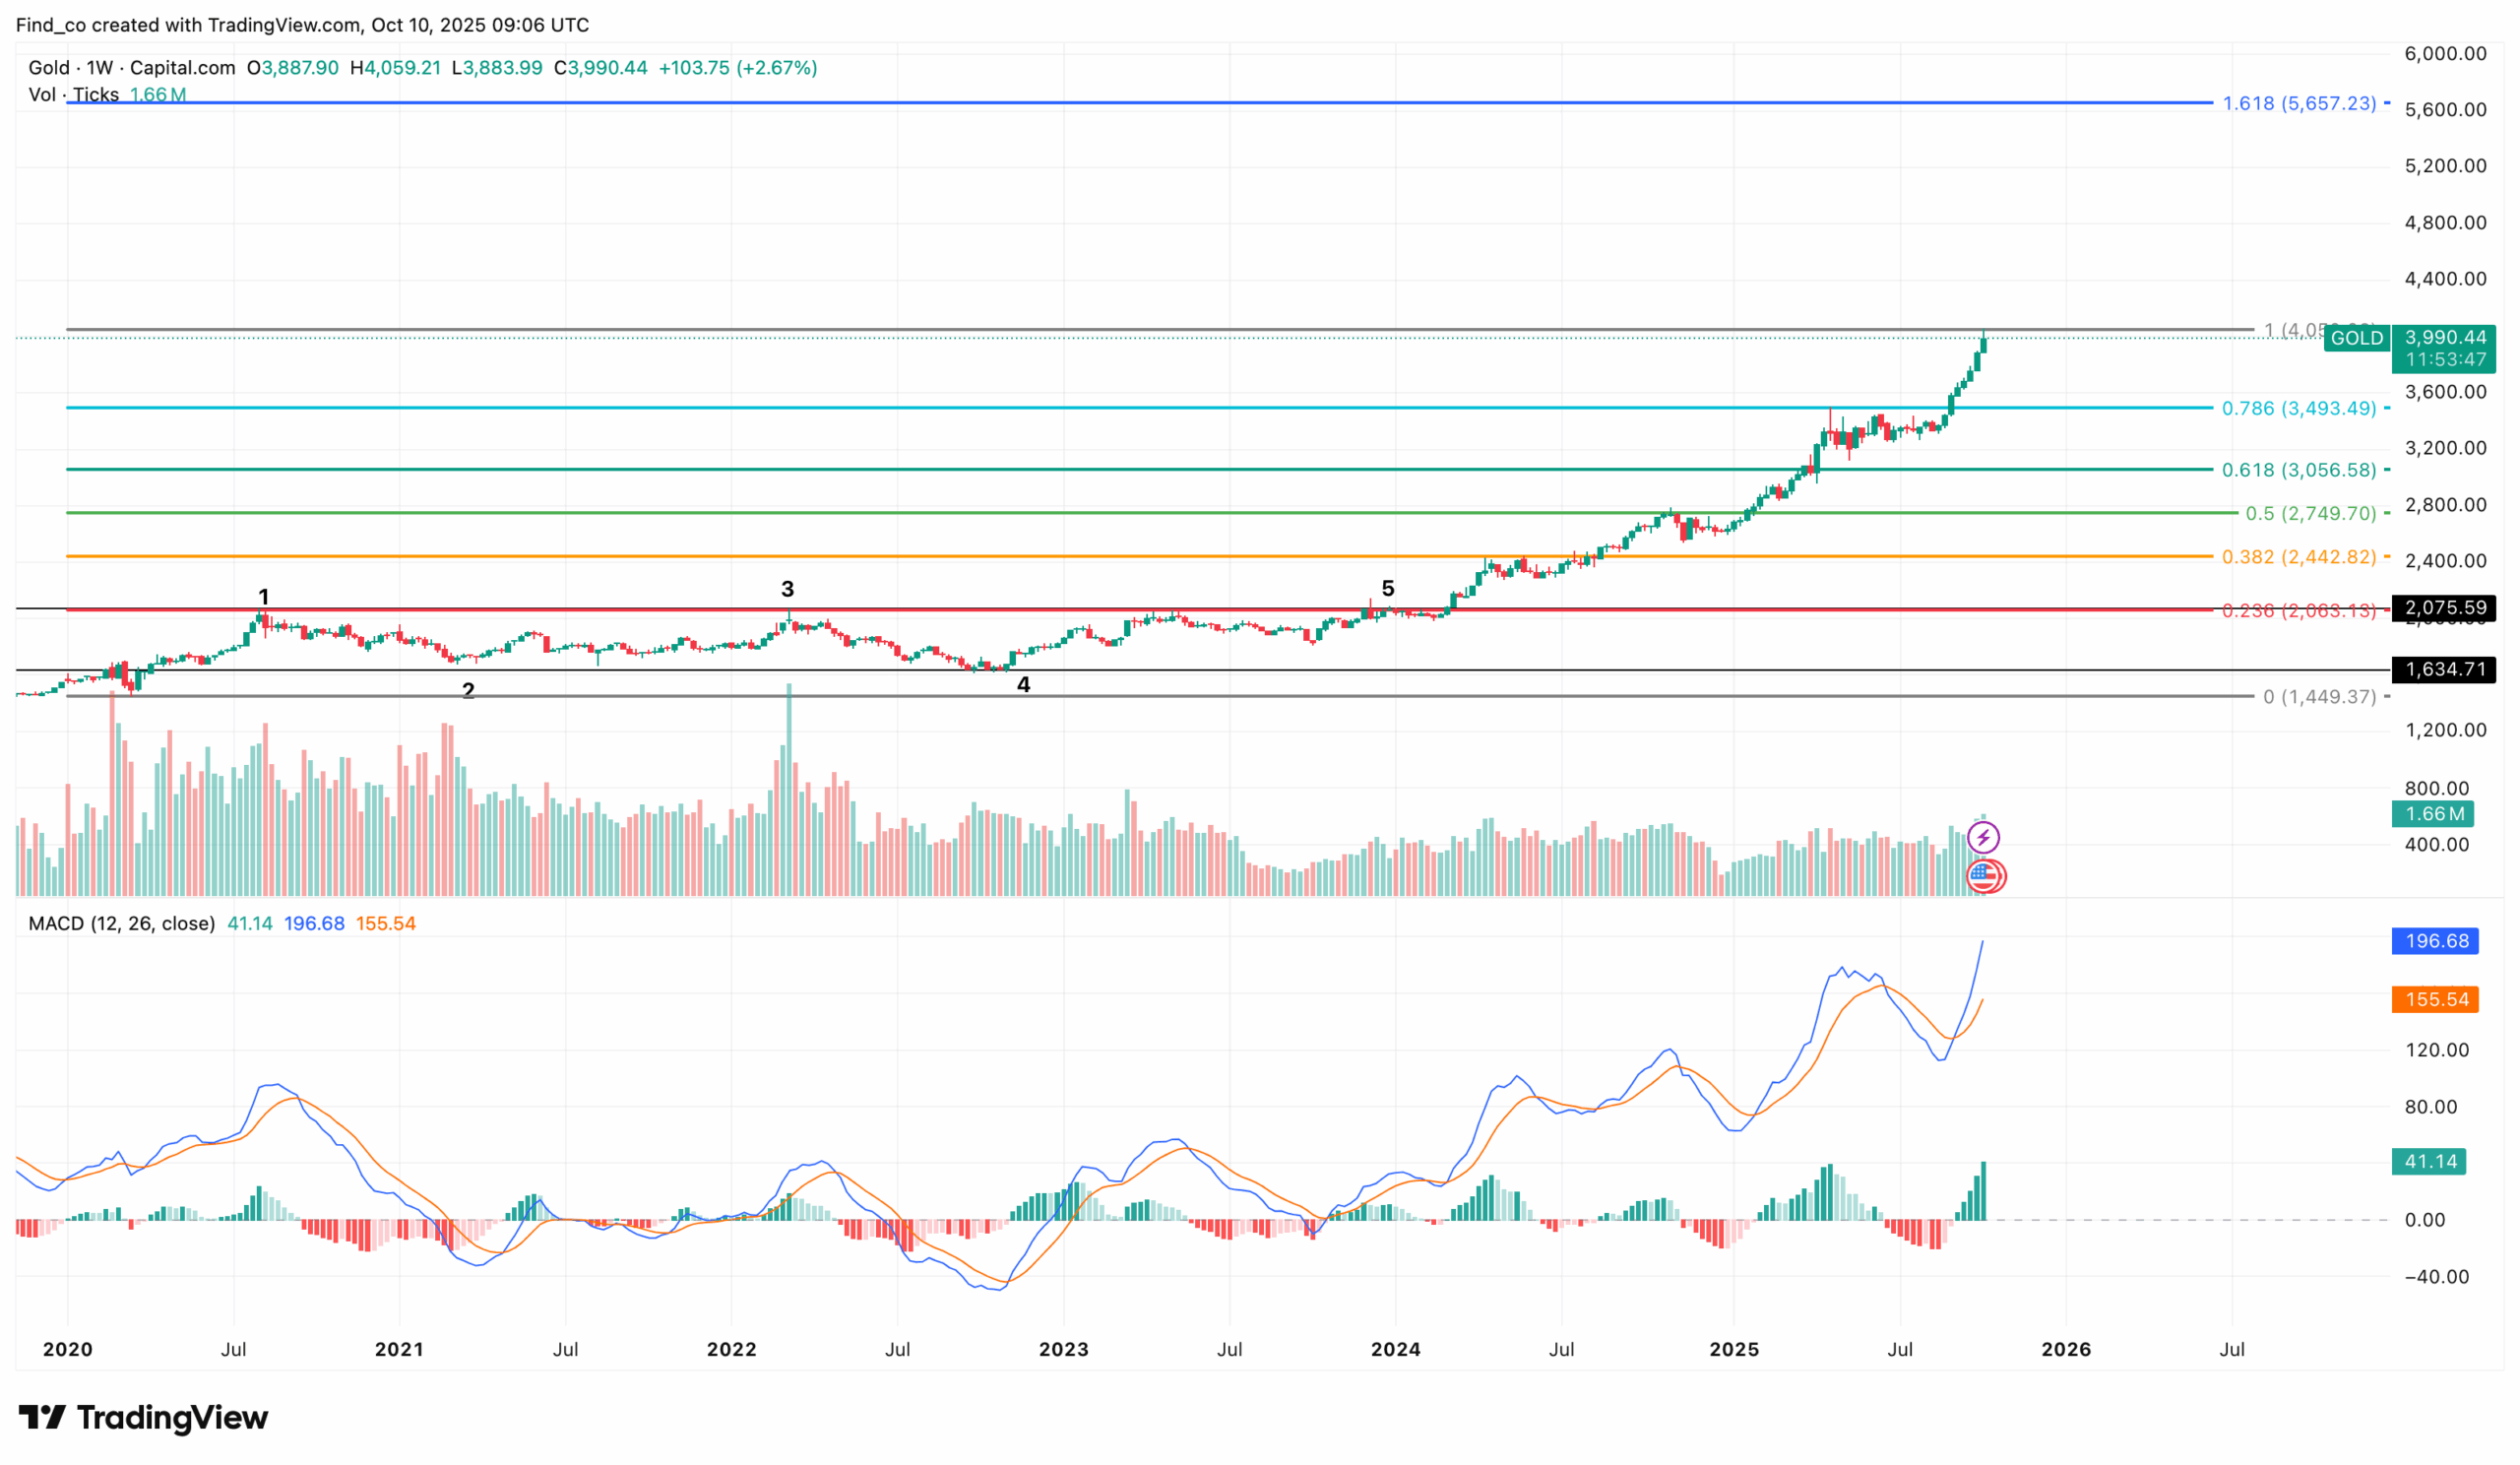
Gold appears to have completed a classic five-wave Elliott pattern, a structure that precedes a strong continuation rally.
Get These Top Crypto Casino Offers Now!
Sponsored
Disclosure
We sometimes use affiliate links in our content, when clicking on those we might receive a commission at no extra cost to you. By using this website you agree to our terms and conditions and privacy policy.
The fifth wave, which marks the final accumulation stage before a potential parabolic move, suggests that momentum could continue to accelerate if buying pressure is sustained.
Gold Completes Five-Wave
Historically, such five-wave completions have preceded major macro breakouts in Gold during monetary easing, inflation fears, or geopolitical instability.
Still, the asset’s price is yet to rise to $5,000. However, the Moving Average Convergence Divergence (MACD) on the weekly chart shows that it has formed a bullish crossover.
Gold Weekly Chart | Credit: TradingView
If sustained in the weeks and months to come, Gold’s price might hit $5,000. In fact, the Fibonacci indicator predicts that the asset’s value could reach $5,657 at the 1.618 level.
ETH On the Verge
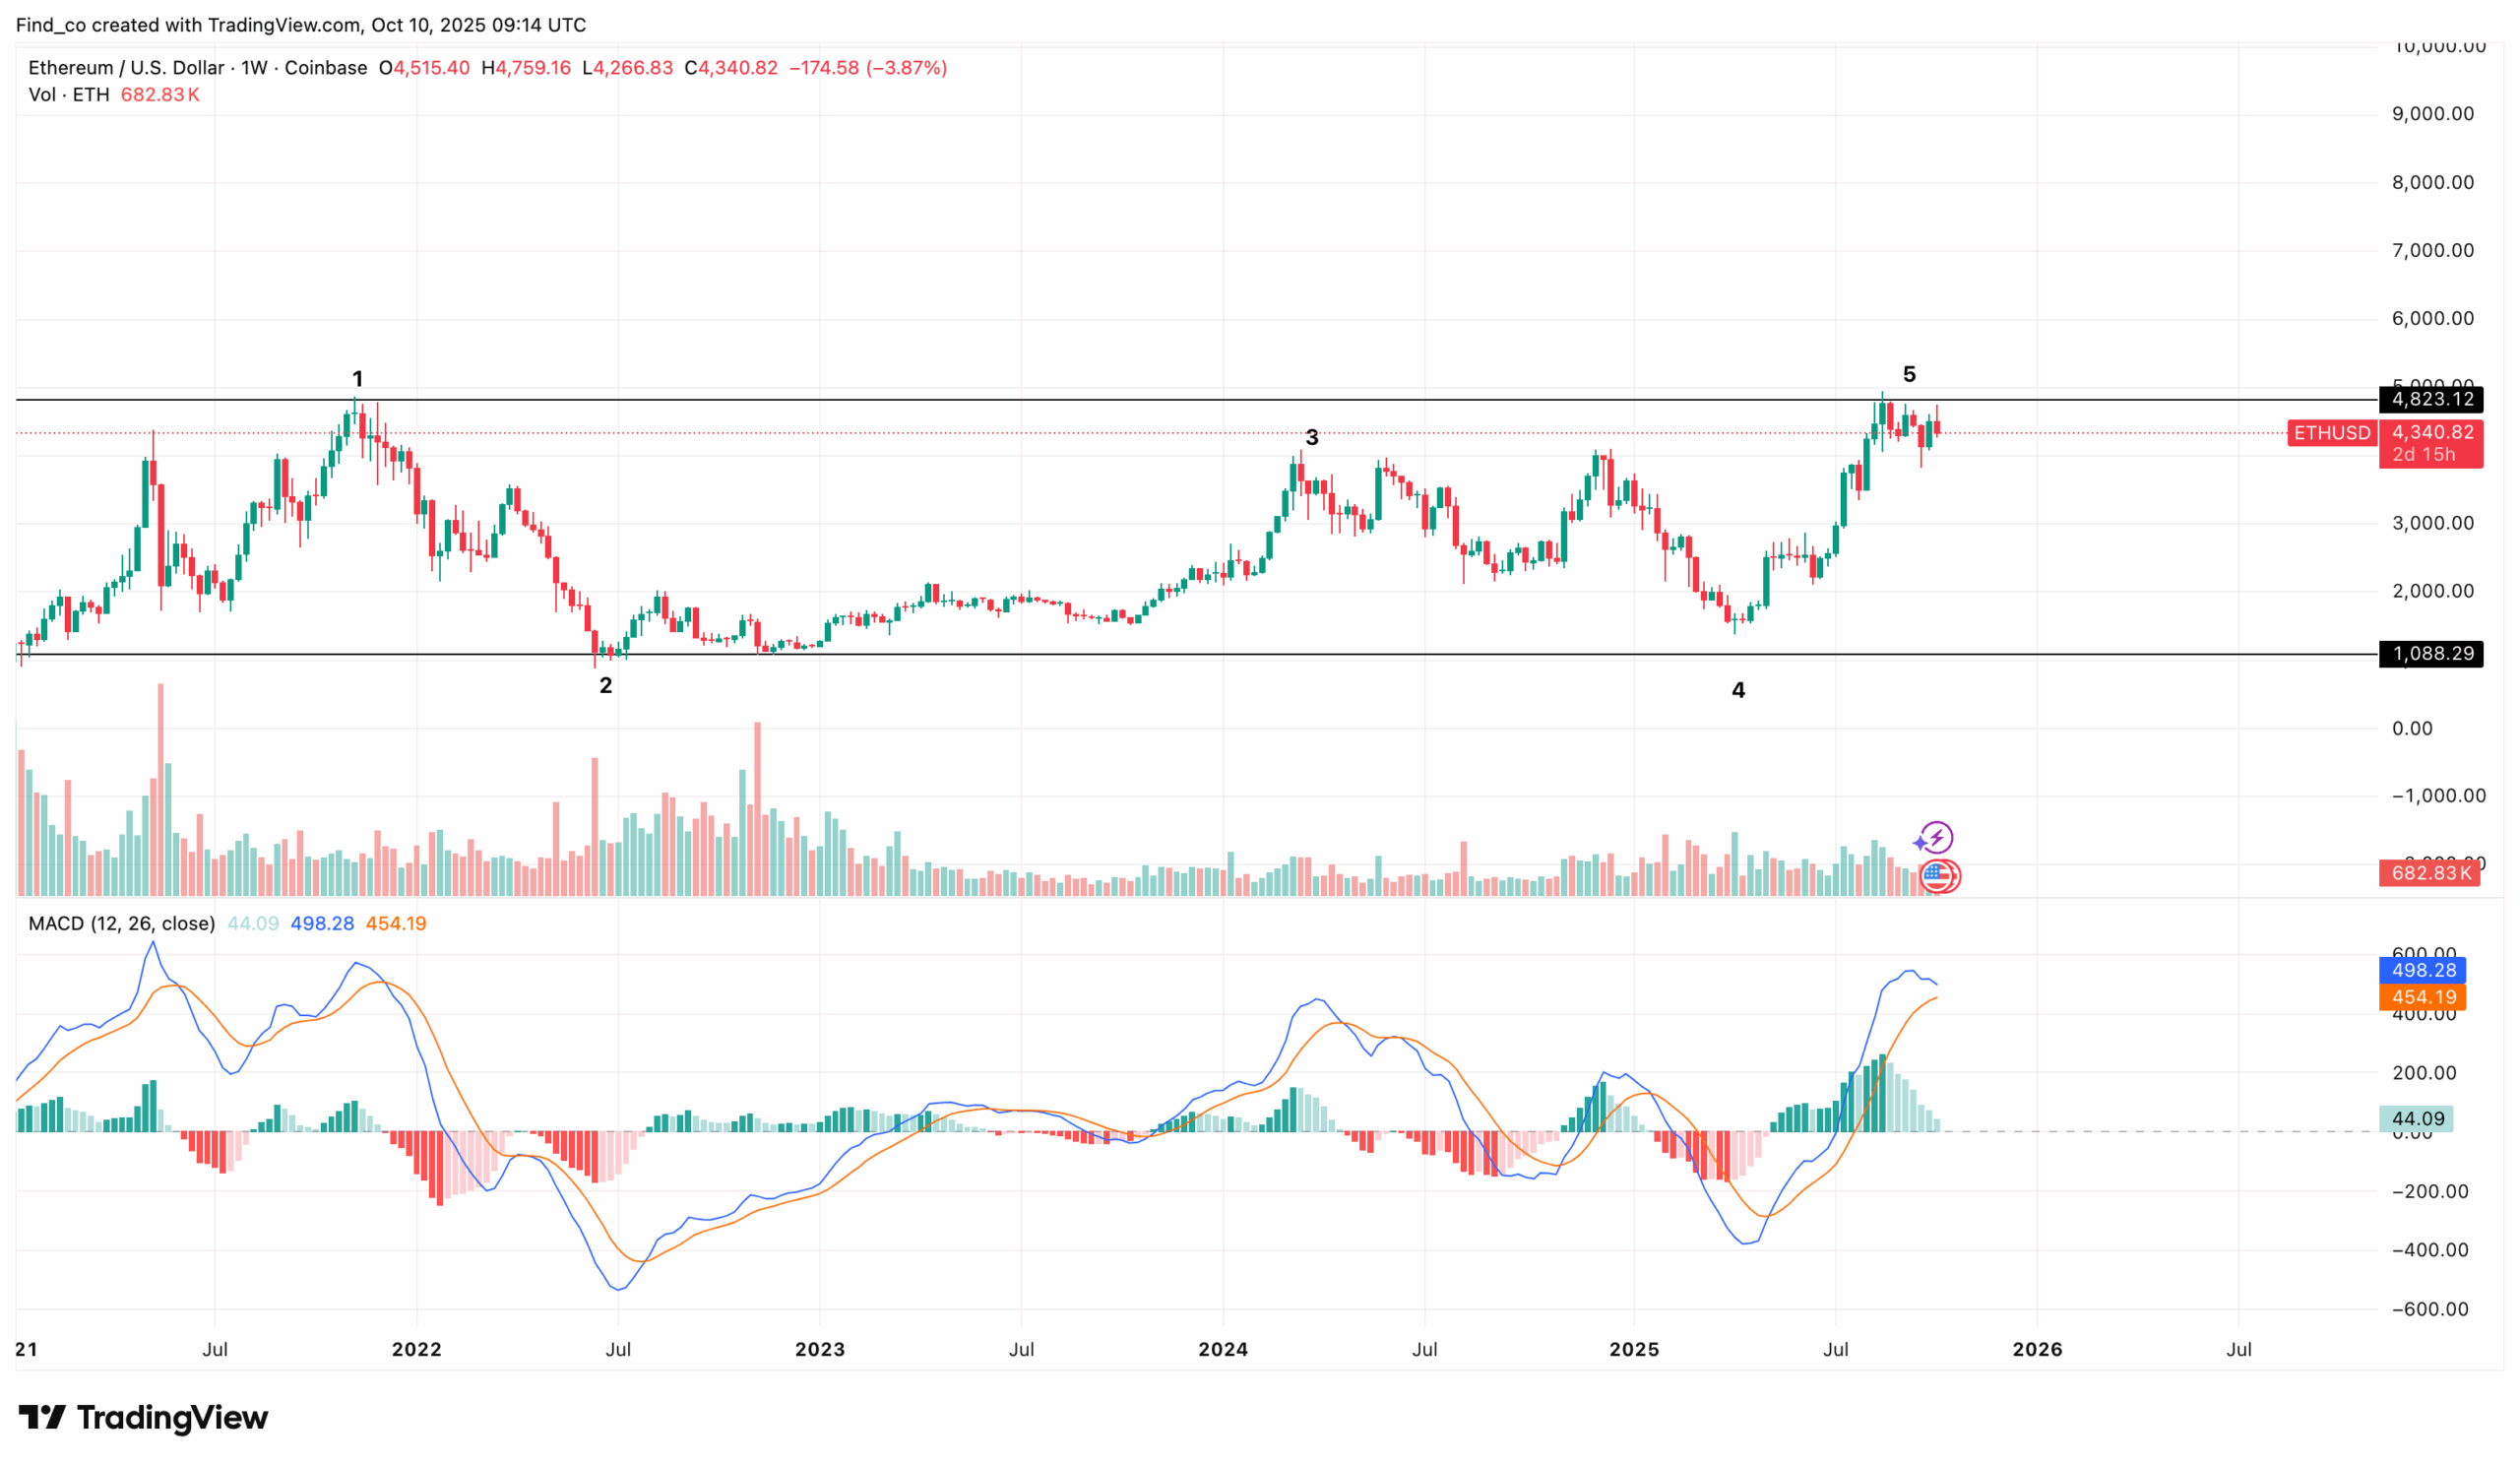
Ethereum, however, is showing early signs of following Gold’s setup. But in this case, with higher volatility. As shown below, Ethereum’s price appears to be completing the same wave.
Similar to the Gold chart, the ETH/USD weekly chart indicates that the MACD is positive and has formed a bullish crossover. However, ETH still faces some resistance ahead.
Forming a megaphone pattern signals growing volatility and uncertainty in market direction.
However, the Bull Bear Power (BBP) reading in the negative zone suggests that bears currently have the upper hand.
This weakness aligns with the Awesome Oscillator (AO), which has begun flashing red histogram bars, indicating that bullish momentum is fading.
If the AO continues to print red bars while the BBP stays negative, ETH could retest the lower boundary of the megaphone pattern, likely near $3,898. A breakdown below that zone might drag the price toward the $3,602 support level.
While there is support around $3,898, Ethereum’s price must break the resistance at $4,740 and hit $5,000 before Gold.
However, as it stands, it remains unlikely to know which will hit $5,000 first. For Gold’s price, it presents a bullish structure that could drive it higher in the following weeks.
ETH could also do the same, but requires intense buying pressure from the current level.
Disclaimer:
The information provided in this article is for informational purposes only. It is not intended to be, nor should it be construed as, financial advice. We do not make any warranties regarding the completeness, reliability, or accuracy of this information. All investments involve risk, and past performance does not guarantee future results. We recommend consulting a financial advisor before making any investment decisions.
Victor Olanrewaju is a crypto analyst and reporter at CCN with deep roots in on-chain research and technical analysis. His crypto journey began in 2017, but it was the 2020 Uniswap airdrop that sparked a full-time pivot into the space.
With a foundation in copywriting, Victor honed his craft creating high-converting content for leading crypto brokers — most notably an XRP price prediction that ranked #1 on Google during the 2021 bull run.
He later joined AMBCrypto in 2022, where he combined storytelling with technical and on-chain analysis to cover key market narratives.
In 2024, he expanded his expertise at BeInCrypto, collaborating with analysts and using tools like Glassnode, Santiment, and IntoTheBlock to break down Bitcoin and altcoin trends.
At CCN, Victor covers the top cryptocurrencies, memecoins, macro shifts, blending real-time insights with deep-dive metrics.
He holds a Bachelor’s degree in Physics from the University of Ibadan, equipping him to simplify complex data for a wide audience. Follow his work or connect on LinkedIn or X.