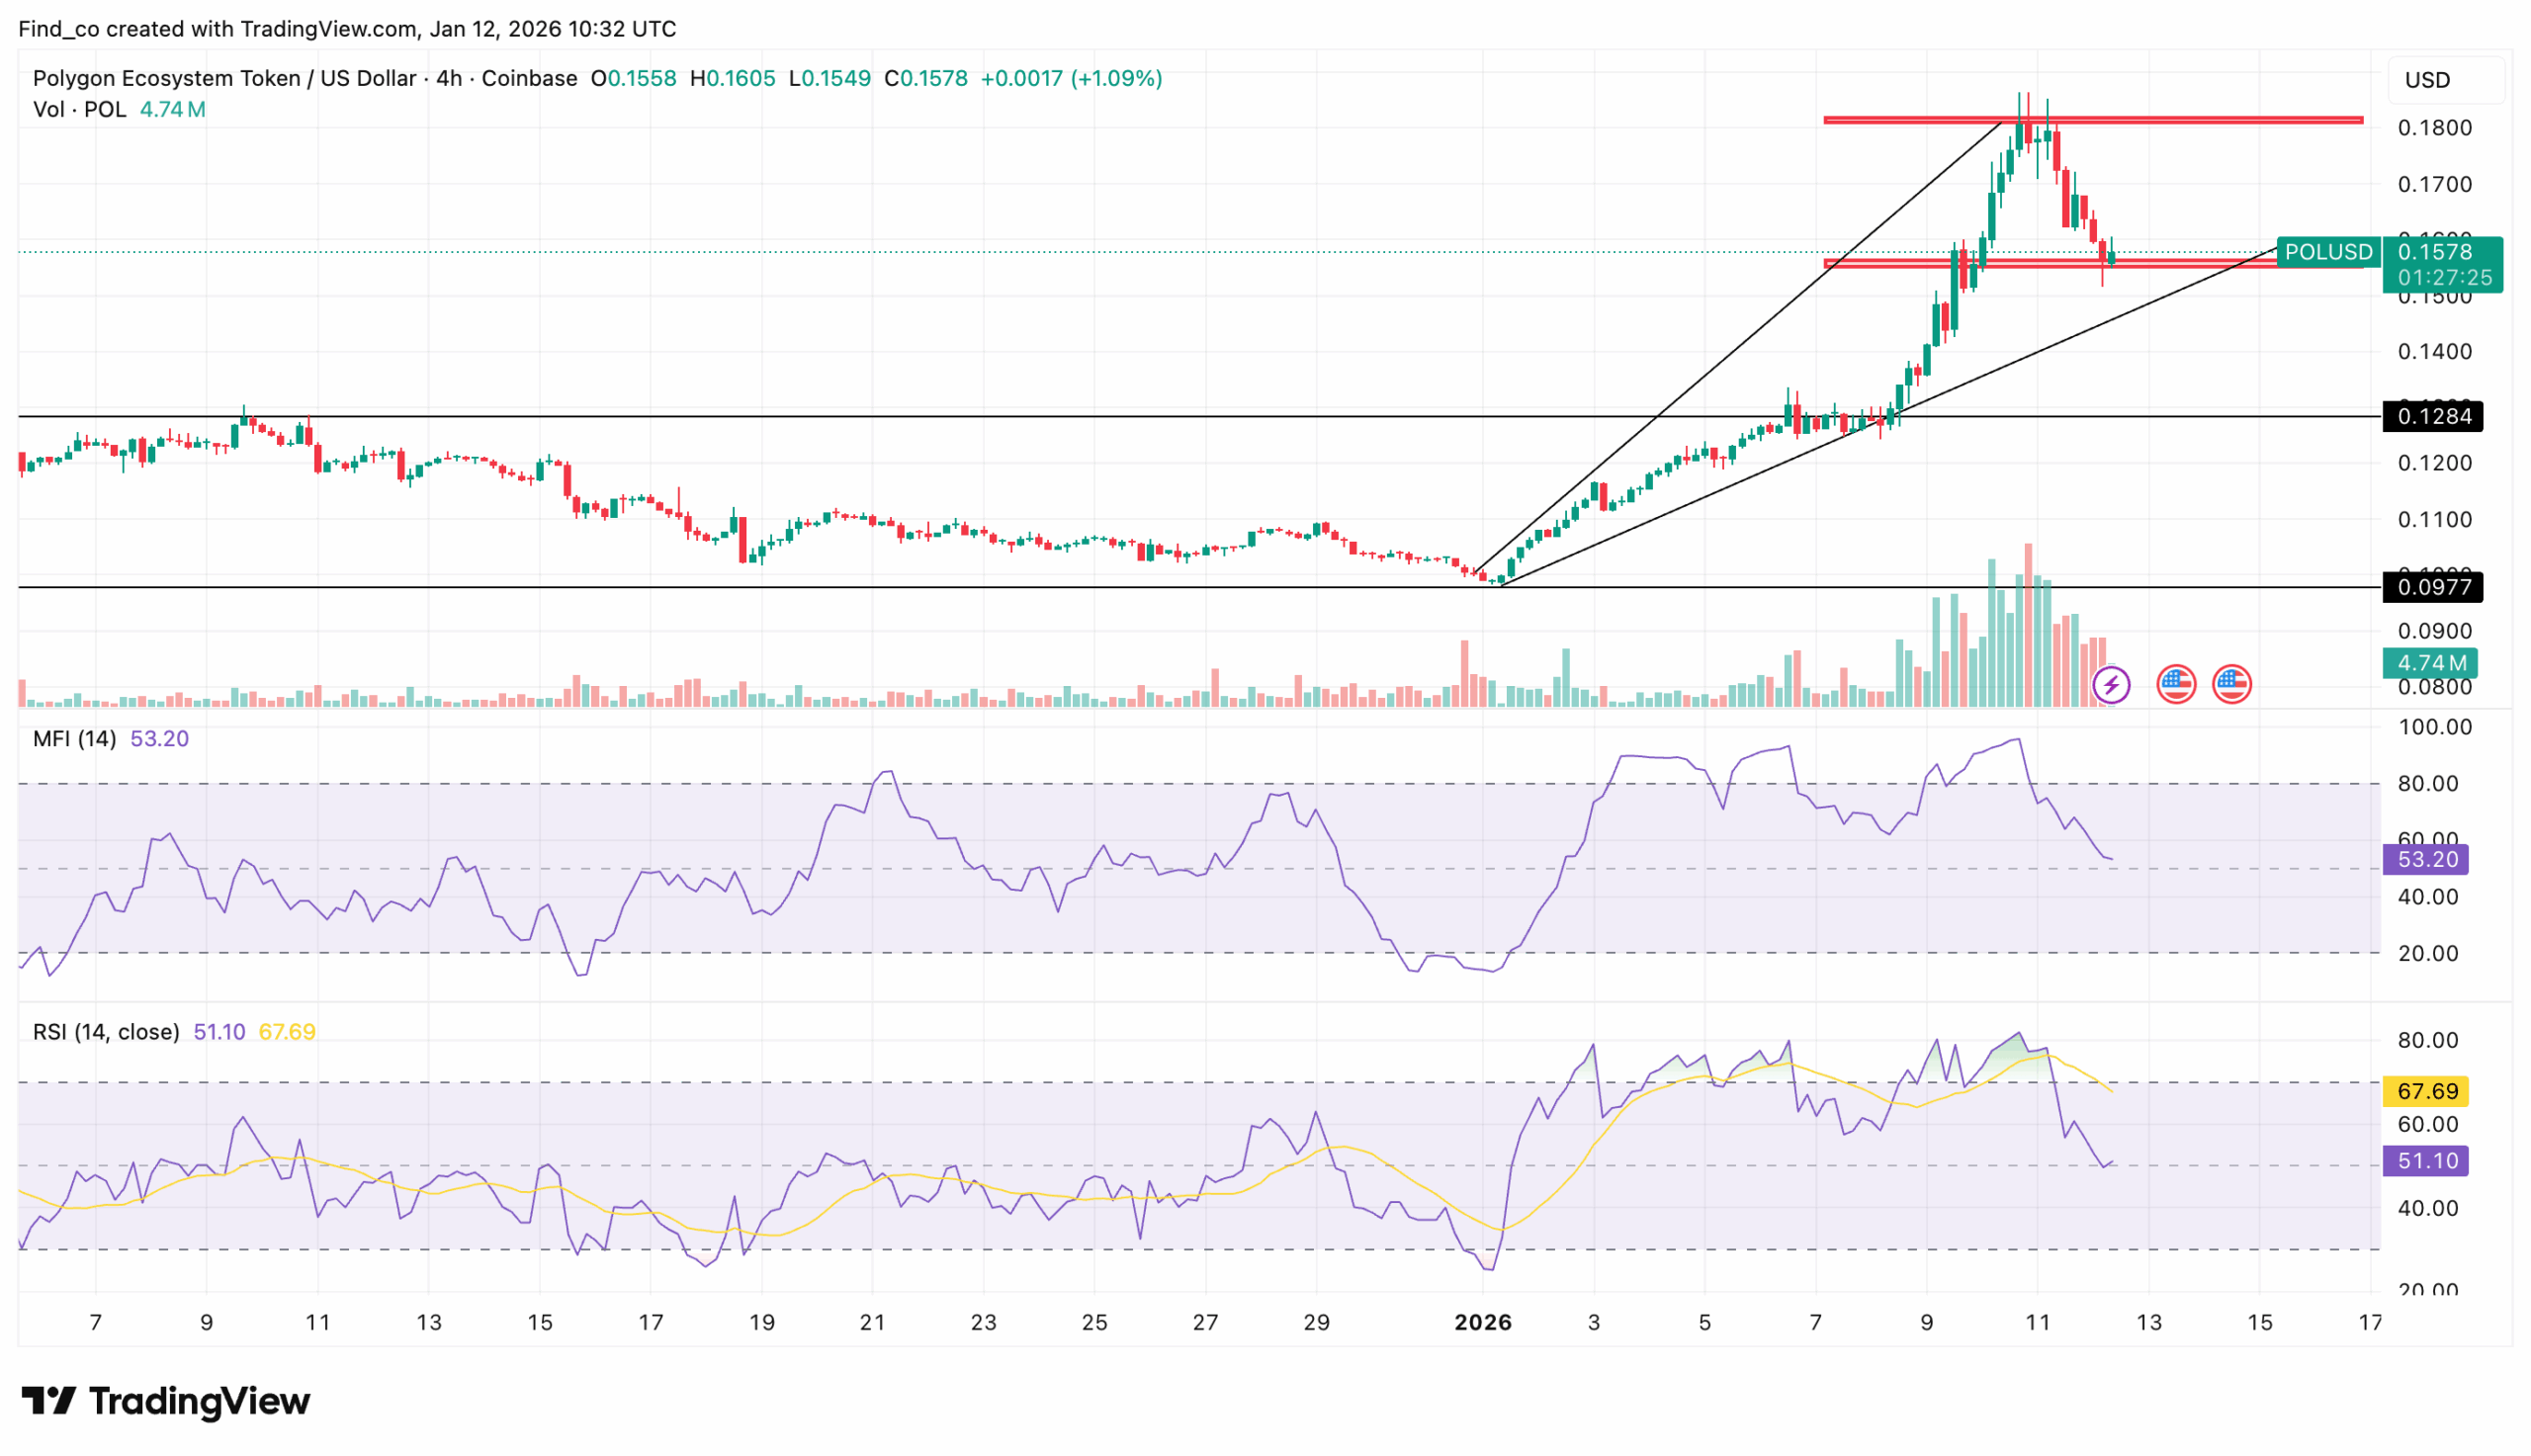
A rising wedge on the 4-hour chart has accelerated the POL drawdown | Credit: Hameem Sarwar
Share
Key Takeaways
POL’s weekend price surge faded fast after a notable rejection near $0.18.
Polygon’s Open Money Stack and a spike in active addresses triggered the rally.
Analysis reveals that the altcoin’s value risks falling to $0.10 amid mixed signals.
Polygon (POL) is back under pressure after dropping about 14% from its weekend highs.
The token rallied into a significant supply zone, but sellers rejected the move near $$0.18.
That rejection flipped short-term momentum bearish and pushed Polygon’s price into a key decision area.
Now, price is sliding toward support, and the next move depends on whether buyers defend demand or let bears extend the correction.
Why POL Rallied Initially
Over the weekend, the altcoin rallied, reaching a high of $0.18. However, it eventually experienced rejection near the local top of $0.18.
According to CCN’s findings, the initial rally happened due to the launch of Polygon’s Open Money Stack.
“The Open Money Stack will be an open and integrated stack of services and technologies to instantly and reliably move money anywhere, and put it to work,” Founder Sandeep Nailwal said about the development.
Get These Top Crypto Casino Offers Now!
Sponsored
Disclosure
We sometimes use affiliate links in our content, when clicking on those we might receive a commission at no extra cost to you. By using this website you agree to our terms and conditions and privacy policy.
Following the move, Polygon’s active addresses reached a three-month high, initially signaling stronger user participation and fresh demand.
However, that boost now appears to be fading. Network activity has cooled alongside the pullback, and POL’s price has dropped at the same time.
When price and activity decline together, it typically indicates a lack of conviction. As a result, POL may struggle to stage a quick rebound unless active addresses and volume start rising again.
Looking at the 4-hour chart, Polygon’s price broke down after facing rejection. Furthermore, the formation of a rising wedge accelerated the drawdown.
On the same chart, the Money Flow Index (MFI) reads 54.44 and trends lower toward neutral, signaling a fading of inflows after the pullback.
MFI remains above the 50 midpoint, but the slope indicates weakening buyer control as profit-taking intensifies.
The RSI tells the same story. After hitting overbought during the weekend surge, RSI has dropped to 46.39 and slipped below 50. That shift confirms bulls have lost momentum, while sellers are gaining the upper hand.
Price action also turned. Polygon’s price broke down from its rising channel and now trades between $0.15 and $0.16. This area is significant because it previously served as a base before the breakout.
If buyers hold it, POL could stabilize and attempt another move toward $0.18. However, if POL’s price falls by $0.15, the pullback is likely to deepen into the next demand zone near $0.13.
If that level fails too, the recent bullish structure breaks down, opening the door to a broader retracement toward $0.10.
POL Price Prediction: Downside Risk Grows
On the daily chart, Polygon’s price has printed an apparent bearish reversal. The breakout failed, resistance held, and consecutive red candles show sustained selling pressure.
The Chaikin Money Flow (CMF) remains positive at 0.10, but it is dropping quickly toward neutral. If CMF flips below zero, it would confirm distribution and strengthen the bearish case.
MACD still sits in positive territory, but the histogram bars are fading. That signals weakening upside momentum, not a fresh uptrend. Buyers have not disappeared, but their purchasing power is waning.
That keeps POL vulnerable if selling pressure persists and support fails.
Fibonacci levels offer more insights into the next move. As shown below, POL’s price is drifting toward the 0.236 Fibonacci level near $0.15.
If the price breaks that level, the following downside target shifts toward $0.12.
On the upside, bulls need to reclaim and hold $0.19 to regain momentum. If they do, the next objective becomes a push above $0.20.
AggLayer v0.4 Could Be the Next Catalyst
Meanwhile, analyst VentureFounder argues the move above $0.18 did not confirm strength. He frames it as another distribution event unless POL can turn $0.18 into support.
If it fails, he points to $0.10 as the next primary target. On the bullish side, he says POL must first make $0.22 support, then aim for higher zones like $0.30 and $0.38.
“$POL chart is easy to analyze, no $0.38, no cookie. This rally to $0.18 has been just another distribution event (so far), rejected at exactly the point where one might expect. Not being able to make $0.18 support means the next target is $0.10. The first real goal on the bullish side is making $0.22 support, then $0.30 and $0.38,” The analyst pointed out.
He also ties any real trend reversal to fundamentals. In his view, progress on AggLayer v0.4 could provide the catalyst POL needs to break its longer bearish cycle.
“Far too early to celebrate. Need to release Agglayer v0.4 for this bearish trend to reverse, imo,” He added.
Disclaimer:
The information provided in this article is for informational purposes only. It is not intended to be, nor should it be construed as, financial advice. We do not make any warranties regarding the completeness, reliability, or accuracy of this information. All investments involve risk, and past performance does not guarantee future results. We recommend consulting a financial advisor before making any investment decisions.
Victor Olanrewaju is a crypto analyst and reporter at CCN with deep roots in on-chain research and technical analysis. His crypto journey began in 2017, but it was the 2020 Uniswap airdrop that sparked a full-time pivot into the space.
With a foundation in copywriting, Victor honed his craft creating high-converting content for leading crypto brokers — most notably an XRP price prediction that ranked #1 on Google during the 2021 bull run.
He later joined AMBCrypto in 2022, where he combined storytelling with technical and on-chain analysis to cover key market narratives.
In 2024, he expanded his expertise at BeInCrypto, collaborating with analysts and using tools like Glassnode, Santiment, and IntoTheBlock to break down Bitcoin and altcoin trends.
At CCN, Victor covers the top cryptocurrencies, memecoins, macro shifts, blending real-time insights with deep-dive metrics.
He holds a Bachelor’s degree in Physics from the University of Ibadan, equipping him to simplify complex data for a wide audience. Follow his work or connect on LinkedIn or X.