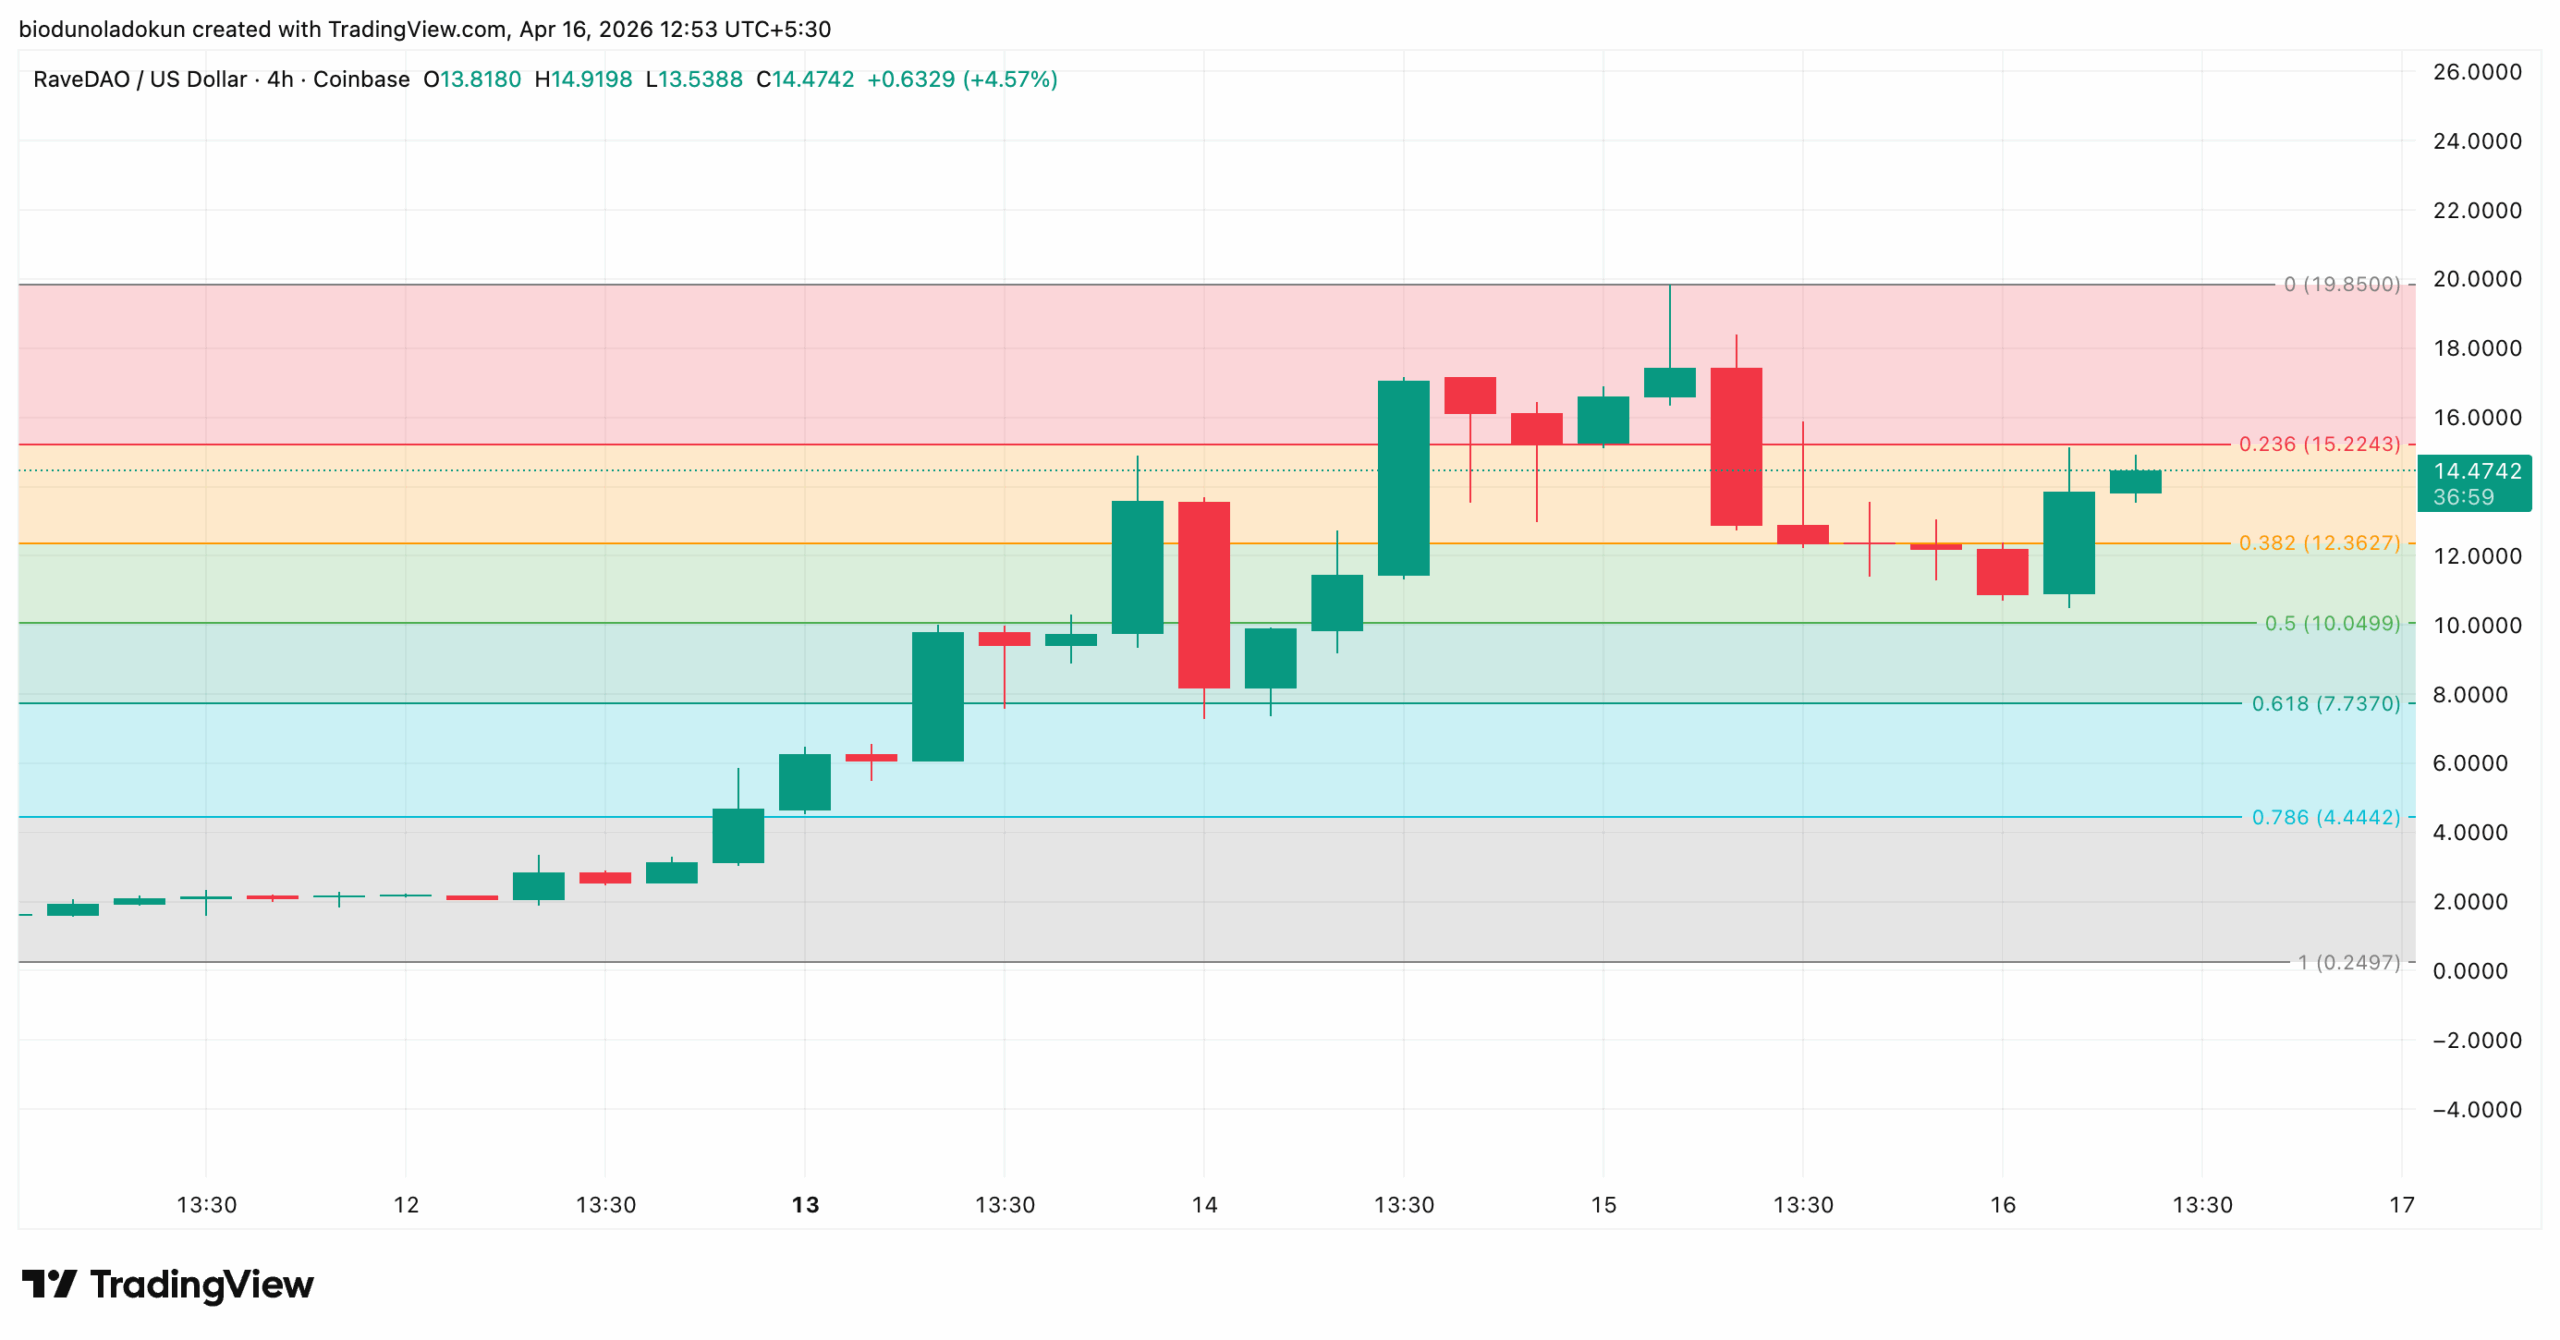
RaveDAO (RAVE) is down 30% from its $19.85 all-time high. | Credit: CCN.
Share
Key Takeaways
RAVE has shed 30% since hitting an all-time high of $19.85 on Wednesday. It now eyes $10 as the next key downside target.
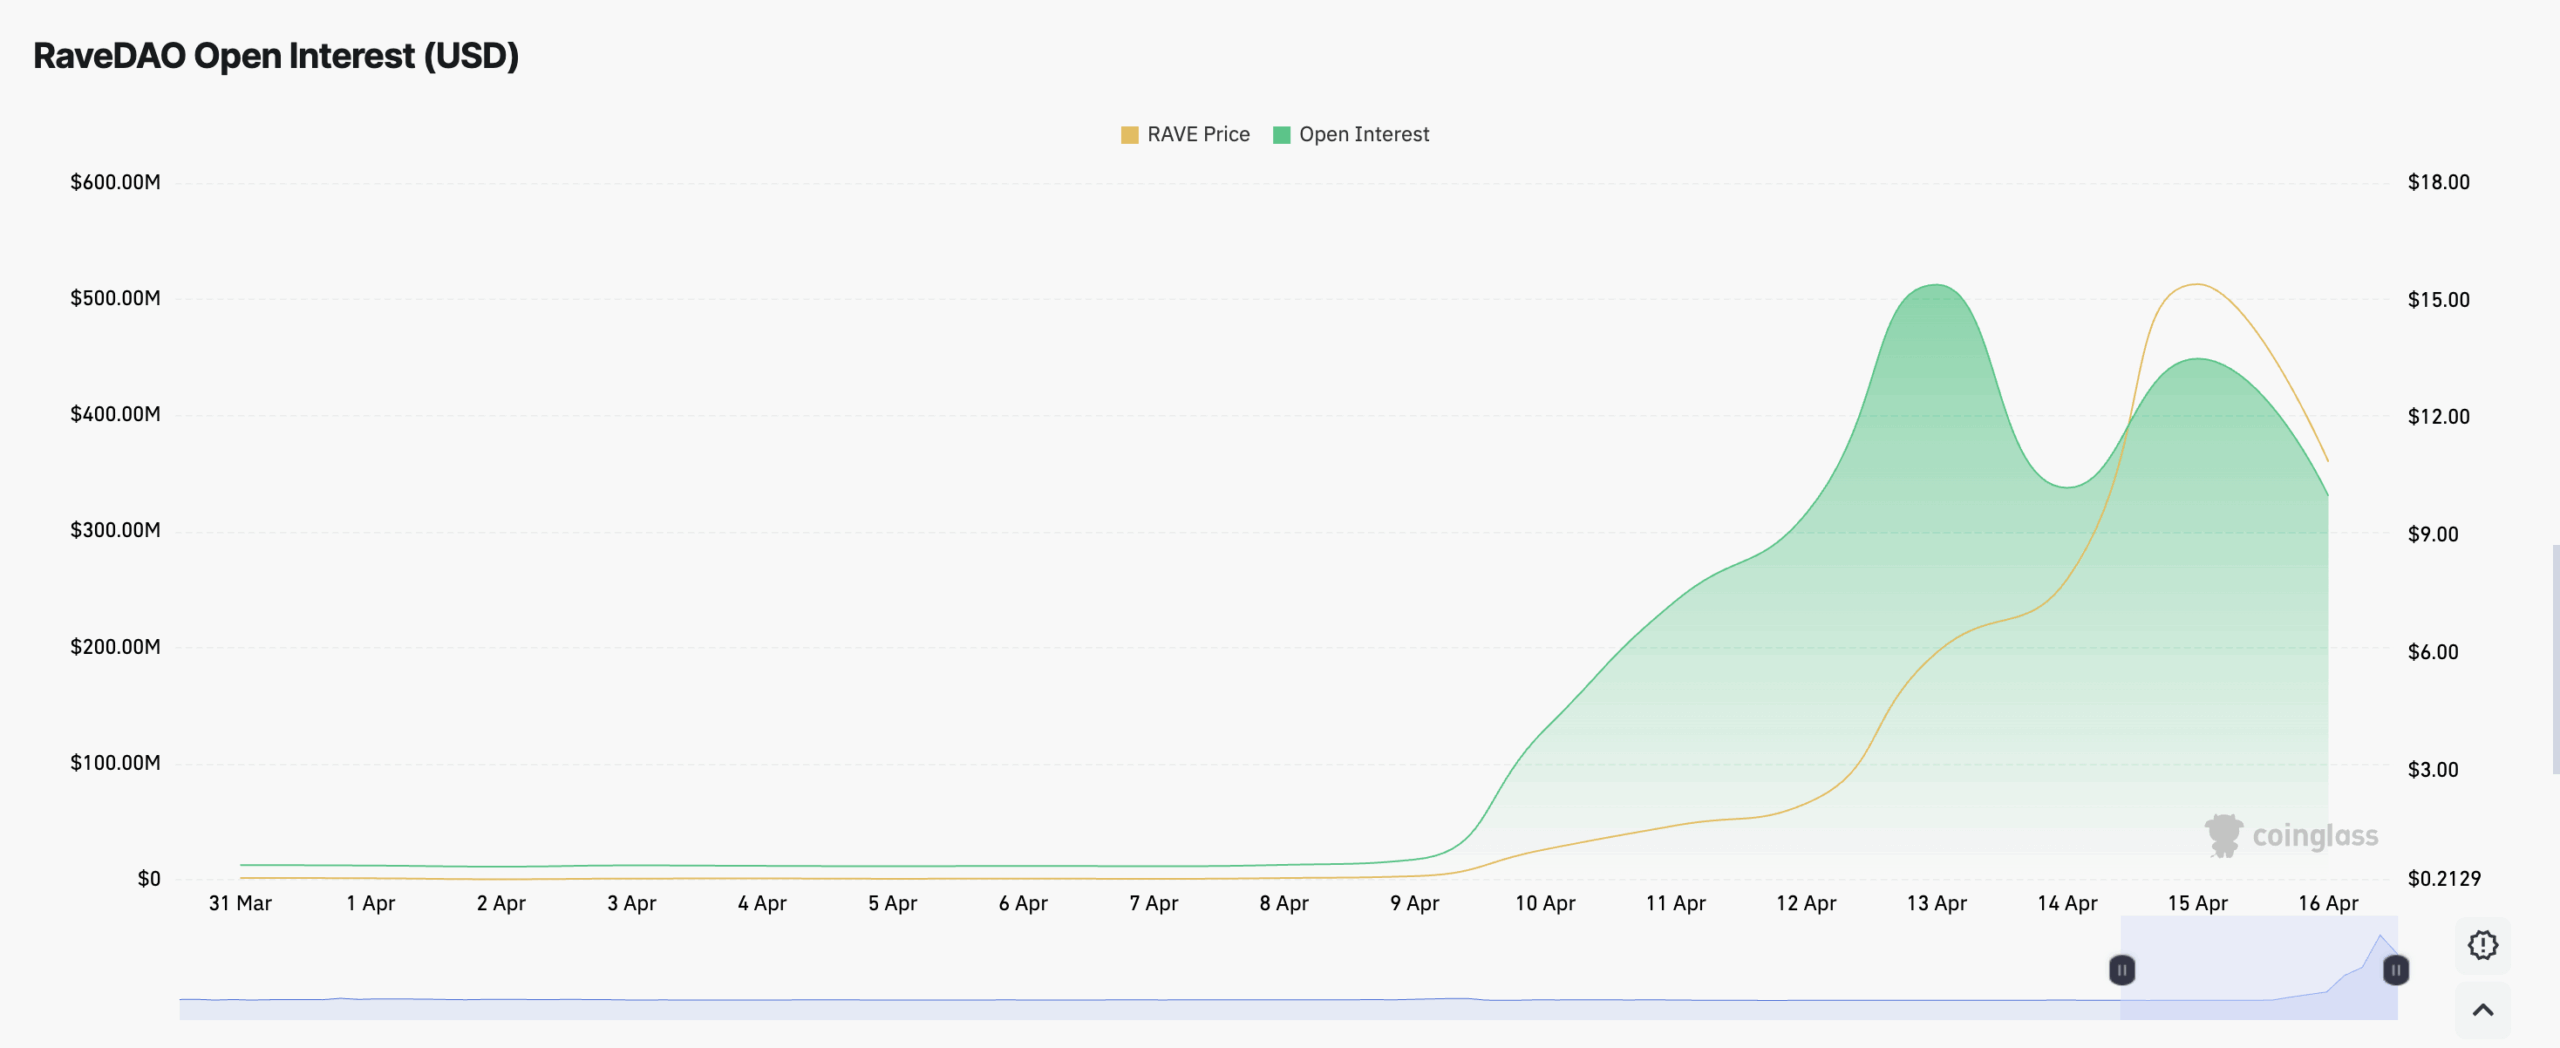
Open interest has collapsed by 35% from its April 13 peak, while the funding rate sits at -0.0650%, confirming bearish dominance in derivatives markets.
A bearish MACD crossover and consecutive Awesome Oscillator red bars on the four-hour chart reinforce the case for further downside.
RaveDAO (RAVE) has shed a significant portion of its value since hitting an all-time high of $19.85 yesterday. At press time, the altcoin was trading at $14.47, down 30% from its peak.
With profit-taking now front of mind for most holders, if selling pressure persists, RAVE could be eyeing a near-term drop toward $10.
Sponsored
Disclosure
We sometimes use affiliate links in our content, when clicking on those we might receive a commission at no extra cost to you. By using this website you agree to our terms and conditions and privacy policy.
On the four-hour chart, readings from RAVE’s key momentum indicators support this bearish stance.
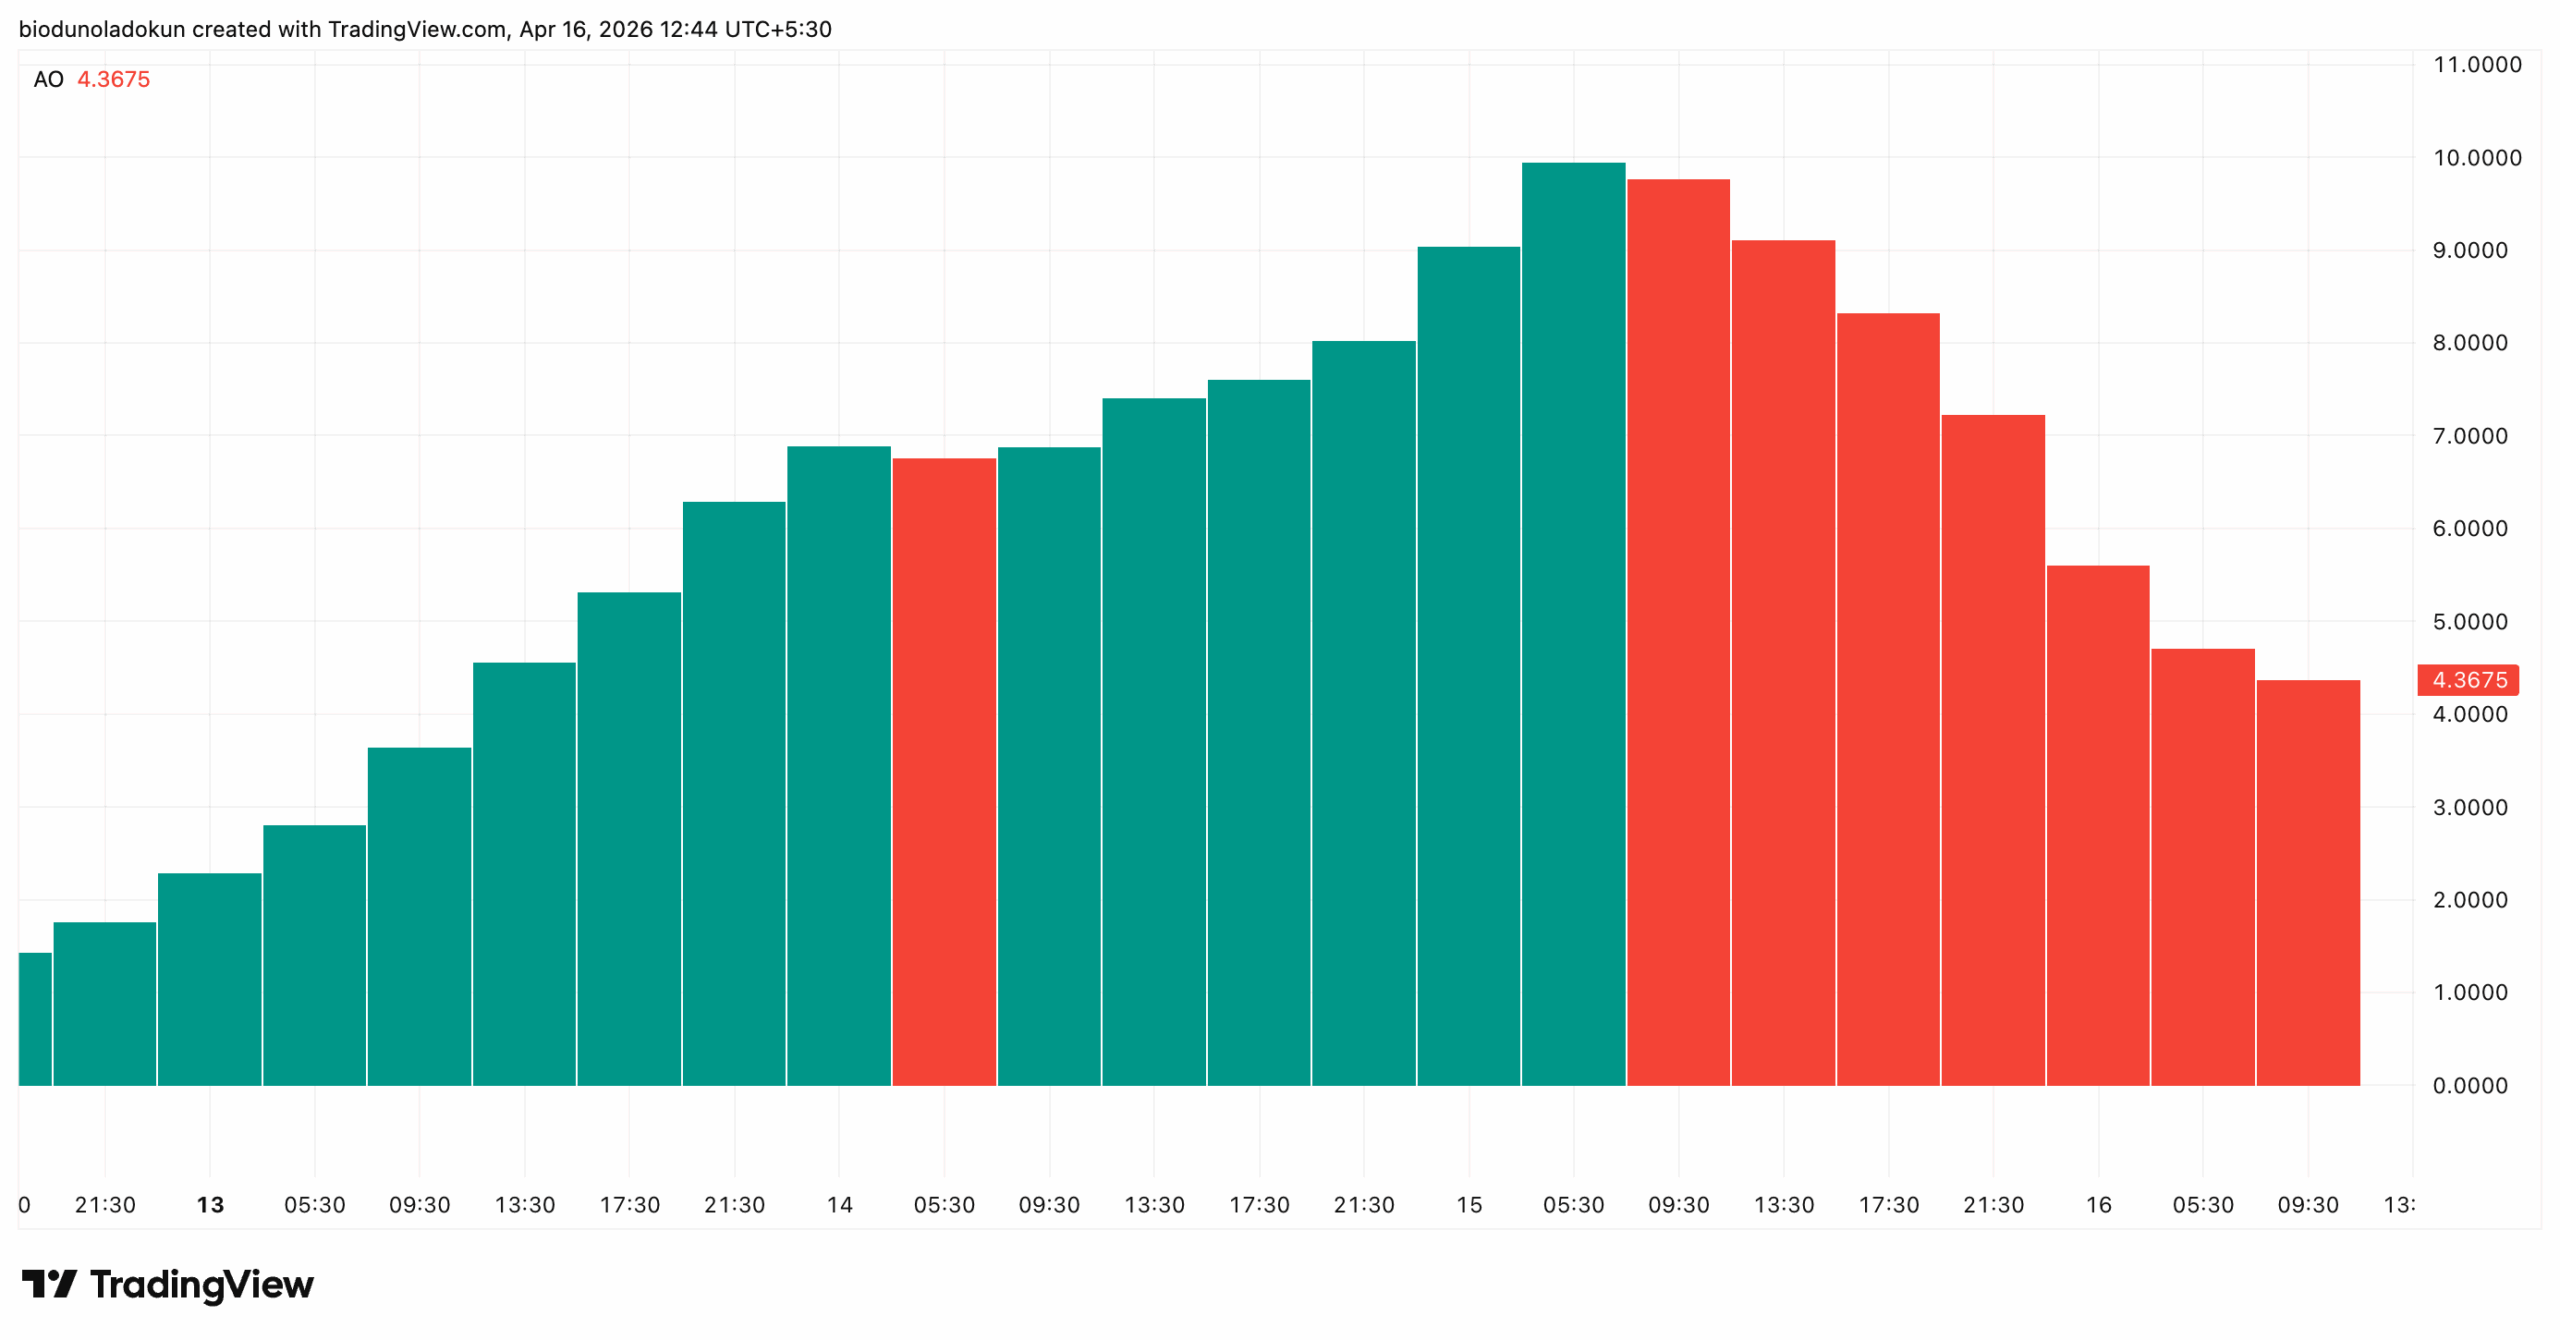
Its Awesome Oscillator peaked around the $19.85 all-time high on Wednesday and has been printing consecutive red bars since, each successive bar lower than the last.
The Awesome Oscillator compares an asset’s current market momentum with its longer-term momentum, helping identify potential trend shifts.
When it shows green histogram bars and positive values, it indicates strong momentum and increasing bullish sentiment.
On the other hand, when the AO prints red bars and declining values, it signals that short-term momentum is weakening, reflecting fading buying interest and growing bearish pressure.
At press time, the indicator sits at 4.367, trending sharply downward. This is a classic signal that bullish momentum is exhausting and RAVE bears are increasingly in control.
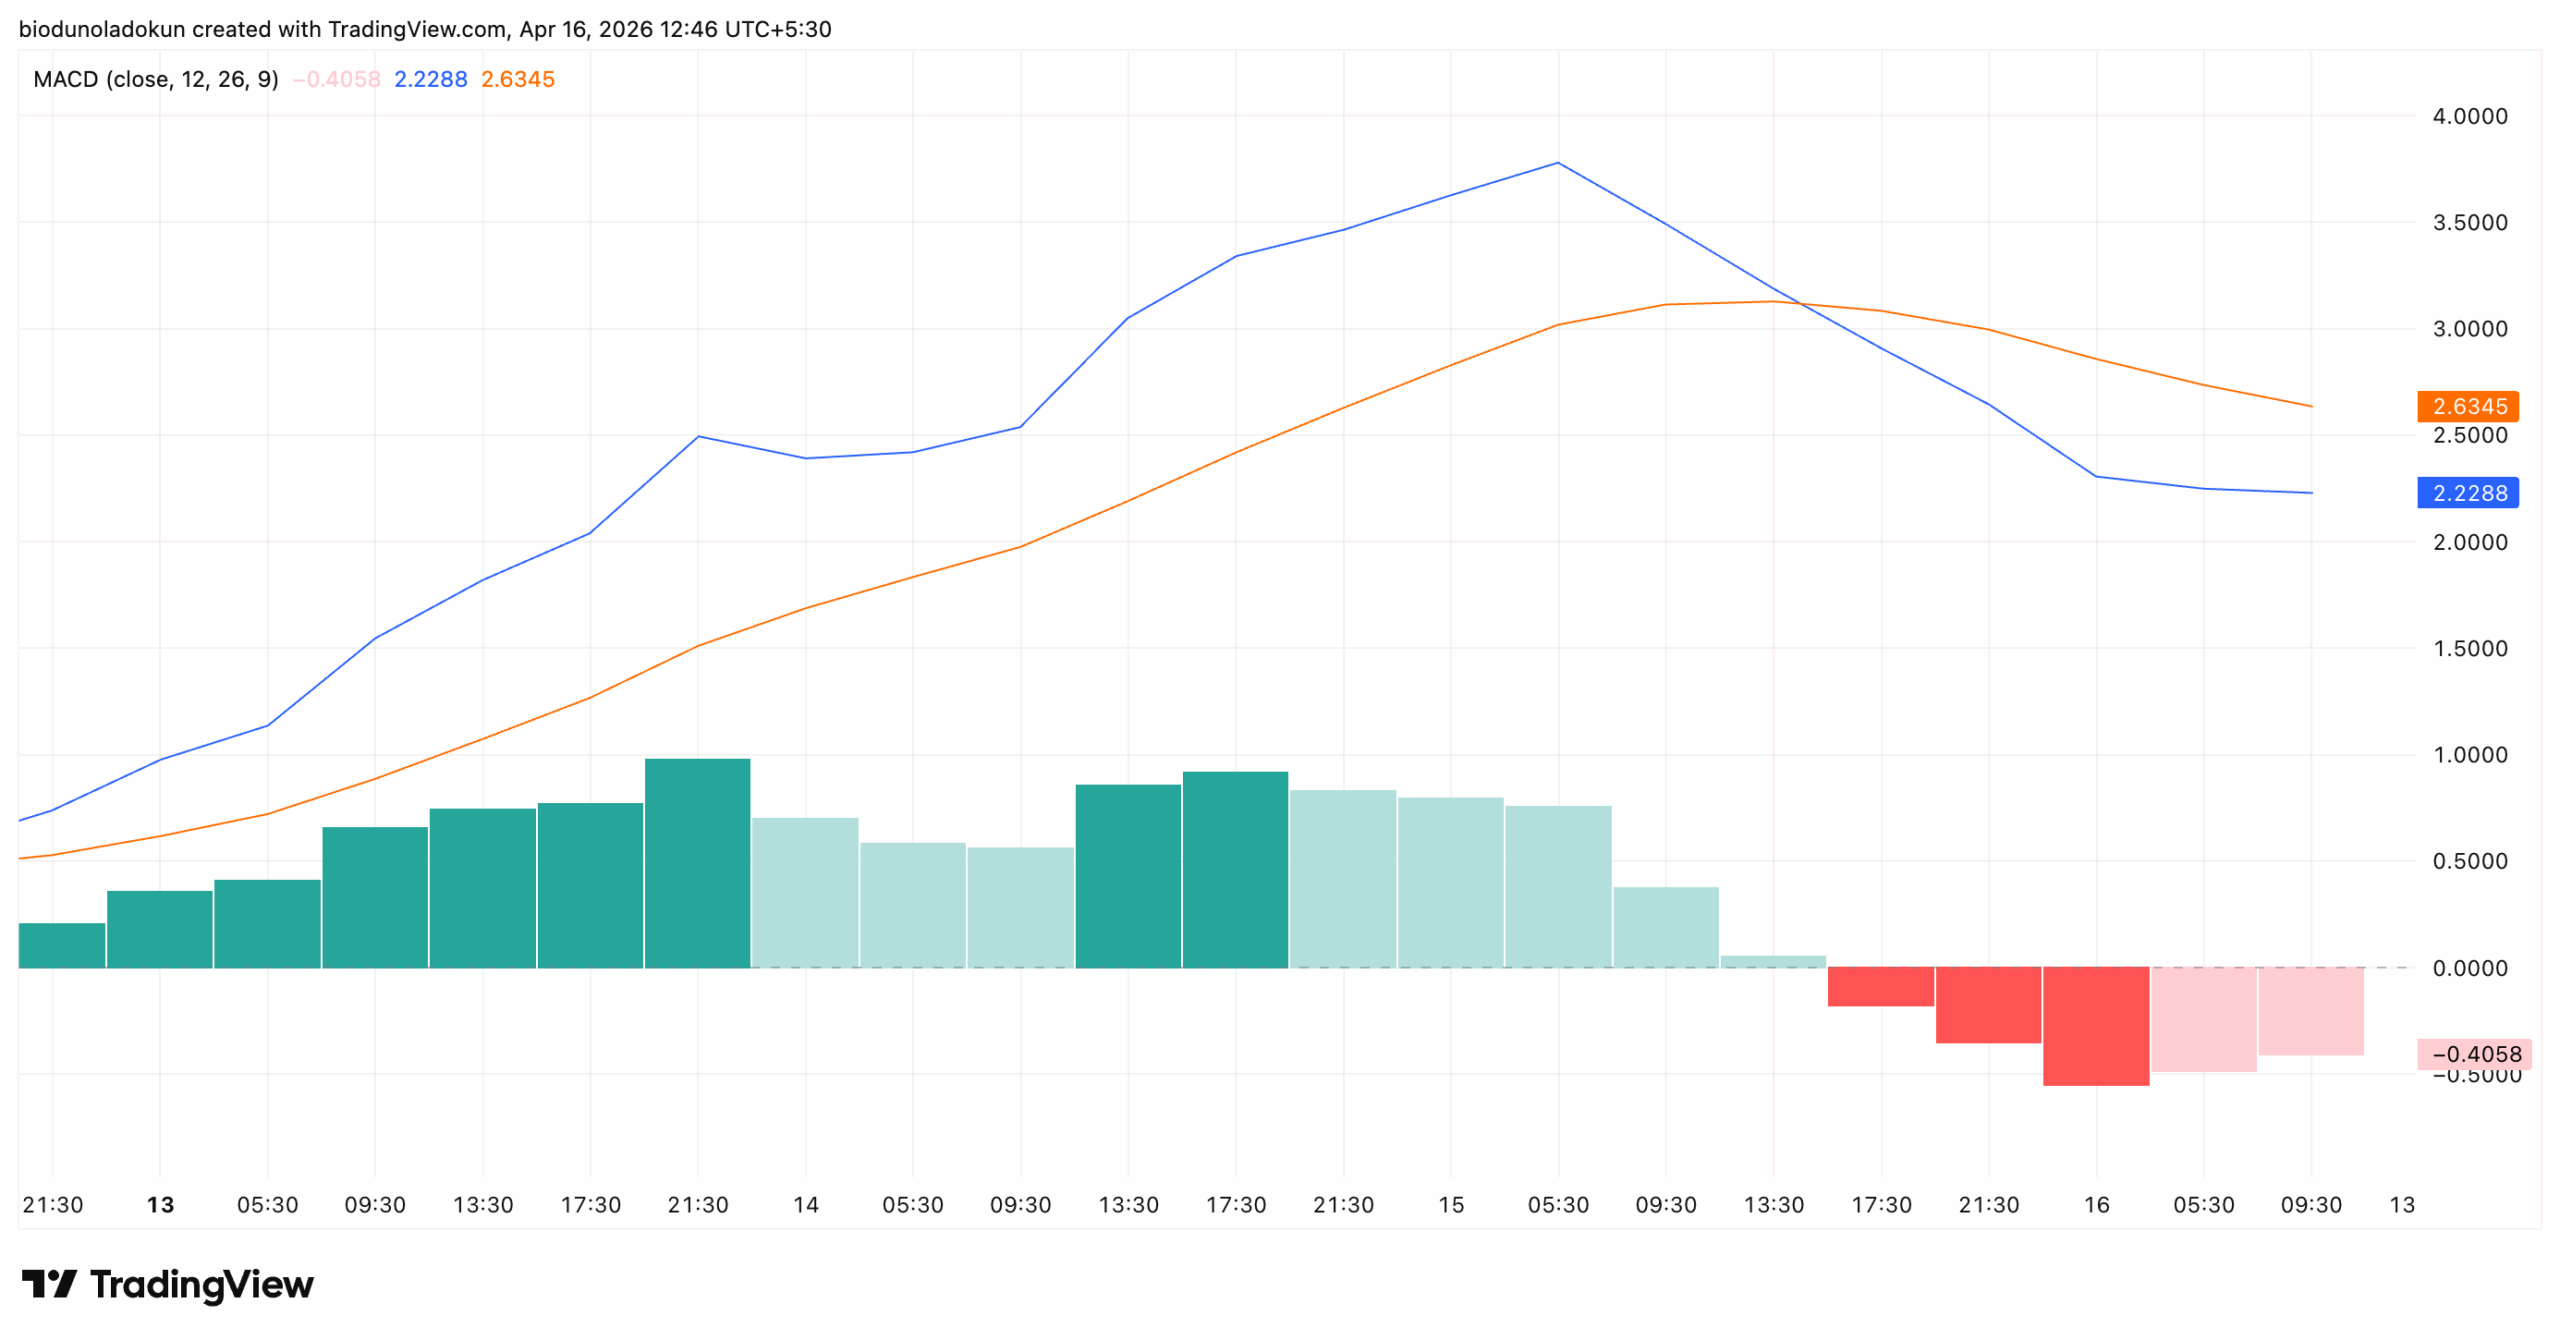
Furthermore, the setup of RAVE’s Moving Average Convergence Divergence (MACD) indicator confirms the hike in sell-side pressure among spot market participants.
Following the altcoin’s surge to an all-time high, the MACD line (blue) crossed below the signal line (orange), a bearish signal pointing to potential downside pressure ahead.
Open interest measures the total number of outstanding futures contracts that have not yet been settled. It is a proxy for conviction in a given market direction.
When it declines alongside price, as seen here, it signals that leveraged long positions are being closed or liquidated, a sign that bullish bets are being unwound.
In RAVE’s case, it means the enthusiasm that fuelled the rally to the $19.85 ATH is now actively exiting.
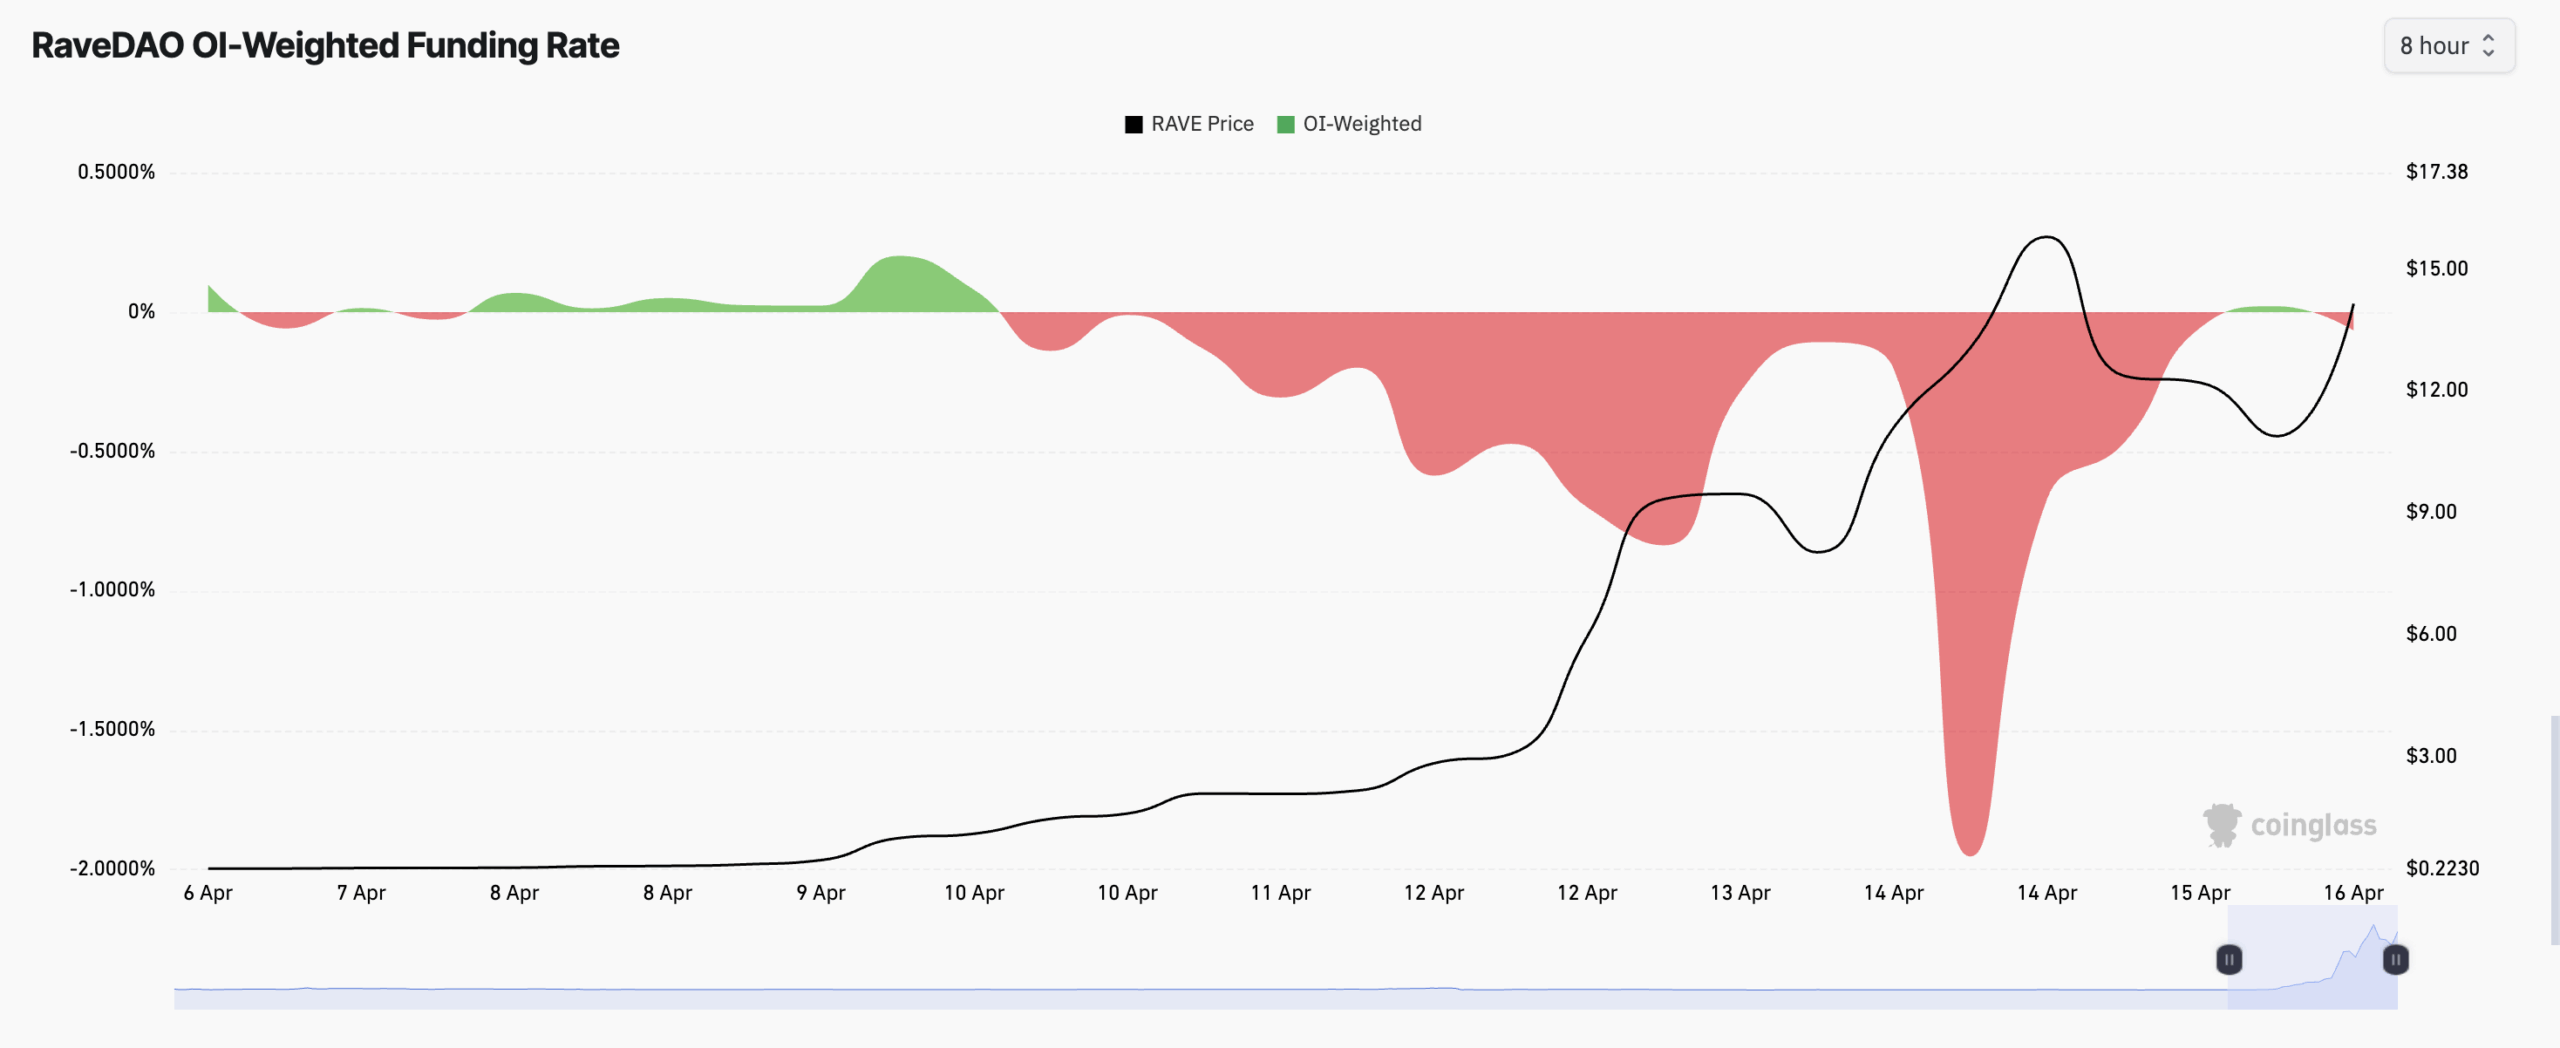
Moreover, RAVE’s funding rate has turned significantly negative, a sign that short sellers are gaining the upper hand in derivatives markets. At press time, this sits at -0.0650%.
Funding rate refers to the periodic payment exchanged between long and short position holders in perpetual futures markets.
A positive funding rate means longs pay shorts, indicating bullish dominance.
A negative funding rate, as is currently the case with RAVE, means shorts pay longs, reflecting that bearish positions are crowding the market.
According to Coinglass data, the sustained stretch of negative funding since April 10 confirms that derivatives traders have been positioned against RAVE’s price for nearly a week, even as spot prices pushed to new highs. This divergence has now resolved to the downside.
$10 in Sight?
At press time, RAVE was trading at $14.47, hovering above a key support floor now formed at $12.36.
With rising profit-taking, RAVE could fall to test this level. A failed retest and a daily close below the $12.36 floor could trigger a further dip toward $10.04.
Disclaimer:
The information provided in this article is for informational purposes only. It is not intended to be, nor should it be construed as, financial advice. We do not make any warranties regarding the completeness, reliability, or accuracy of this information. All investments involve risk, and past performance does not guarantee future results. We recommend consulting a financial advisor before making any investment decisions.
Abiodun Oladokun is a Research Analyst at CCN, where he covers cryptocurrency markets with a focus on on-chain analysis, technical assessments, and emerging trends across decentralized finance (DeFi), real-world assets (RWA), artificial intelligence (AI), decentralized physical infrastructure networks (DePIN), Layer 2s, and meme coins.
Prior to CCN, he served as a Senior On-Chain Analyst at BeInCrypto, producing market reports spanning diverse crypto sectors.
Before that, he conducted technical analysis and market assessments of various altcoins at AMBCrypto, where he also contributed long-form quarterly research papers on DeFi, NFTs, DAOs, and scaling architectures, leveraging on-chain platforms including Messari, Santiment, DefiLlama, and Dune Analytics.
He began his crypto career as a research analyst at SixthSense DAO, developing blockchain forensic tools to trace the history of stolen assets.
Abiodun is a lawyer called to the Nigerian Bar and the founder of Ilé Ijó, a Lagos-based electronic dance music collective.