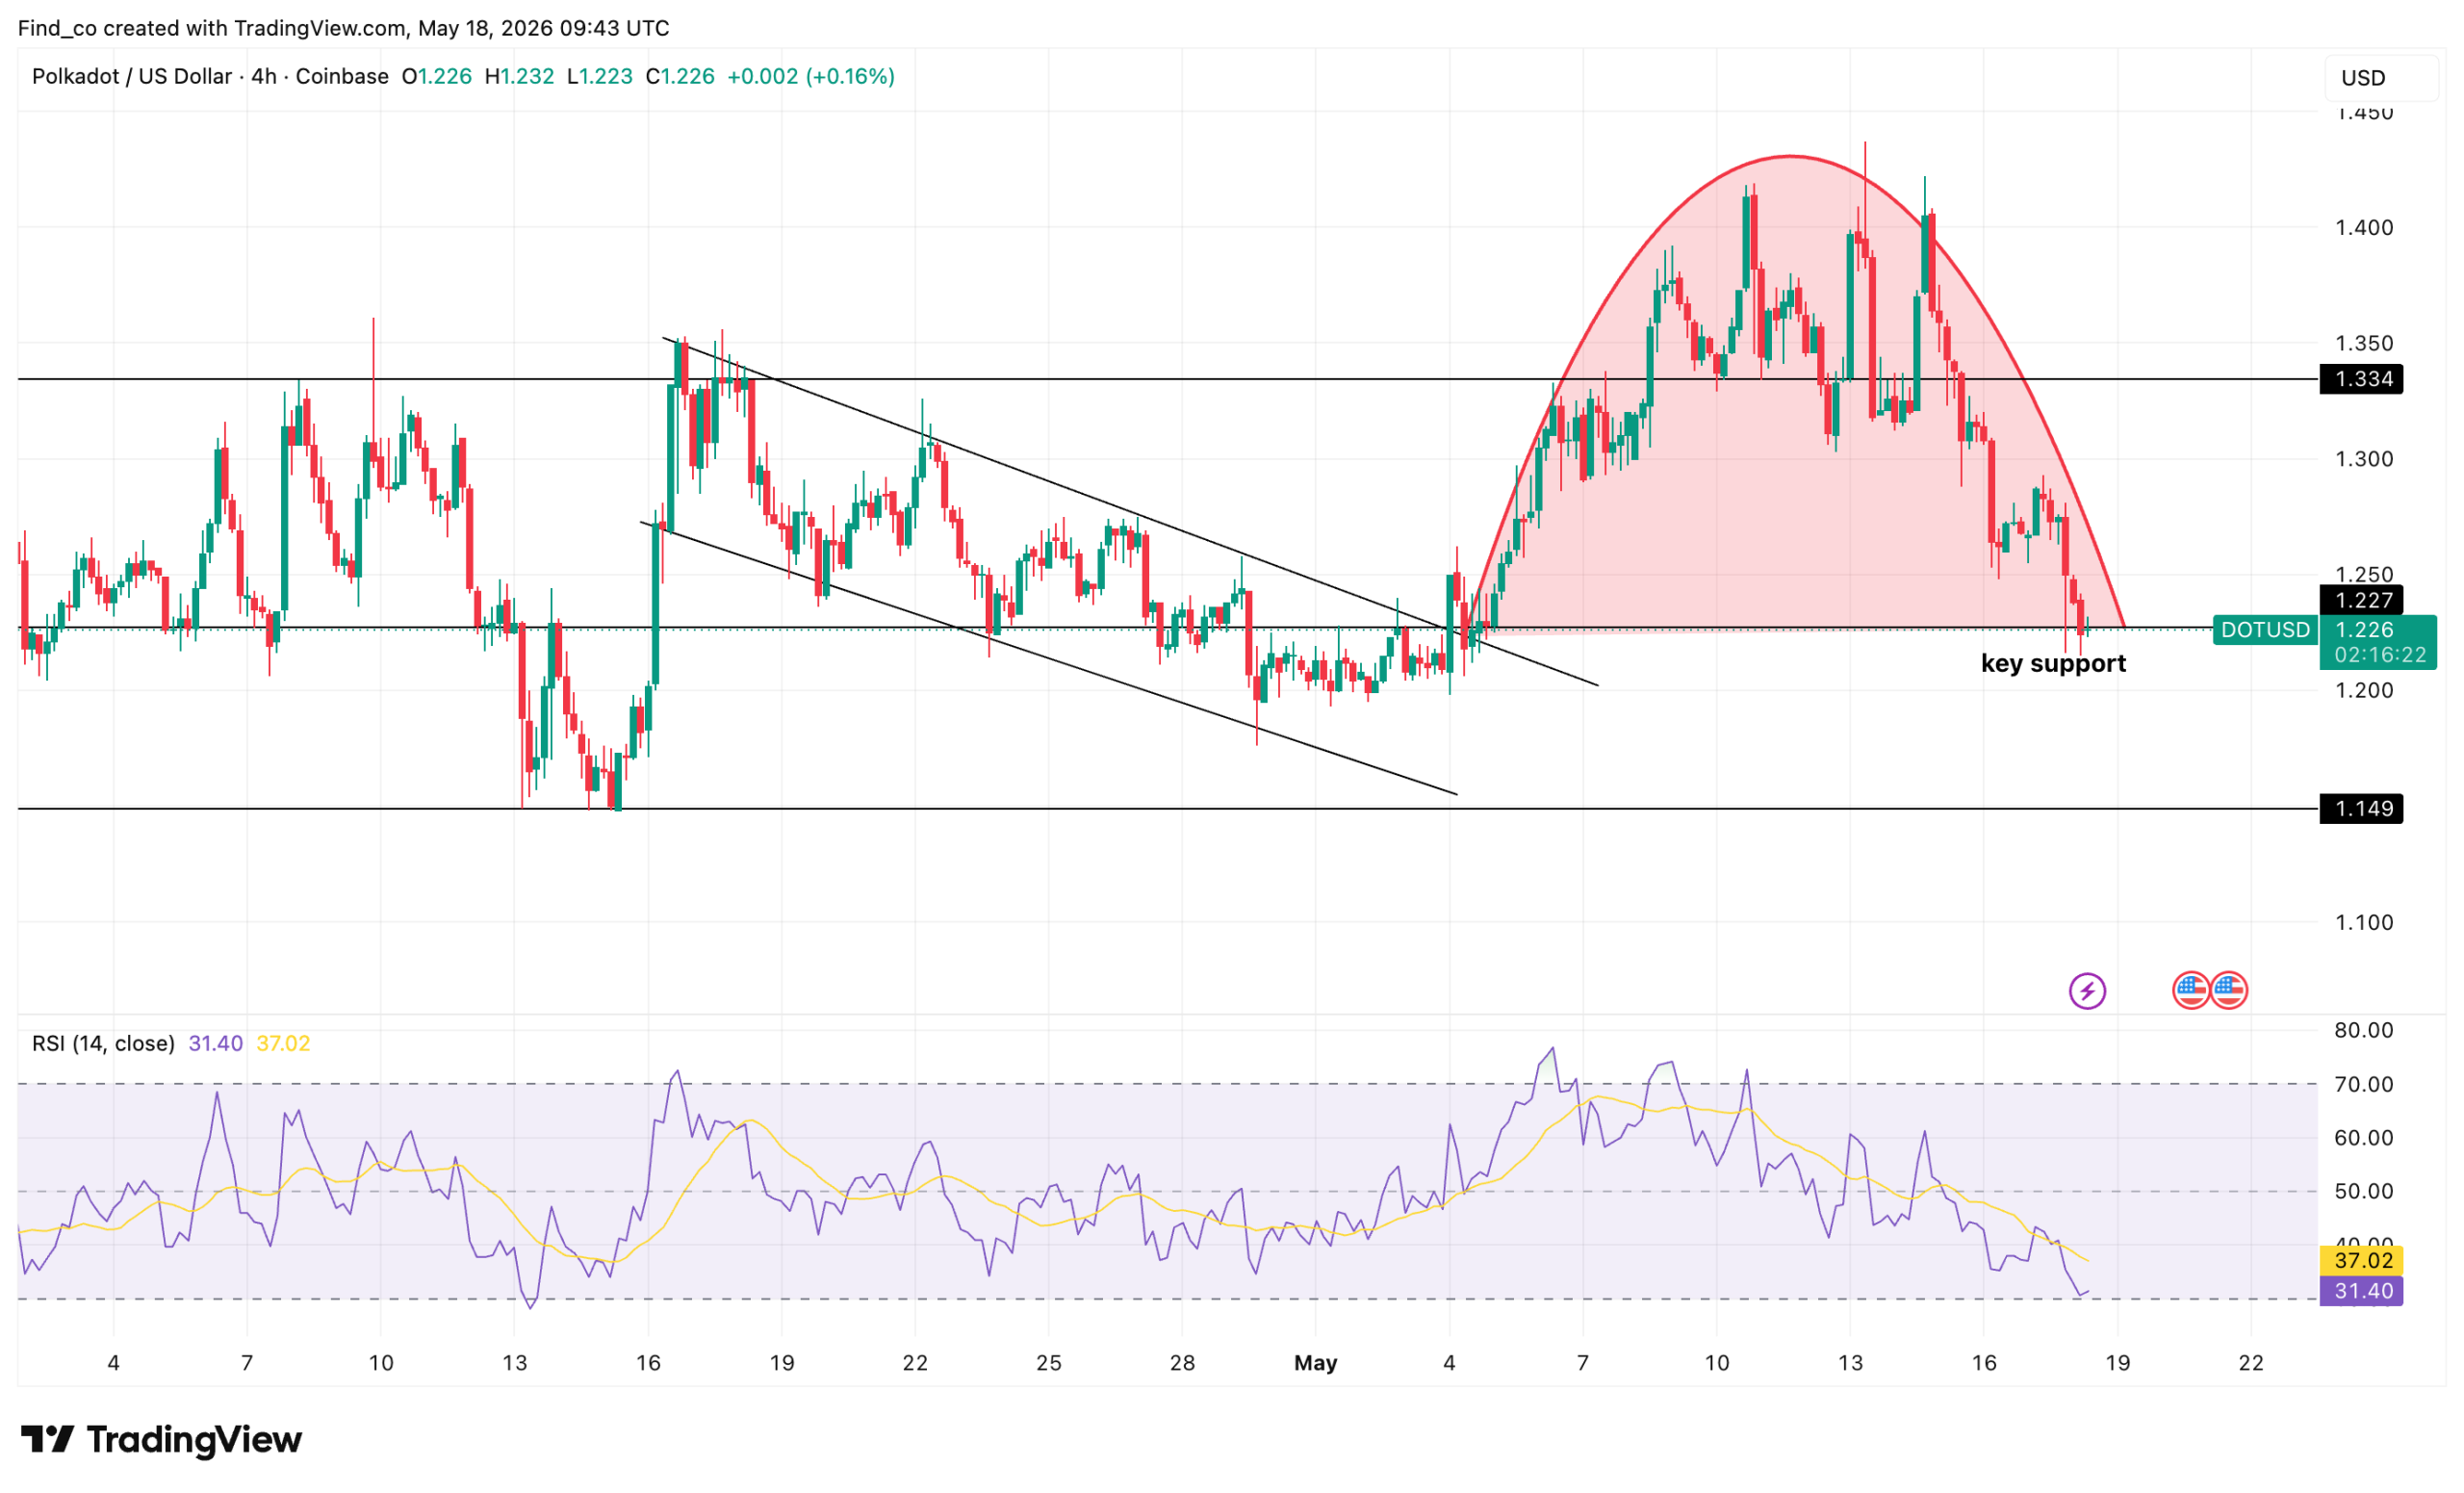
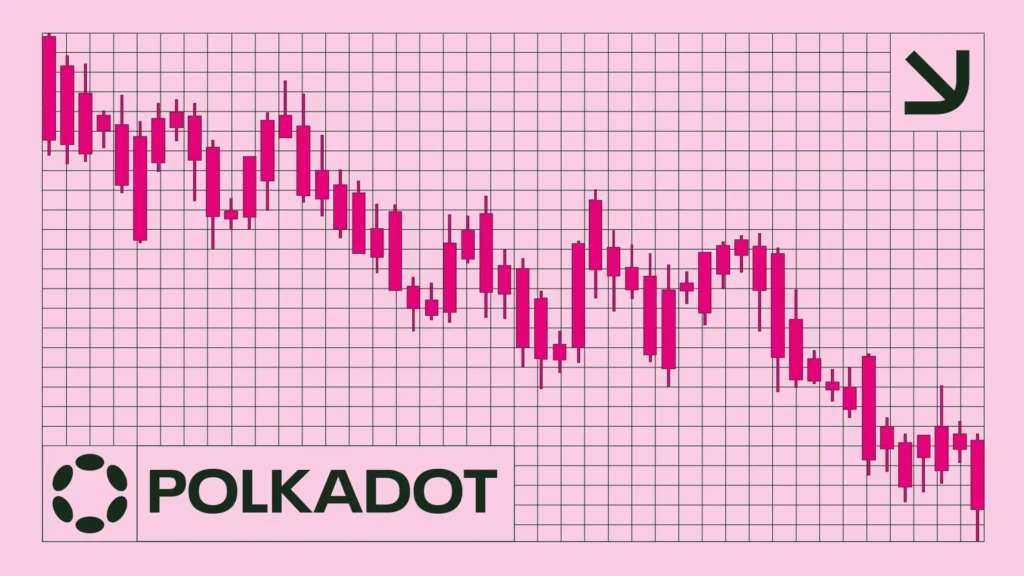
Polkadot has fallen 10% this week and is now testing key support near the $1.20 zone.
Weak demand for the 21Shares Polkadot ETF and are adding pressure to the altcoin.
A move above $1.33 could trigger a recovery rally, while a breakdown may lead to further losses.
Polkadot (DOT) is facing renewed downward pressure after a 10% decline over the past seven days.
As a result, the cryptocurrency has declined toward a potentially critical region. Amid that, weakening spot ETF inflows have added to concerns about fading market demand.
Here is how all of these could affect Polkadot’s price.
Notably, the price has already broken down from a previous descending channel. As a result, it failed to hold above the $1.33 resistance area, shifting short-term momentum back in favor of sellers.
Get These Top Crypto Casino Offers Now!
Sponsored
Disclosure
We sometimes use affiliate links in our content, when clicking on those we might receive a commission at no extra cost to you. By using this website you agree to our terms and conditions and privacy policy.
Further, the Relative Strength Index (RSI) has dropped to near-oversold territory around 31, suggesting Polkadot’s price could attempt a relief bounce from current levels.
However, bulls need to reclaim the $1.33 resistance to invalidate the current bearish structure. If that happens, the price could revisit the recent highs near $1.40.
For now, the main focus is on the horizontal support around $1.20.
A breakdown below that level would likely trigger another leg lower toward the $1.15 region or even lower, while holding it could allow DOT to stabilize and consolidate after the recent selloff.
The ETF Has Become a ‘Ghost Town’
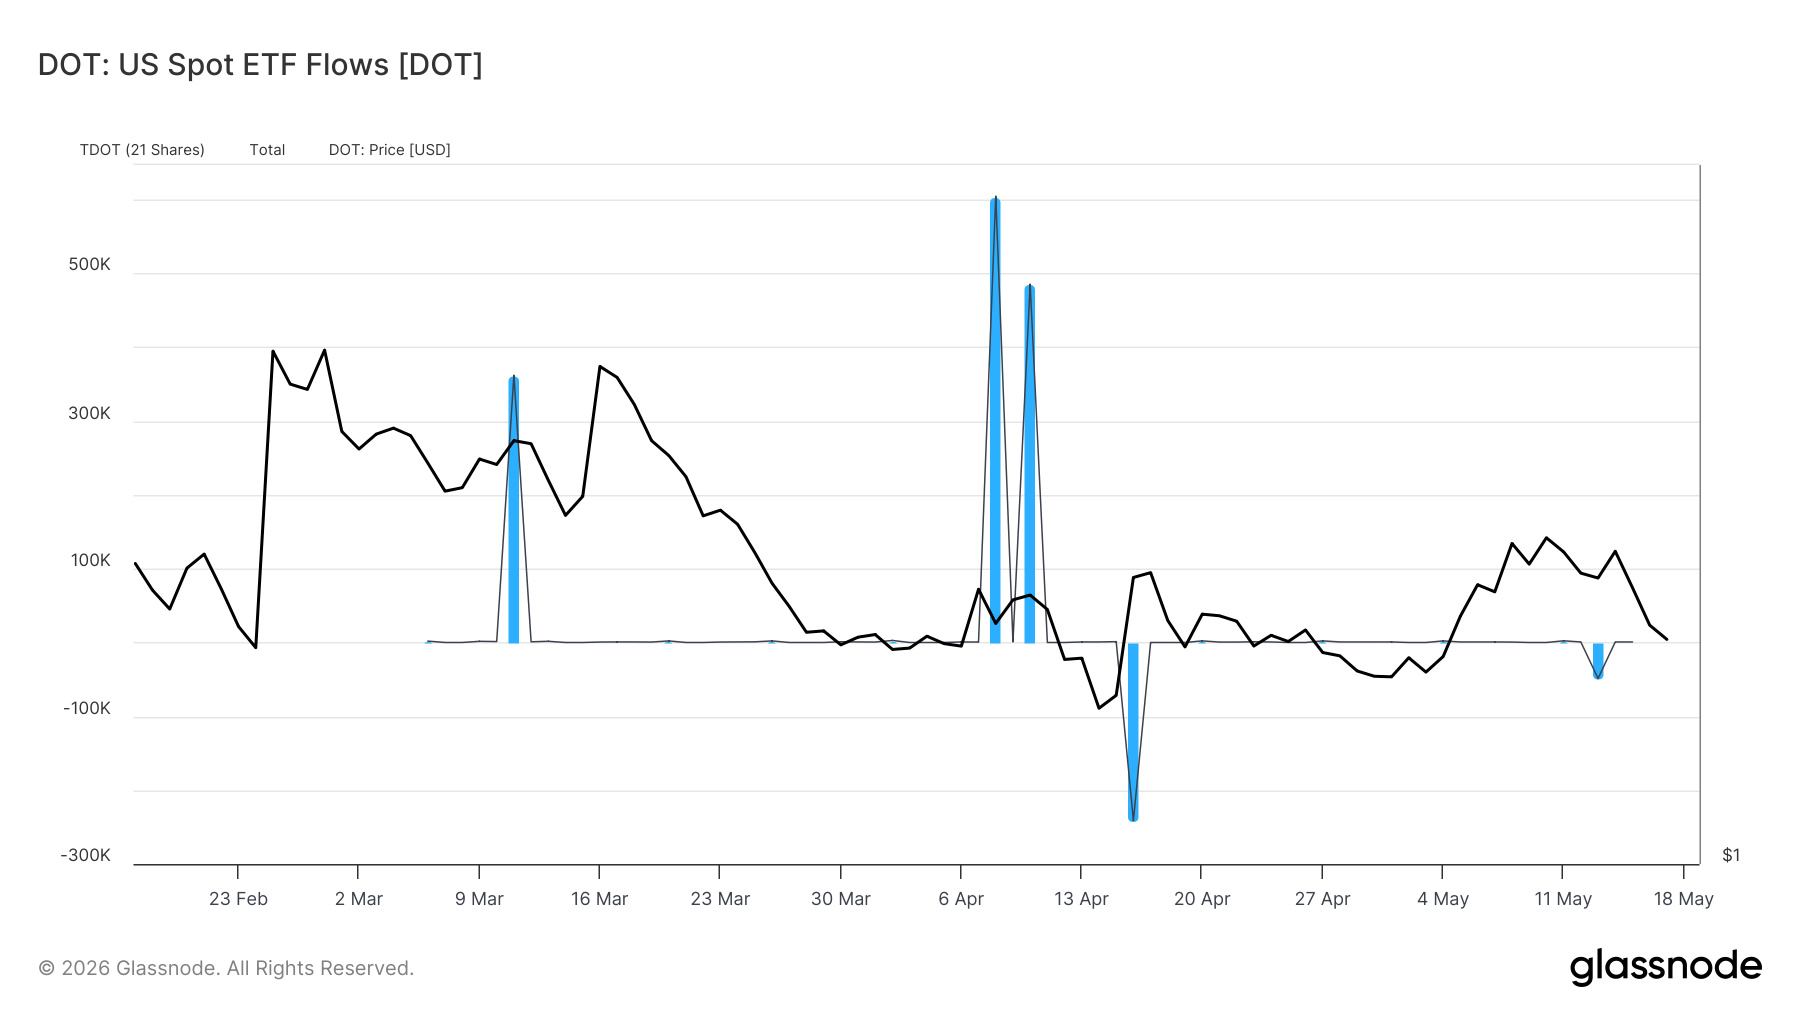
The biggest issue currently weighing on DOT is the lack of institutional participation in the 21Shares Polkadot ETF ($TDOT).
For context, the ETF launched on Nasdaq in March with an initial seed allocation of $11.4 million.
As expected, several analysts initially viewed it as a major breakthrough for Polkadot’s Wall Street adoption narrative.
However, momentum quickly disappeared.
According to fund flow tracking metrics:
Net inflows into the ETF have remained flat for weeks.
Daily trading activity has collapsed to only a few thousand shares per session.
Institutional secondary-market demand has almost completely disappeared.
As a result, the ETF can now be described as a “liquidity ghost town.”
Without a strong and consistent institutional bid absorbing spot DOT supply, the network’s reduced inflation rate is not yet strong enough to offset normal retail selling pressure.
Why Else Is Polkadot Falling?
Furthermore, Polkadot’s weakness is also being amplified by the broader macro liquidity crisis currently impacting all risk assets.
As CCN reported earlier, the US 30-year Treasury yields remain elevated near 5.12%. At the same time, Japanese sovereign bond yields continue to surge to multi-decade highs.
As global bond yields rise, institutional capital is rotating away from speculative assets and back into higher-yielding government debt markets.
This process is draining liquidity from crypto markets across the board.
Unfortunately, assets with weaker institutional momentum are being hit hardest. As such, Polkadot’s price might struggle to see sustained upside.
What Could Be Next for DOT Price?
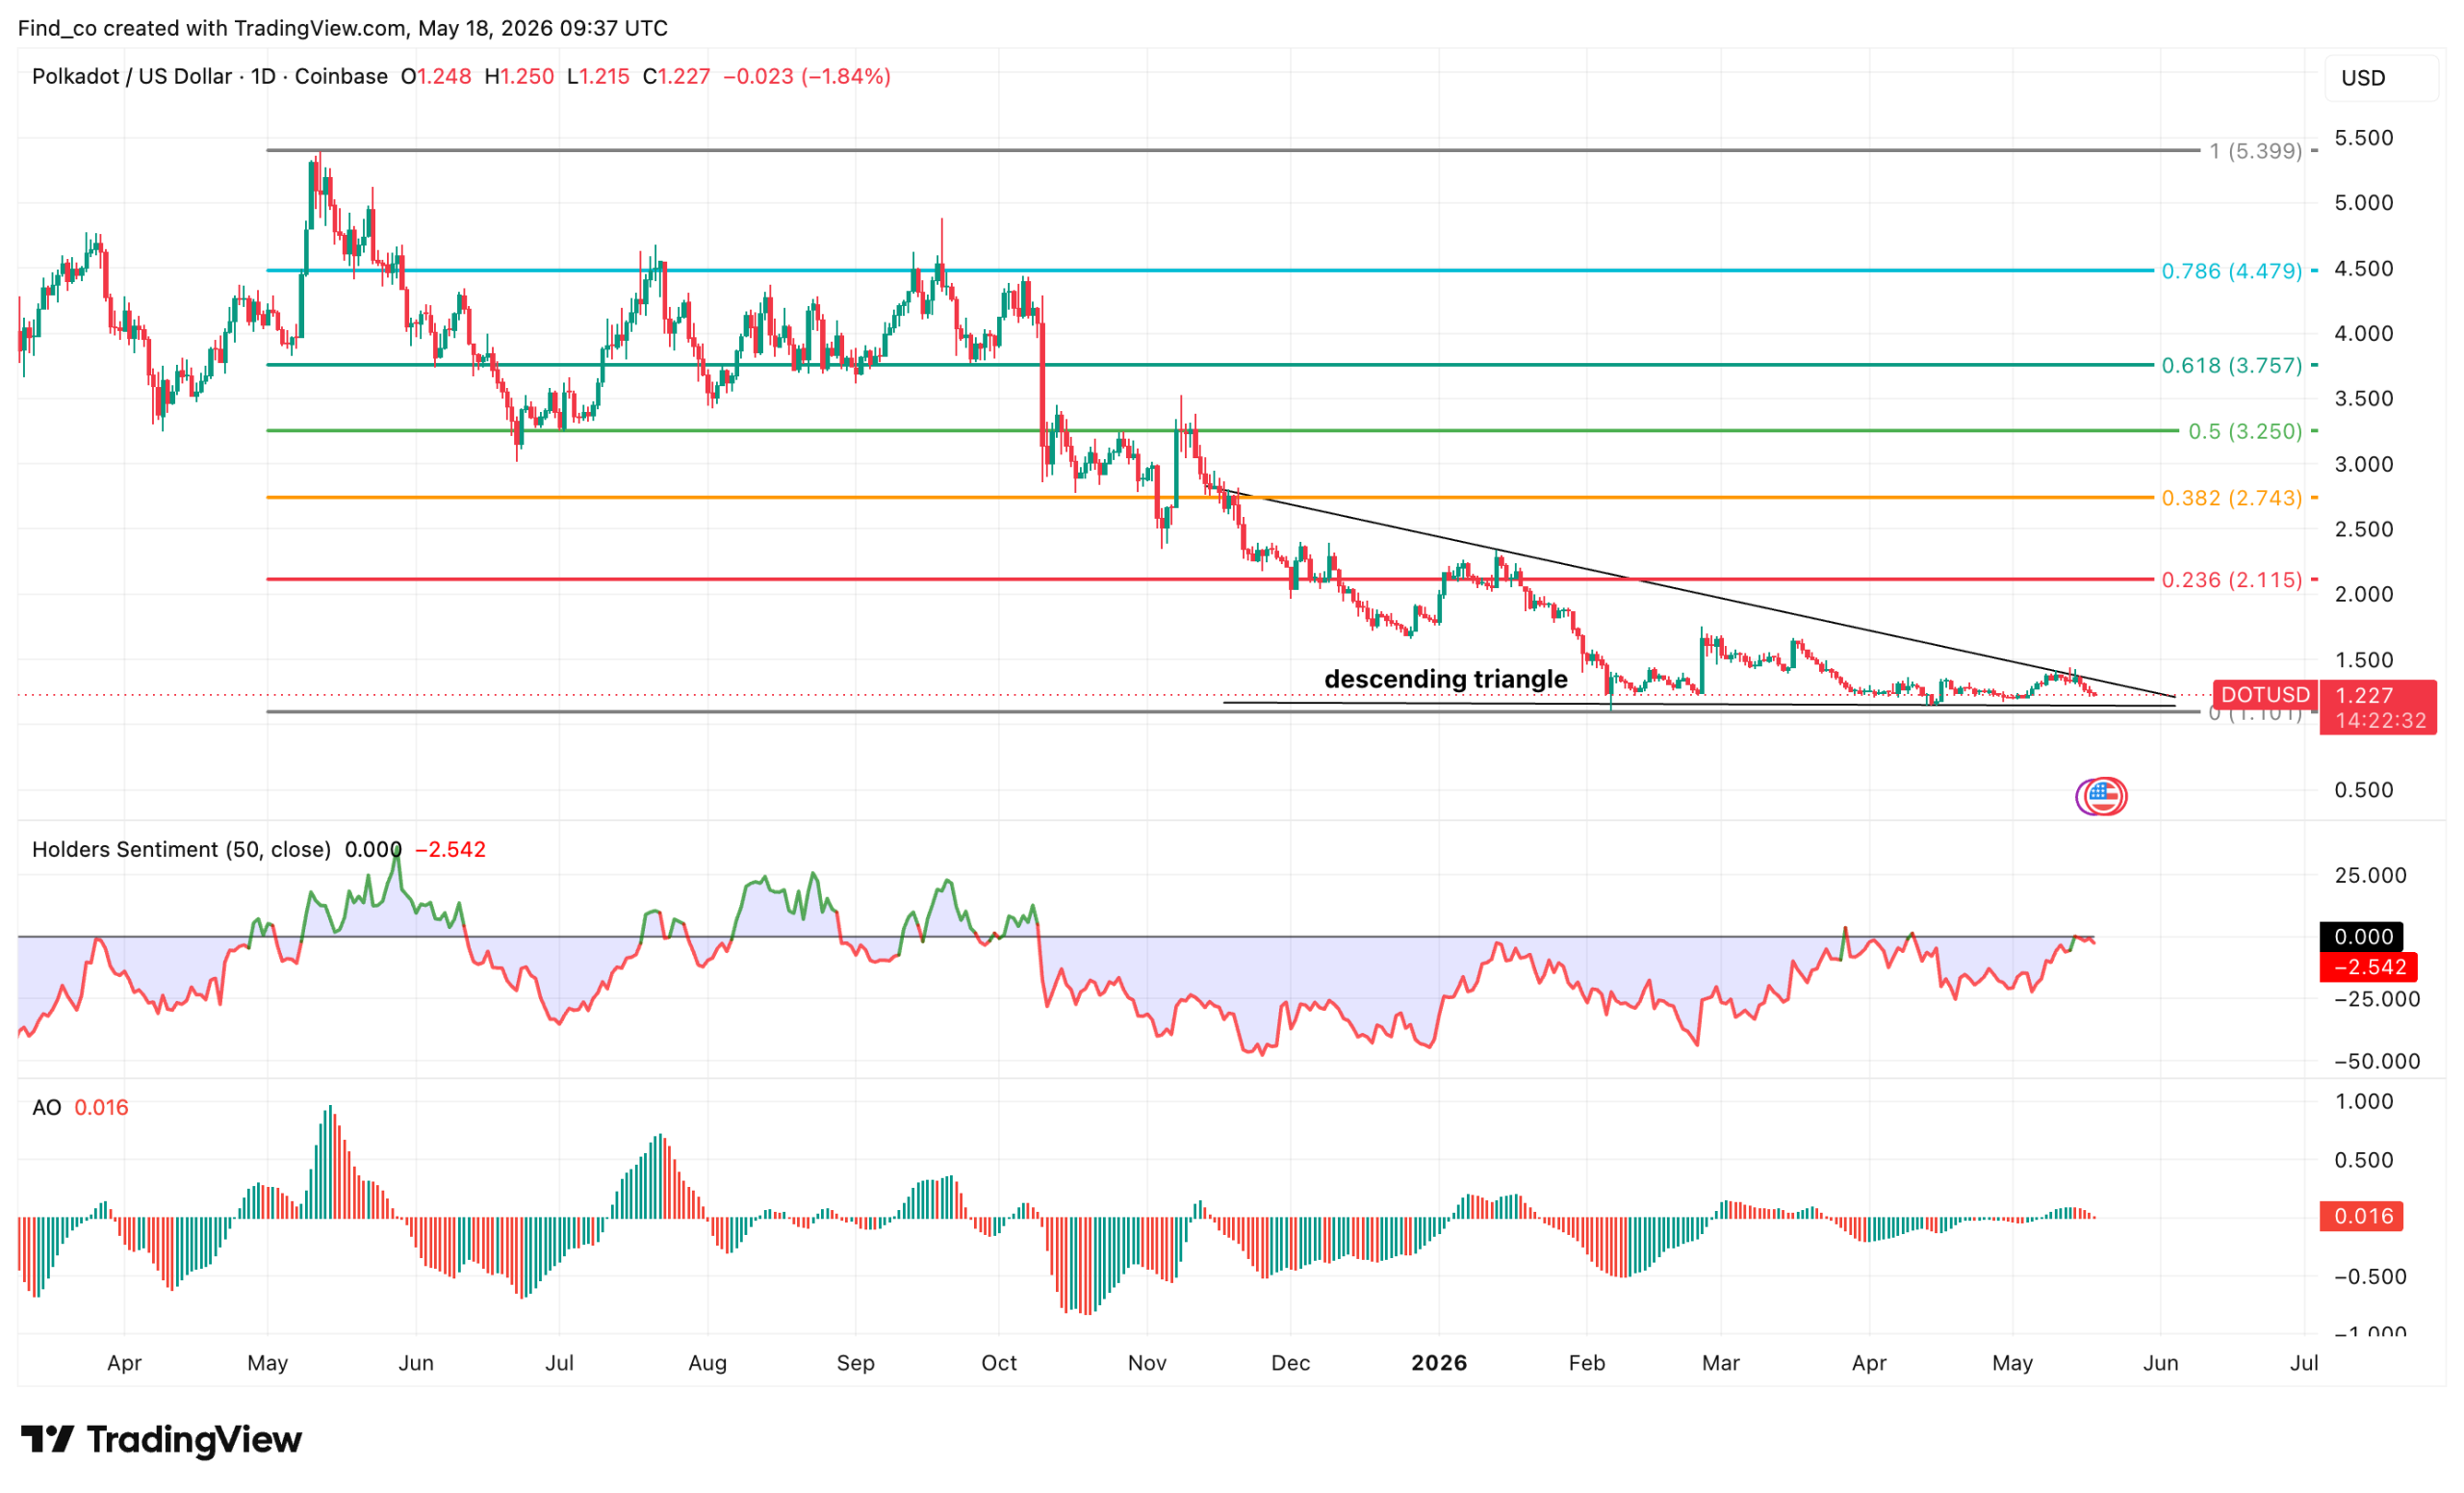
On the daily chart, Polkadot continues to trade inside a descending triangle, with the price compressing near the critical $1.20 support zone after months of lower highs.
The structure remains bearish overall. However, the repeated defense of support suggests sellers may be losing momentum.
The key resistance to watch is the descending trendline near $1.35.
A breakout above that level could trigger a larger relief rally toward the 0.236 Fibonacci level around $2.11, followed by $2.74 if momentum strengthens.
Despite that, the Awesome Oscillator (AO) is also starting to flatten near the zero line, hinting that bearish momentum may be fading.
However, Polkadot’s price still lacks strong bullish confirmation.
Disclaimer:
The information provided in this article is for informational purposes only. It is not intended to be, nor should it be construed as, financial advice. We do not make any warranties regarding the completeness, reliability, or accuracy of this information. All investments involve risk, and past performance does not guarantee future results. We recommend consulting a financial advisor before making any investment decisions.
Victor Olanrewaju is a crypto analyst and reporter at CCN with deep roots in on-chain research and technical analysis. His crypto journey began in 2017, but it was the 2020 Uniswap airdrop that sparked a full-time pivot into the space.
With a foundation in copywriting, Victor honed his craft creating high-converting content for leading crypto brokers — most notably an XRP price prediction that ranked #1 on Google during the 2021 bull run.
He later joined AMBCrypto in 2022, where he combined storytelling with technical and on-chain analysis to cover key market narratives.
In 2024, he expanded his expertise at BeInCrypto, collaborating with analysts and using tools like Glassnode, Santiment, and IntoTheBlock to break down Bitcoin and altcoin trends.
At CCN, Victor covers the top cryptocurrencies, memecoins, macro shifts, blending real-time insights with deep-dive metrics.
He holds a Bachelor’s degree in Physics from the University of Ibadan, equipping him to simplify complex data for a wide audience. Follow his work or connect on LinkedIn or X.