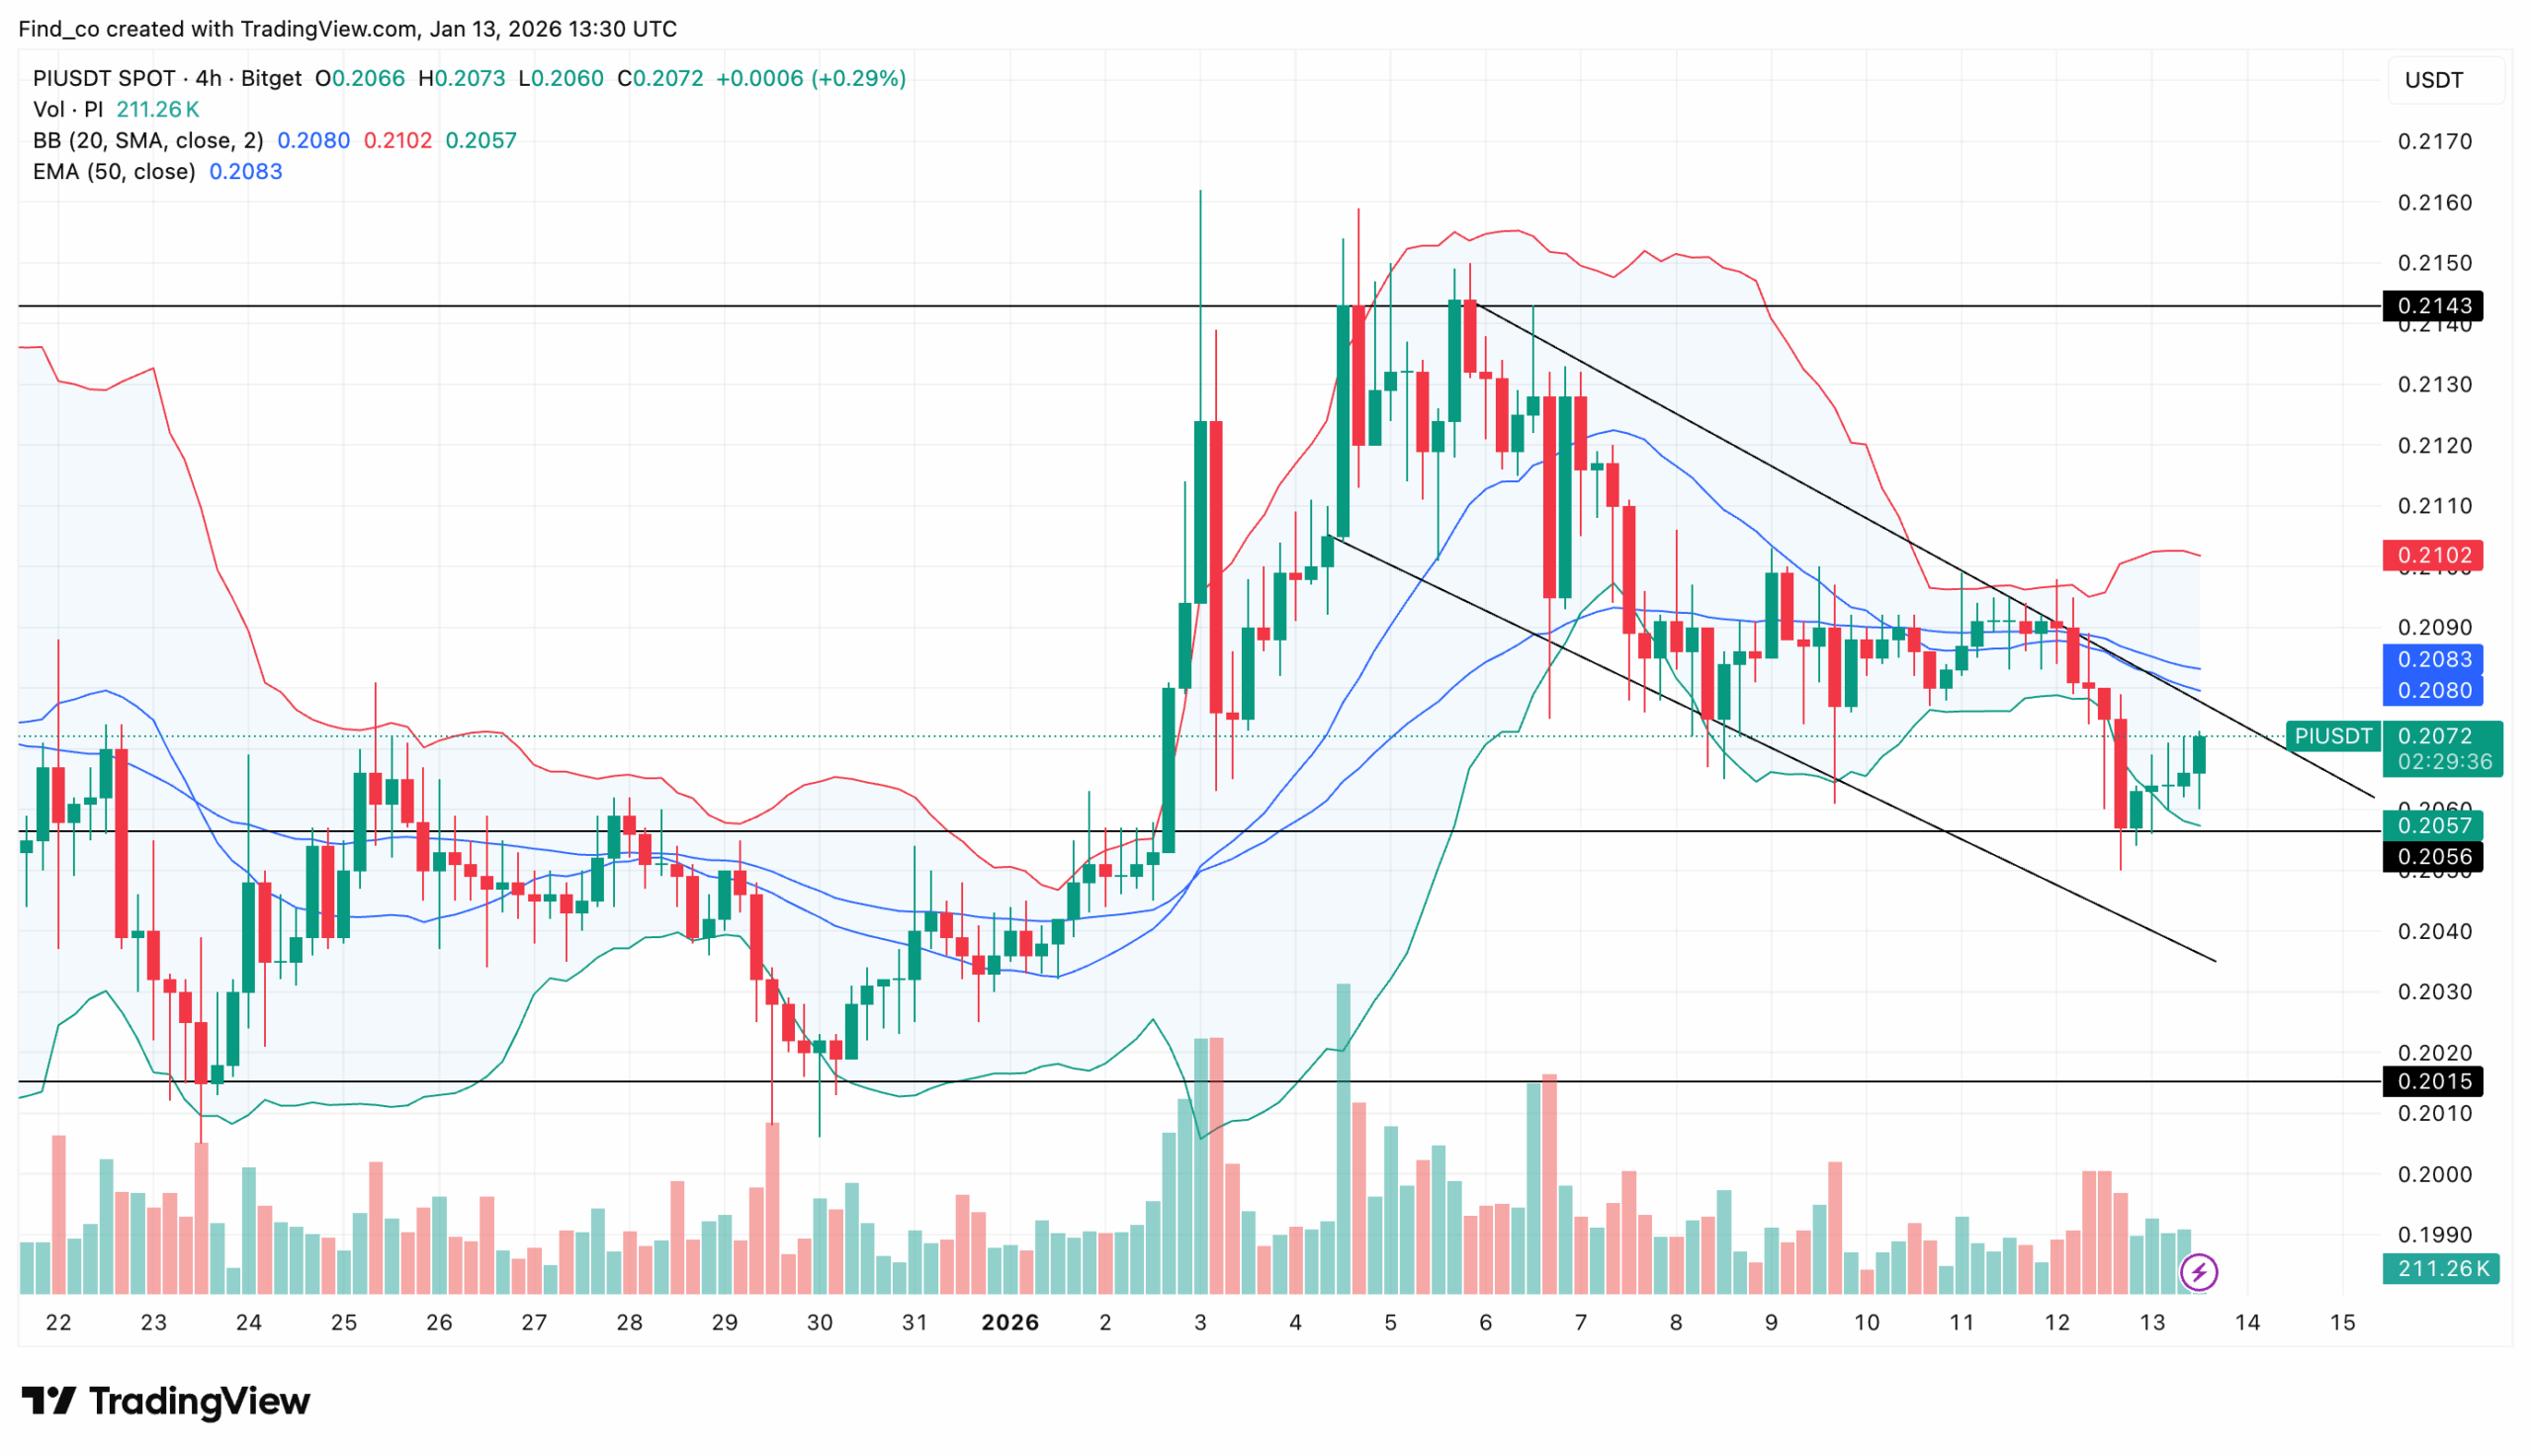
PI remains in a bearish structure, characterized by lower highs, as it falls below the 50 EMA.
Trading volume confirms distribution, with sell-offs showing heavier activity than bounces.
Multiple retests have weakened support as a close below $0.20 raises the odds of a move to $0.15.
Pi Network (PI) continues to struggle under heavy selling pressure. Despite brief attempts at recovery, the chart still tells a bearish story.
Momentum remains weak. The structure is broken, and unless conditions change soon, the $0.20 support level could be tested again soon.
Over the past several weeks, the PI coin price has failed to reclaim key resistance zones.
Each bounce has been shallow and short-lived. That behavior often signals exhaustion, not strength. Buyers step in, but they do not stay long enough to flip the trend. As a result, sellers quickly regain control.
Pi Network Bull Case Is Fading
From a structure perspective, the problem is clear. PI lost its previous higher-low formation earlier this year, as seen on the 4-hour chart.
Since then, the price has printed a series of lower highs. Amid this, the Bollinger Bands (BB) reading has expanded, indicating high volatility with no breakout.
That shift marks a transition from bullish to bearish structure. Until PI can reclaim and hold above its last major lower high, the broader trend remains intact to the downside.
Meanwhile, moving averages add more weight to the bearish case. Price continues to trade below the 50-day Exponential Moving Average (EMA). Even worse, the 50 EMA (blue) is sloping downward.
This setup often acts as a notable resistance. Every rally into these levels attracts fresh selling pressure. So far, PI’s price has shown no ability to break through them.
If this remains the case, the cryptocurrency will struggle to break through the resistance at $0.21, possibly driving the PI coin price lower by nearly 20%.
Volume Shows It’s Now a Ghost Chain
Volume behavior also raises concerns. Downward moves tend to come with more substantial volume, while recoveries happen on lighter activity.
However, as of this writing, the Pi Network volume has dropped below $7 million.
This imbalance shows that sellers are more aggressive than buyers. In healthy bullish trends, the opposite is usually true. Here, distribution appears to be ongoing.
Thus, if this trend continues, the PI coin might remain trapped in lower levels.
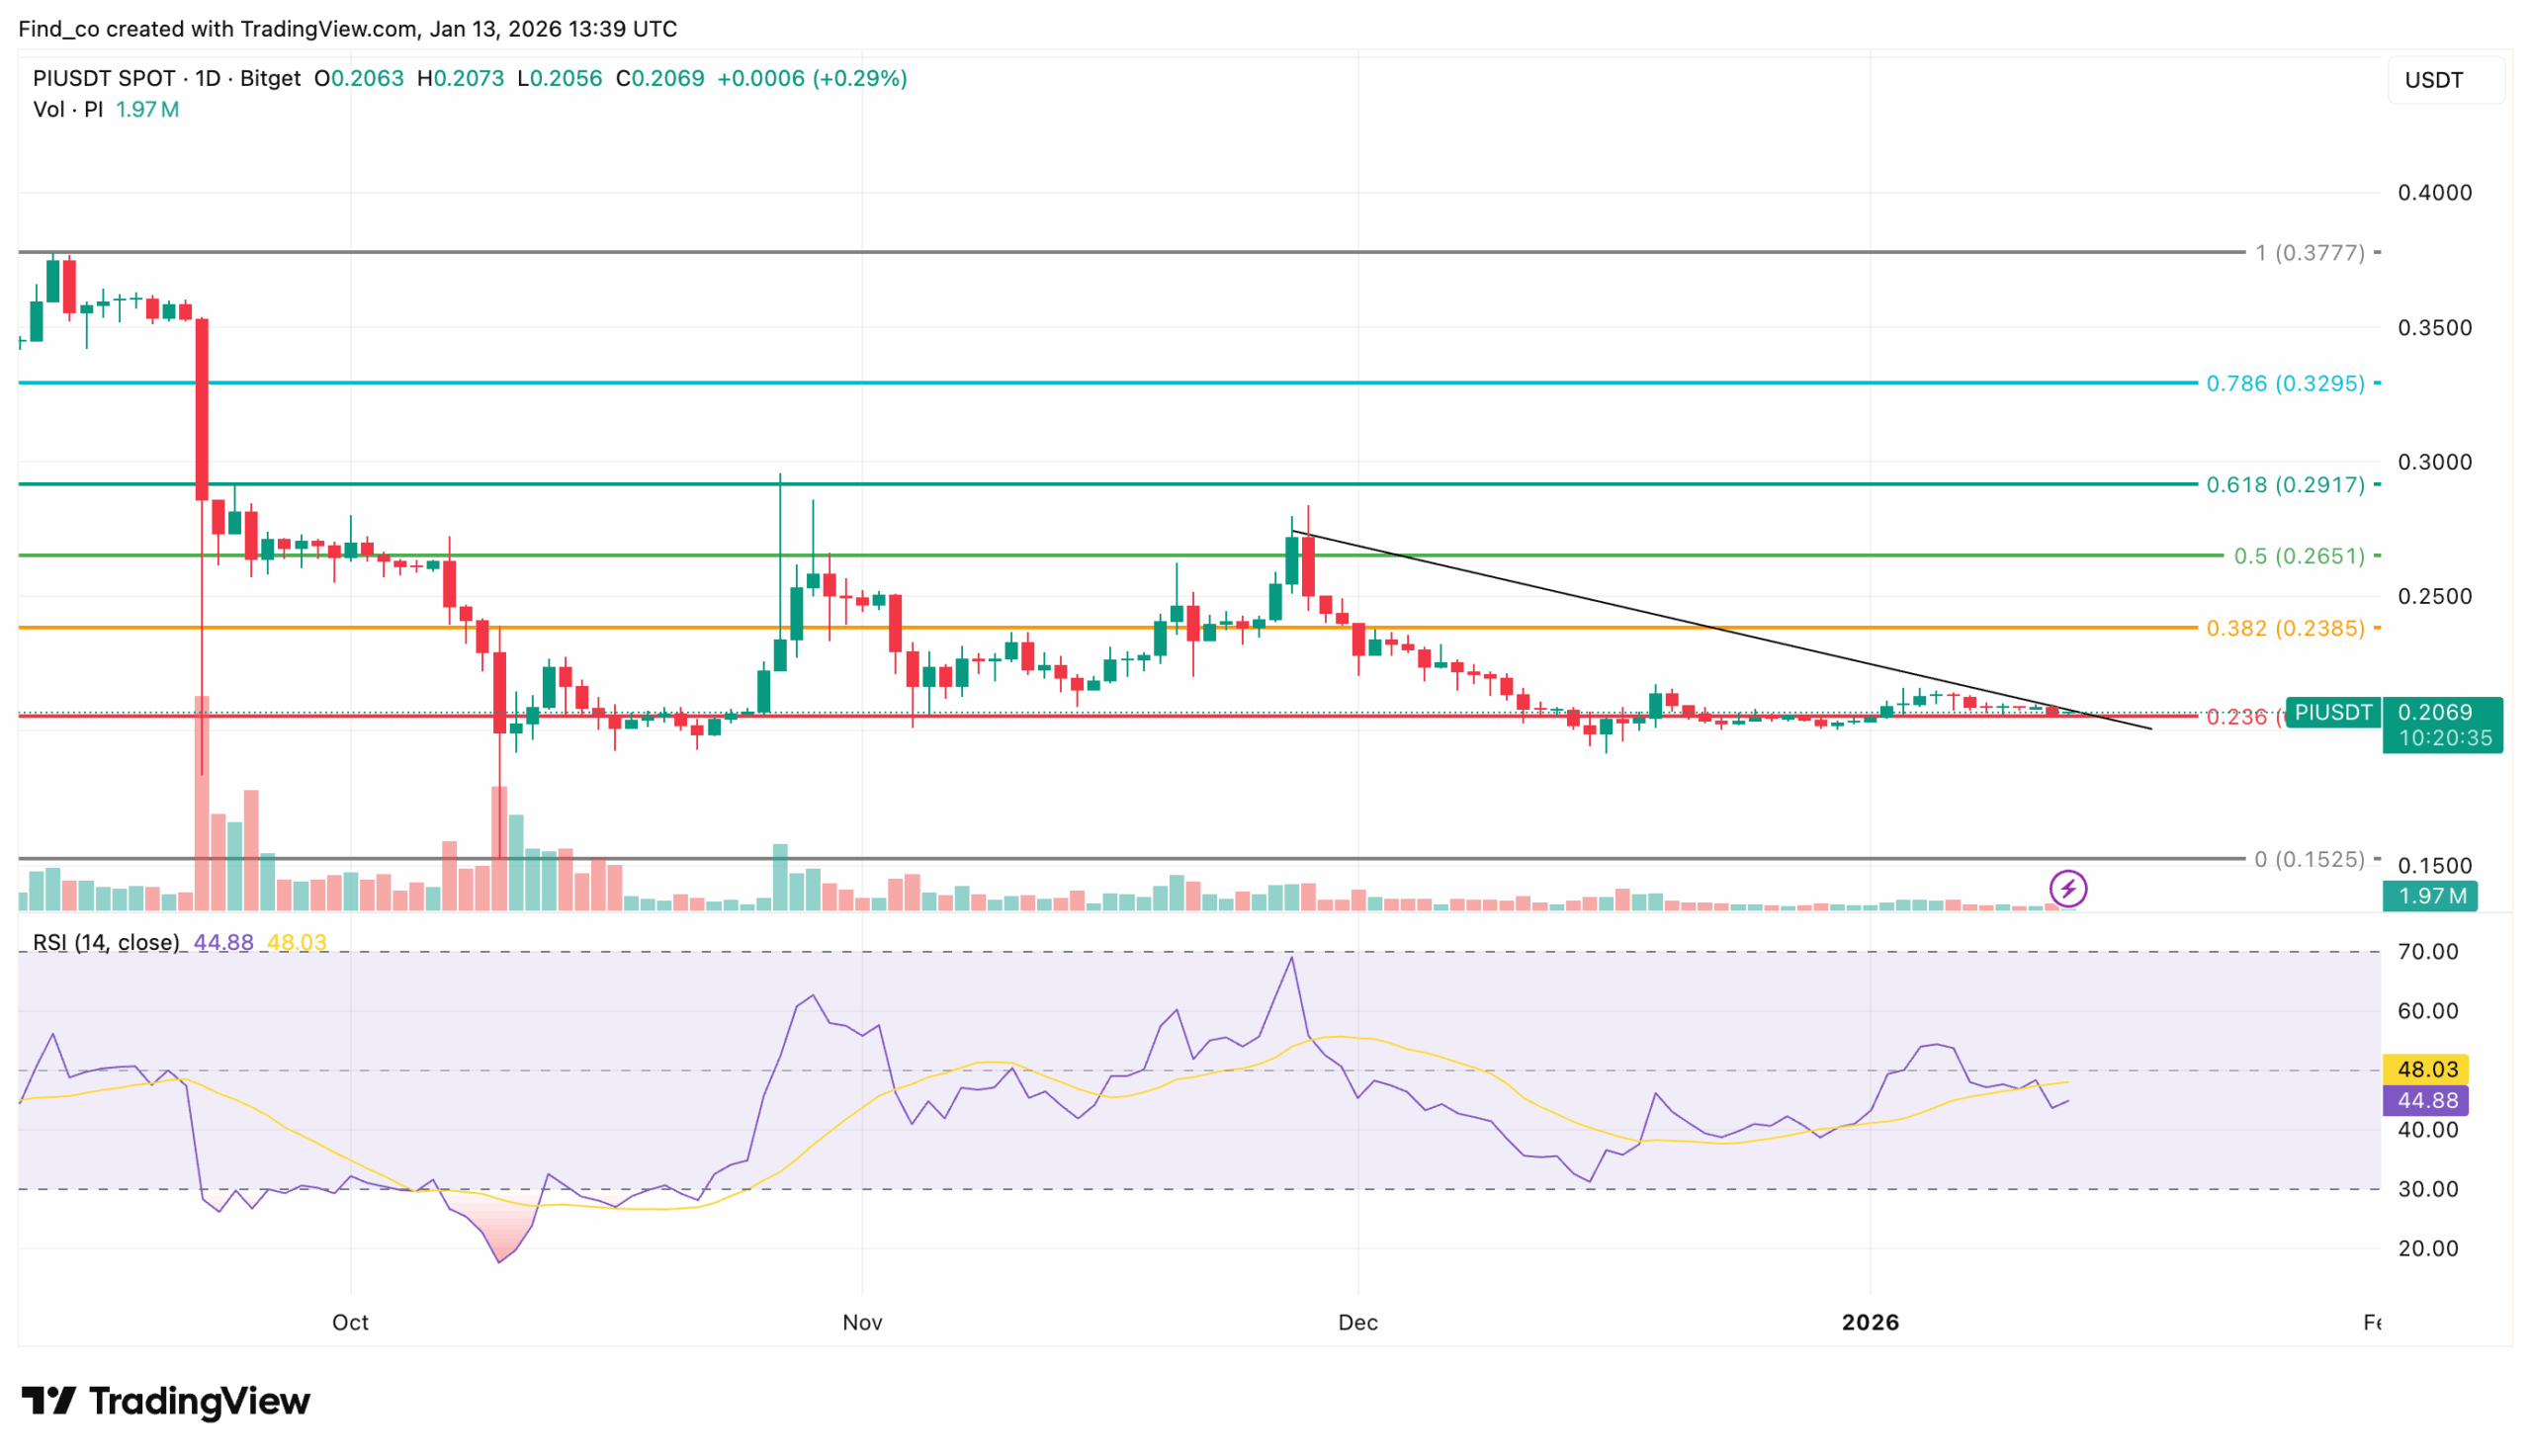
All eyes are now focused on the $0.20 support zone, as shown on the daily chart.
This level has acted as a psychological and technical floor in the past. Buyers previously defended it with conviction.
However, repeated tests tend to weaken support over time. Each bounce drains liquidity. Each retest increases the risk of a breakdown.
If PI’s price drops below $0.20 again without a substantial momentum shift, the odds of a clean hold drop significantly.
A daily close below that level could open the door to deeper losses. In that scenario, price discovery may accelerate as stop-loss orders are triggered.
That said, the bearish outlook is not guaranteed. Markets can always surprise. For the PI coin price to invalidate this setup, bulls must reclaim key resistance levels.
Momentum indicators tell a similar story. The Relative Strength Index (RSI) has struggled to maintain a position above the neutral 50 level. Each push higher quickly fades.
That suggests weak bullish conviction. At the same time, RSI has not reached deeply oversold levels either. This leaves room for further downside before buyers feel forced to step in.
A sustained move above the declining moving averages would be a start. Substantial volume expansion would also help. Without those signals, however, optimism remains speculative.
In the short term, traders should be cautious, as the technical structure favors sellers. Momentum remains fragile. And the margin for error around $0.20 is shrinking fast.
If that is the case, PI’s price might decline to $0.15. Until PI proves otherwise, the path of least resistance continues to point lower.
Disclaimer:
The information provided in this article is for informational purposes only. It is not intended to be, nor should it be construed as, financial advice. We do not make any warranties regarding the completeness, reliability, or accuracy of this information. All investments involve risk, and past performance does not guarantee future results. We recommend consulting a financial advisor before making any investment decisions.
Victor Olanrewaju is a crypto analyst and reporter at CCN with deep roots in on-chain research and technical analysis. His crypto journey began in 2017, but it was the 2020 Uniswap airdrop that sparked a full-time pivot into the space.
With a foundation in copywriting, Victor honed his craft creating high-converting content for leading crypto brokers — most notably an XRP price prediction that ranked #1 on Google during the 2021 bull run.
He later joined AMBCrypto in 2022, where he combined storytelling with technical and on-chain analysis to cover key market narratives.
In 2024, he expanded his expertise at BeInCrypto, collaborating with analysts and using tools like Glassnode, Santiment, and IntoTheBlock to break down Bitcoin and altcoin trends.
At CCN, Victor covers the top cryptocurrencies, memecoins, macro shifts, blending real-time insights with deep-dive metrics.
He holds a Bachelor’s degree in Physics from the University of Ibadan, equipping him to simplify complex data for a wide audience. Follow his work or connect on LinkedIn or X.