The 4-hour chart highlights ONDO’s corrective phase following an impulsive Elliott Wave pattern (labeled (i) to (v)).
The peak at $2.15 marked the conclusion of wave (v), triggering a 38% correction that brought prices down to $1.31.
This decline aligns with the formation of a descending channel—a structure often associated with upcoming bullish reversals.
ONDOUSD in a descending channel | Credit: Nikola Lazic/TradingView
The price is consolidating near the 0.5 Fibonacci retracement level at $1.32, a crucial support zone.
Retesting this level multiple times without breaking lower suggests stability, with the potential for upward movement.
The Relative Strength Index (RSI) has shifted from overbought to oversold territory during the correction.
This indicates diminishing selling pressure and potential room for a bullish breakout if buyers step in.
Current RSI levels are neutral to slightly oversold, aligning with the descending channel’s reversal potential.
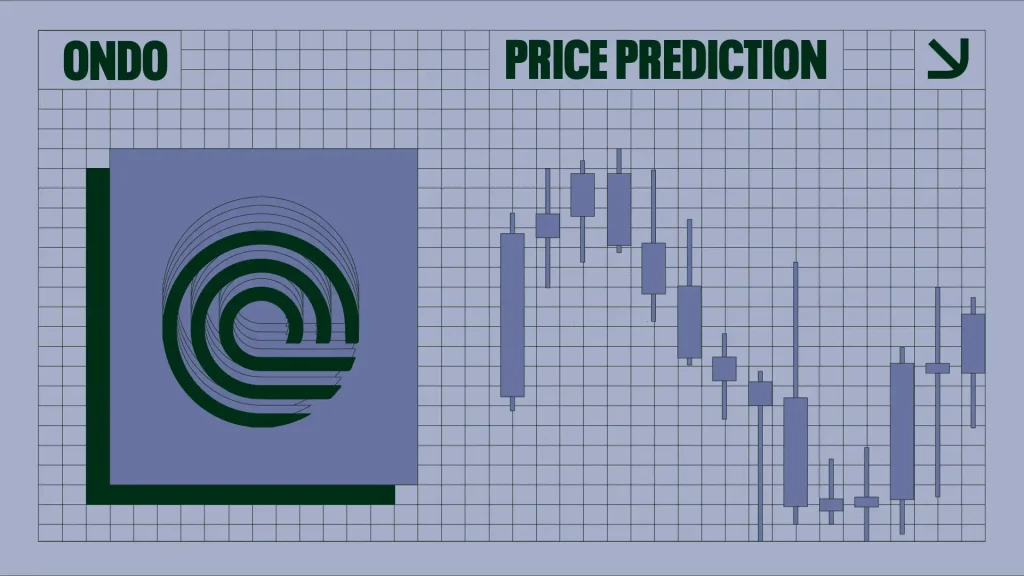
ONDO Price Prediction
The hourly chart demonstrates a corrective ABC pattern after a significant impulsive wave, with the price currently forming a potential bottom near wave (v) of the correction.
The structure is within a descending channel, suggesting a possible breakout to the upside if buying momentum increases.
The Fibonacci retracement levels and key support zones highlight potential reversal areas.
ONDOUSD breakout could be seen soon | Credit: Nikola Lazic/TradingView
Wave (v) aligns with the 0.5 Fibonacci retracement level at $1.36, indicating strong support.
If this level holds, the price may begin to reverse and challenge resistance at $1.54 (0.382 Fibonacci level) or higher.
RSI shows signs of oversold conditions, indicating the potential for upward movement if buyers step in.
A breakout above the descending channel and sustained momentum could lead to a retest of the $1.77 resistance (0.236 Fibonacci level).
However, failure to hold current support could push the price toward the next Fibonacci support at $1.17 (0.618 Fibonacci level).
Key Levels To Watch
Support: $1.32 (0.5 Fibonacci level) and $1.17 (0.618 Fibonacci level).
Resistance: $1.55 (0.382 Fibonacci level) and $1.77 (0.236 Fibonacci level).
Breakout Confirmation: A decisive move above the descending channel with volume.
Disclaimer:
The information provided in this article is for informational purposes only. It is not intended to be, nor should it be construed as, financial advice. We do not make any warranties regarding the completeness, reliability, or accuracy of this information. All investments involve risk, and past performance does not guarantee future results. We recommend consulting a financial advisor before making any investment decisions.
Nikola Lazic is a cryptocurrency analyst and investor working in the industry since 2017. He holds a bachelor's degree in Sociology, which enables him to better understand the psychology behind the crowd´s positioning. Consequently his preferred analytical tool is Elliott Wave Theory in combination with price action analysis.
Combining his experience in trading and investing with knowledge in content writing he strives to bring the most accurate and actionable information.