Binance Coin (BNB) is consolidating as it seeks to establish a firm support level near $700 following the completion of a corrective Wave 4.
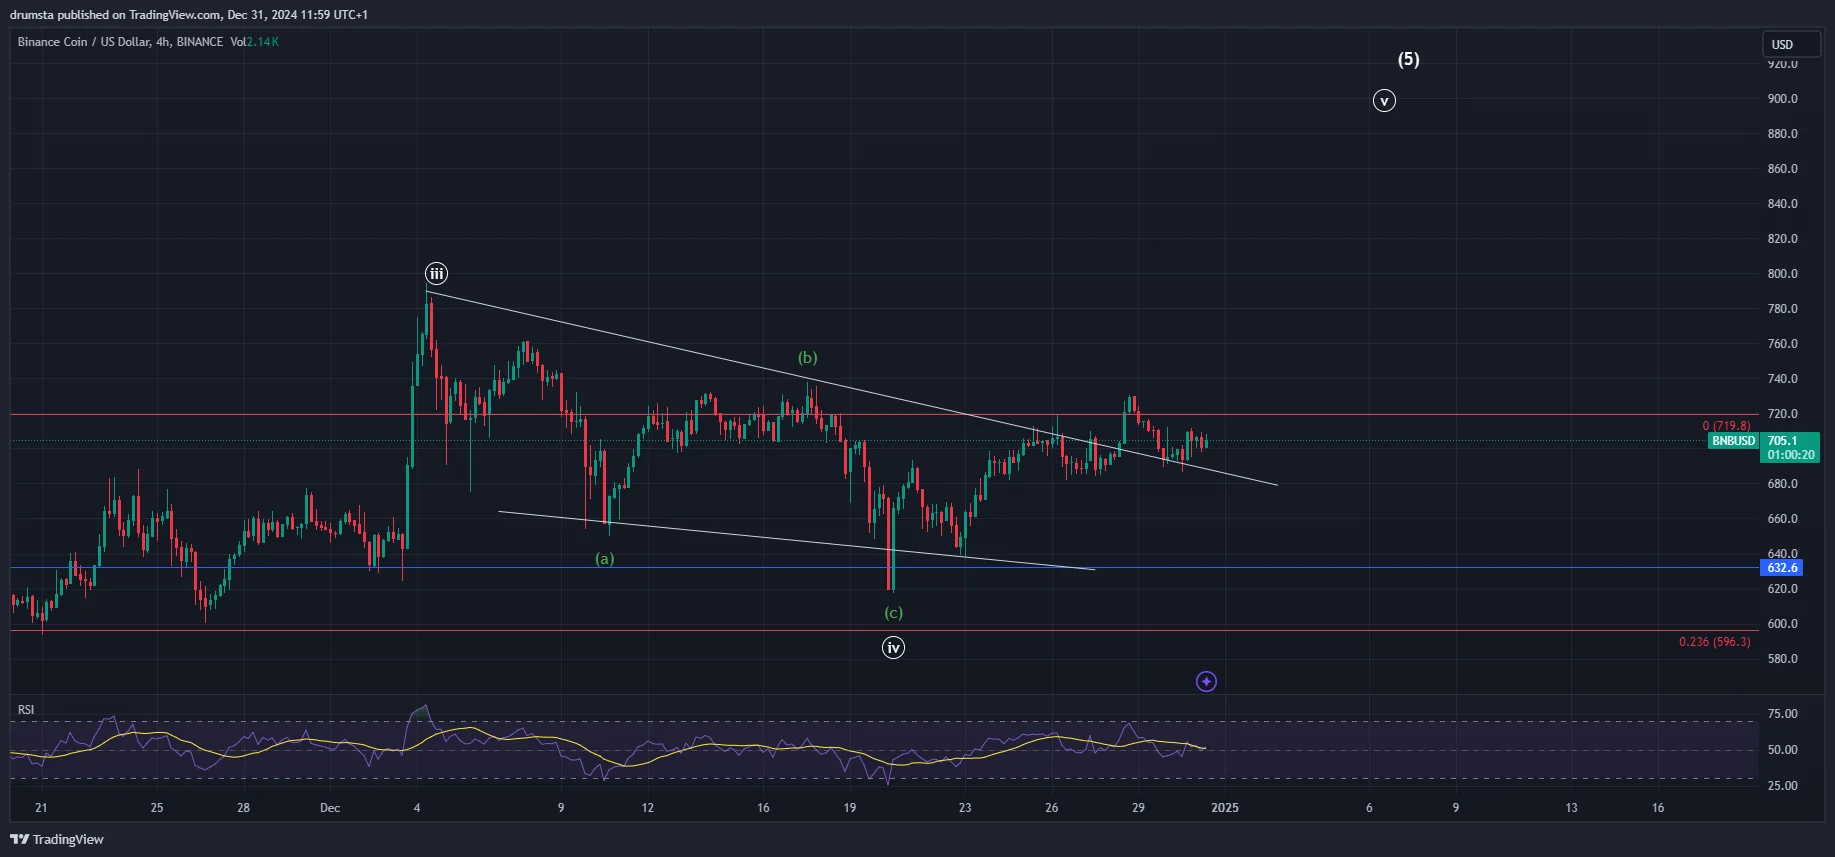
The recent price action reflects an A-B-C corrective structure, which reached a low of $620 on Dec. 20 before staging its recent recovery.
BNBUSD consolidating after a breakout | Credit: Nikola Lazic/TradingView
The Dec. 28 breakout pushed BNB above the descending channel resistance, driving the price to a high of $730. However, a subsequent pullback has brought the price back to test the former resistance as a potential support zone above $700. If this level holds, it could signal the development of a higher-degree Wave 5.
Immediate support is located at $632, aligning with the lower boundary of the corrective wave structure.
On the upside, resistance remains critical at $720—a breach of this level would signal renewed bullish momentum. A successful breakout could pave the way for an impulsive wave targeting higher Fibonacci extension levels, consistent with Wave v projections.
Market volume remains muted, indicating indecision among traders. A sustained hold above $700 could increase the likelihood of a bullish continuation.
However, failure to clear resistance may prompt a retest of key support levels, potentially invalidating the current bullish setup.
BNB Price Prediction
Binance Coin (BNB) is consolidating as it navigates a corrective wave structure following the completion of an impulsive rally.
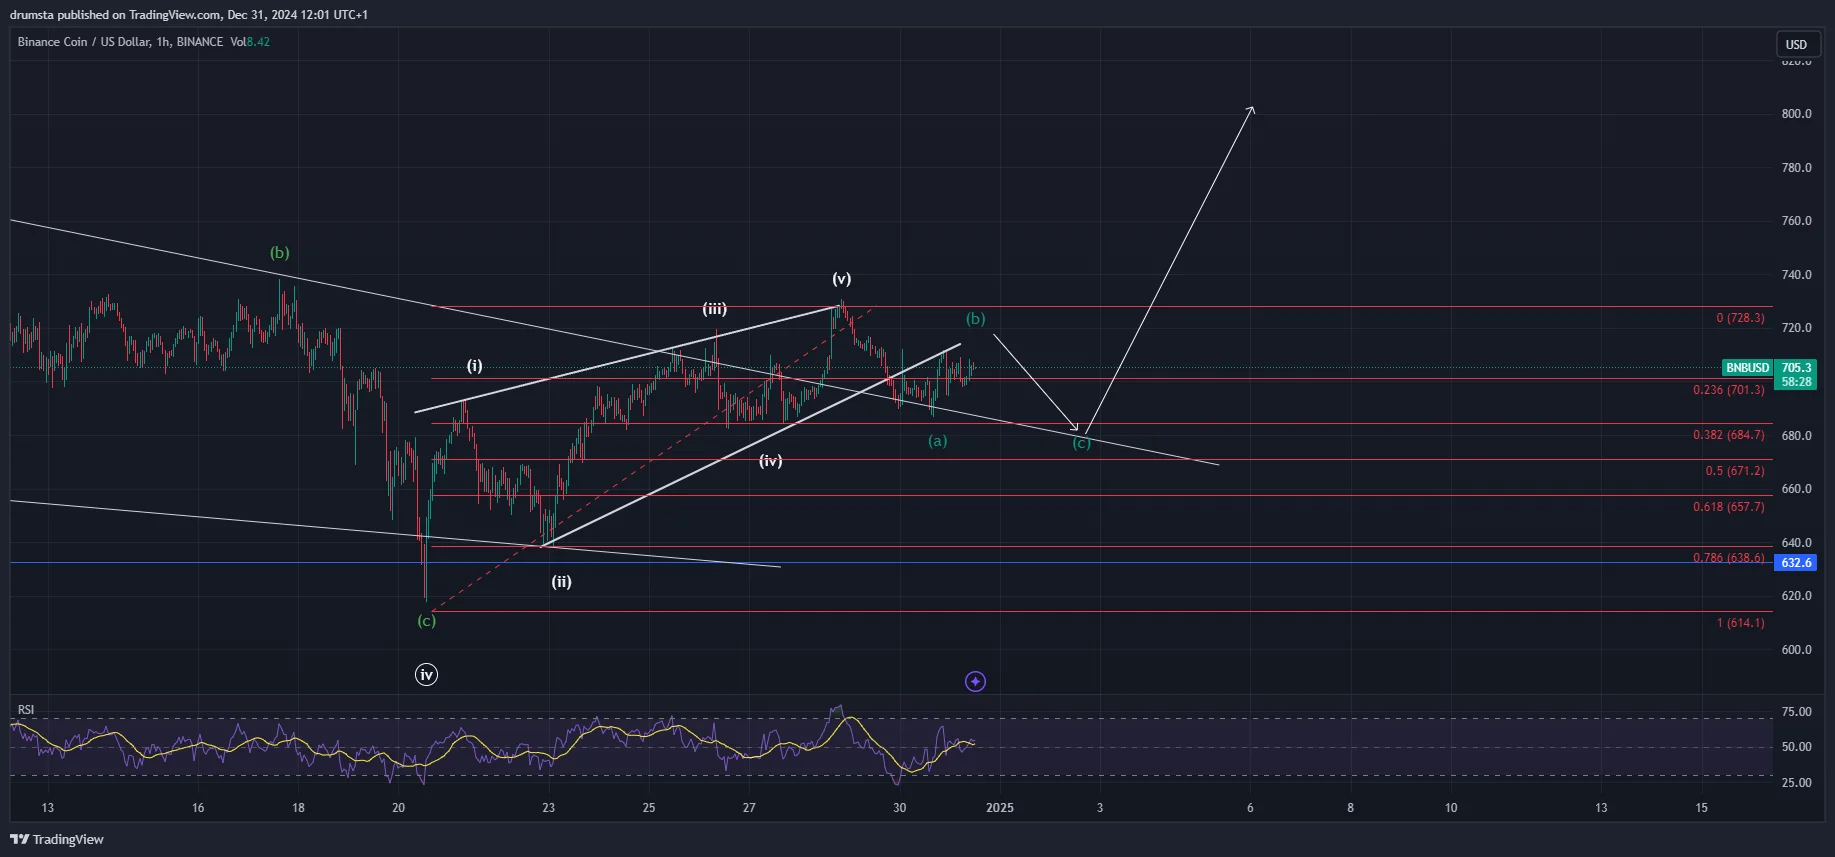
The current price action reflects a potential a-b-c correction, with BNB hovering near the 0.236 Fibonacci retracement level at $701.
Momentum indicators, including the Relative Strength Index (RSI), remain neutral, signaling that the market is poised for a decisive directional shift.
BNBUSD likely to develop another descending move | Credit: Nikola Lazic/TradingView
Since Dec. 20, BNB’s first leading diagonal in a five-wave pattern has transitioned into a corrective phase.
This phase appears to be retesting prior resistance levels to establish a stronger support baseline.
While another downward move is expected, it is likely to hold above the 0.382 Fibonacci retracement level and the descending trendline.
Key support levels to watch include $684.7 (0.382 Fibonacci retracement) and $671.2 (0.5 Fibonacci retracement).
On the upside, resistance remains firm at $728.3, a breakout above which would signal a resumption of bullish momentum. Should selling pressure intensify, deeper retracement levels at $657.7 (0.618 Fib) and $632.6 (0.786 Fib) could be tested.
The next critical move for BNB hinges on its ability to breach $728.3.
A confirmed breakout would likely set the stage for the next impulsive wave, targeting higher Fibonacci extension levels. Conversely, failure to sustain momentum could extend the corrective phase, bringing lower support levels into focus.
Key Levels to Watch
Immediate Support: $684.7 (0.382 Fibonacci retracement) and $671.2 (0.5 Fib).
Deeper Support: $657.7 (0.618 Fibonacci retracement) and $632.6 (0.786 Fib).
Immediate Resistance: $728.3, a key level for confirming bullish momentum.
Key Targets for Breakout: Higher Fibonacci extensions if bullish continuation occurs.
Invalidation Level: Below $632.6, signaling further bearish momentum.
RSI is neutral, indicating potential for a move in either direction depending on volume.
Disclaimer:
The information provided in this article is for informational purposes only. It is not intended to be, nor should it be construed as, financial advice. We do not make any warranties regarding the completeness, reliability, or accuracy of this information. All investments involve risk, and past performance does not guarantee future results. We recommend consulting a financial advisor before making any investment decisions.
Nikola Lazic is a cryptocurrency analyst and investor working in the industry since 2017. He holds a bachelor's degree in Sociology, which enables him to better understand the psychology behind the crowd´s positioning. Consequently his preferred analytical tool is Elliott Wave Theory in combination with price action analysis.
Combining his experience in trading and investing with knowledge in content writing he strives to bring the most accurate and actionable information.