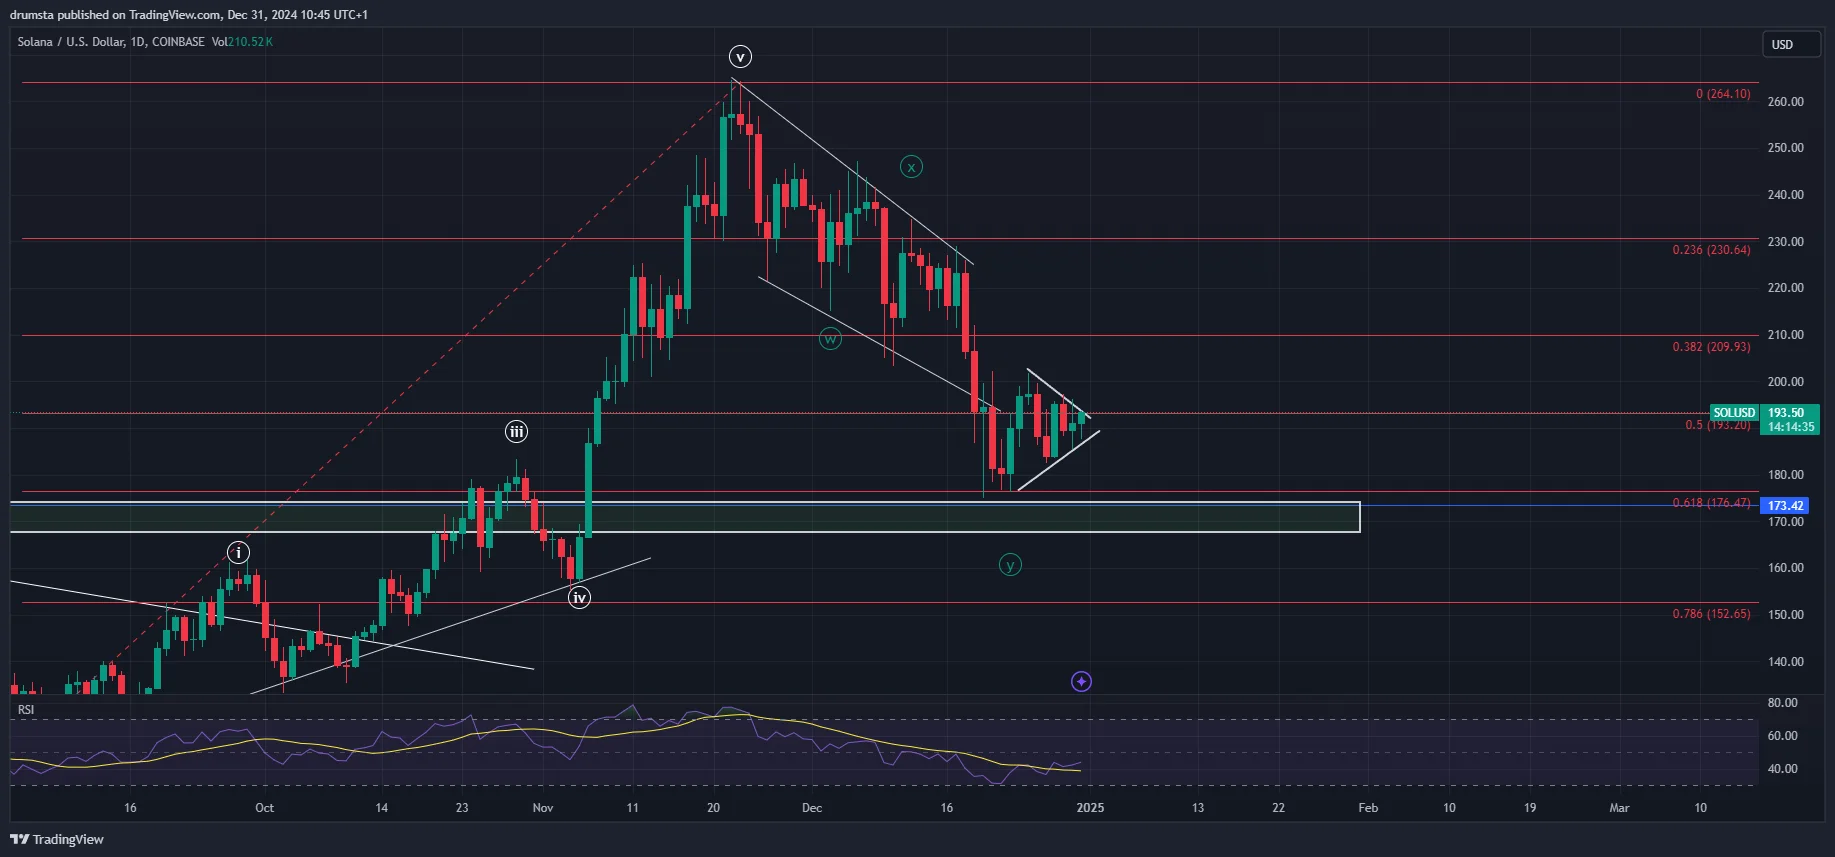
Solana’s correction phase has formed a W-X-Y pattern, consolidating near the 0.5 Fibonacci retracement level at $193.
The symmetrical triangle pattern developing on the chart indicates a likely breakout, with the direction contingent on key support and resistance levels. Momentum indicators, including the Relative Strength Index (RSI), show declining momentum, underlining market indecision.
SOLUSD consolidating after correction likely ended | Credit: Nikola Lazic/TradingView
The daily chart reveals critical support levels at $176 (0.618 Fibonacci retracement) and $152 (0.786 Fib), coinciding with a high-demand zone.
On Dec. 20, SOL found support at $176, initiating a consolidation phase within the symmetrical triangle. The pattern is a precursor to a decisive move, with volume and RSI shifts likely providing confirmation.
SOL Price Prediction
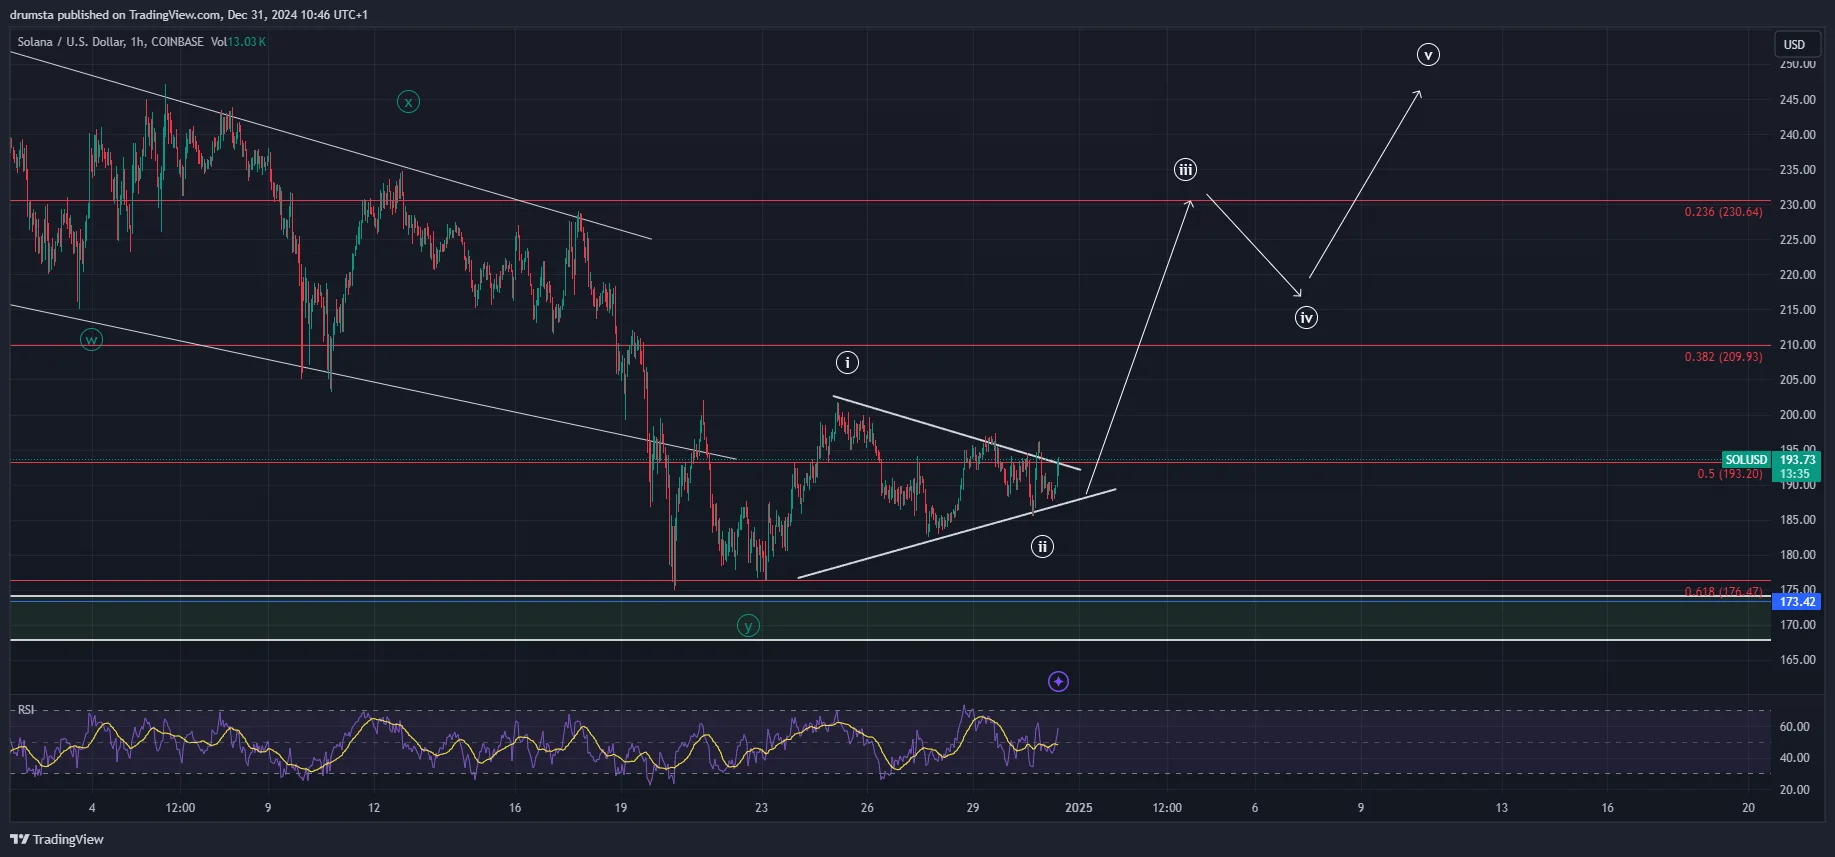
On the 1-hour chart, Solana is pressuring resistance near $193, pointing to potential bullish momentum.
The price action suggests the completion of Waves 1 and 2, with Wave 3 targeting $230. A bullish breakout could drive the price toward higher Fibonacci retracement levels, while a bearish move would invalidate this scenario, sending SOL toward deeper support levels.
SOLUSD breakout to the upside expected | Credit: Nikola Lazic/TradingView
Immediate resistance lies at $210 and $230, while deeper support zones rest at $176 and $152. The RSI remains neutral but trends upward, hinting at a possible shift in momentum.
Key Breakout Target: $210 and $230 (Wave iii) and higher Fibonacci extensions.
Invalidation Level: A breakdown below $173, suggesting further downside.
RSI indicates neutral momentum, with a potential shift toward bullish as volume builds.
Disclaimer:
The information provided in this article is for informational purposes only. It is not intended to be, nor should it be construed as, financial advice. We do not make any warranties regarding the completeness, reliability, or accuracy of this information. All investments involve risk, and past performance does not guarantee future results. We recommend consulting a financial advisor before making any investment decisions.
Nikola Lazic is a cryptocurrency analyst and investor working in the industry since 2017. He holds a bachelor's degree in Sociology, which enables him to better understand the psychology behind the crowd´s positioning. Consequently his preferred analytical tool is Elliott Wave Theory in combination with price action analysis.
Combining his experience in trading and investing with knowledge in content writing he strives to bring the most accurate and actionable information.