XMR drops 28% from its record peak. Is the Monero rally a blow-off top or a healthy reset before $1,000? | Credit: Hameem Sarwar
Share
Key Takeaways
Monero is consolidating after spiking near $800 and cooling to $573.
Liquidity clusters suggest a sharp move once $560 or $620 breaks.
XMR holds above key support, but a break below it risks deeper downside.
Monero (XMR) is navigating intense volatility following a historic rally.
After peaking at an all-time high of $798.91 on January 14, the leading privacy coin has entered a cooling phase.
At the time of writing, the XMR price currently trades near $573, a roughly 28% decline from its peak.
While the long-term target of $1,000 remains a dominant narrative, indicators suggest the price is likely to remain stuck in a near-term consolidation range. Here are the reasons.
Monero Retraces After ATH
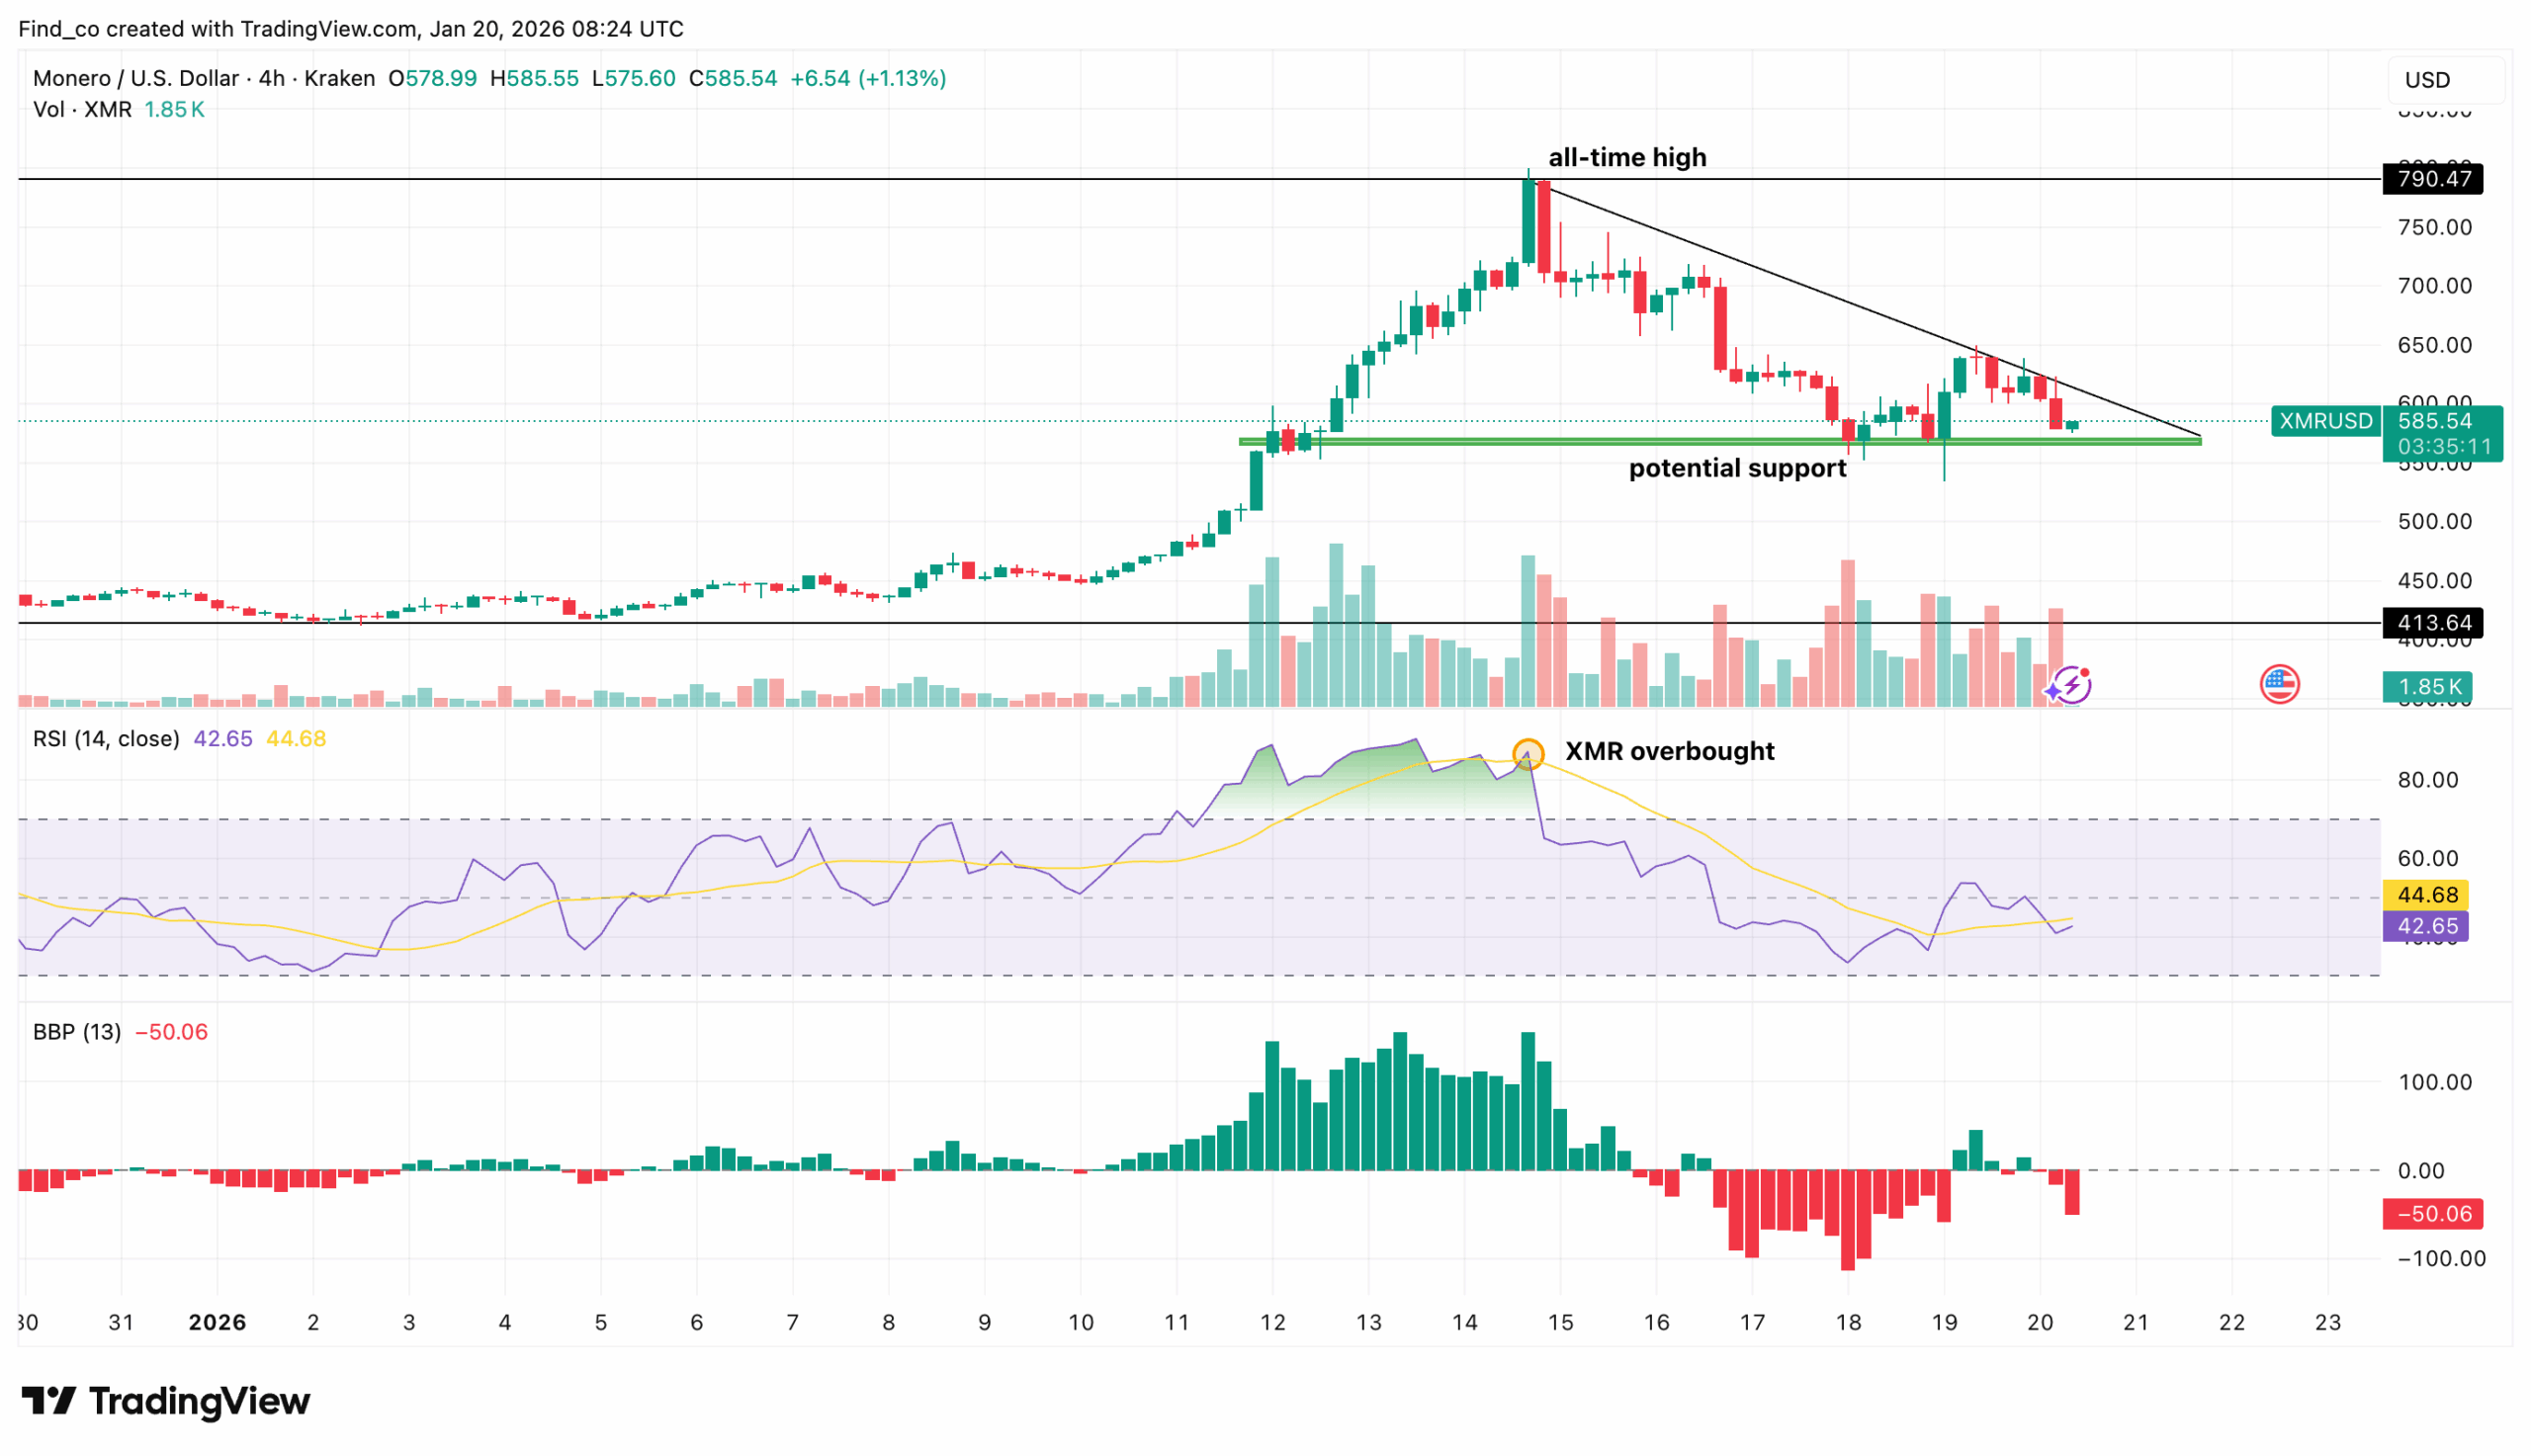
First, momentum overheated. As seen below, the Relative Strength Index (RSI) surged into extreme territory during the run, and that kind of heat rarely holds for long without a shakeout.
Next, $800 acted like a psychological wall, so early buyers used the spike to take profit.
Then came the headline risk. Dubai’s regulators moved to restrict privacy coins, reminding the market that access can vanish quickly, even when demand is strong.
Due to this move, XMR’s price struggled to breach the overhead resistance near $790.47
Now the chart looks like a tug-of-war, not a trend. Specifically, the altcoin has now formed a descending triangle.
However, there seems to be strong support around $564.62.
Thus, bulls still have a case, but they need time. As it stands, XMR buyers must defend this lower support band and absorb lingering sell pressure.
Meanwhile, sellers keep leaning on overhead zones that previously triggered distribution. That’s why XMR can feel “stuck” even after the massive rally.
Notably, the altcoin’s price is not weak. However, it seems to be in a healthy corrective phase.
Therefore, if XMR’s price holds its floor and volatility continues to compress, the “boring” range could actually become the base for the next impulse.
However, if it loses key support, the market will likely treat the whole move as a blow-off top and reset expectations for weeks, not days.
Furthermore, the XMR liquidation levels offer extra insight into what could be next for the coin.
Liquidation Heatmap Signals Volatility
Notably, the liquidation levels explain where leveraged traders are most vulnerable. The horizontal bands represent price zones where a large number of long or short positions would be forced to close if the price trades there.
The brighter and denser the band, the more liquidity is stacked at that level, which increases the probability that the price reacts to it.
On this chart, the green and cyan zones above XMR’s price represent areas where short positions would be liquidated. These zones act like upside-down liquidity magnets.
In this case, there is a heavy concentration of short-side liquidity between roughly $620 and $660, with another, thinner pocket closer to $ 680. This suggests that if XMR’s price starts reclaiming the $600 to $610 area with momentum, it could be pulled higher toward those zones relatively quickly.
The red and orange zones below the price represent long liquidation levels. These are areas where overleveraged long positions would be forced to sell if the price drops.
The chart shows a very dense cluster of long liquidations between roughly $560 and $580. In fact, there is even a deeper pocket closer to $530. This means that if XMR’s price falls below the current support region near $580, downside pressure could accelerate.
The current price is around $588, placing XMR directly between two major liquidity pools.
Right now, downside liquidity below $580 looks stronger than the upside liquidity above $620, which slightly favors a downside sweep if support fails.
However, structure also matters. If XMR’s price holds above the 580 area and buyers step in aggressively, the downside liquidity remains untouched.
In that scenario, the market may instead rotate upward to hunt short liquidations above $620. This could potentially lead to a fast squeeze higher.
XMR Price Prediction
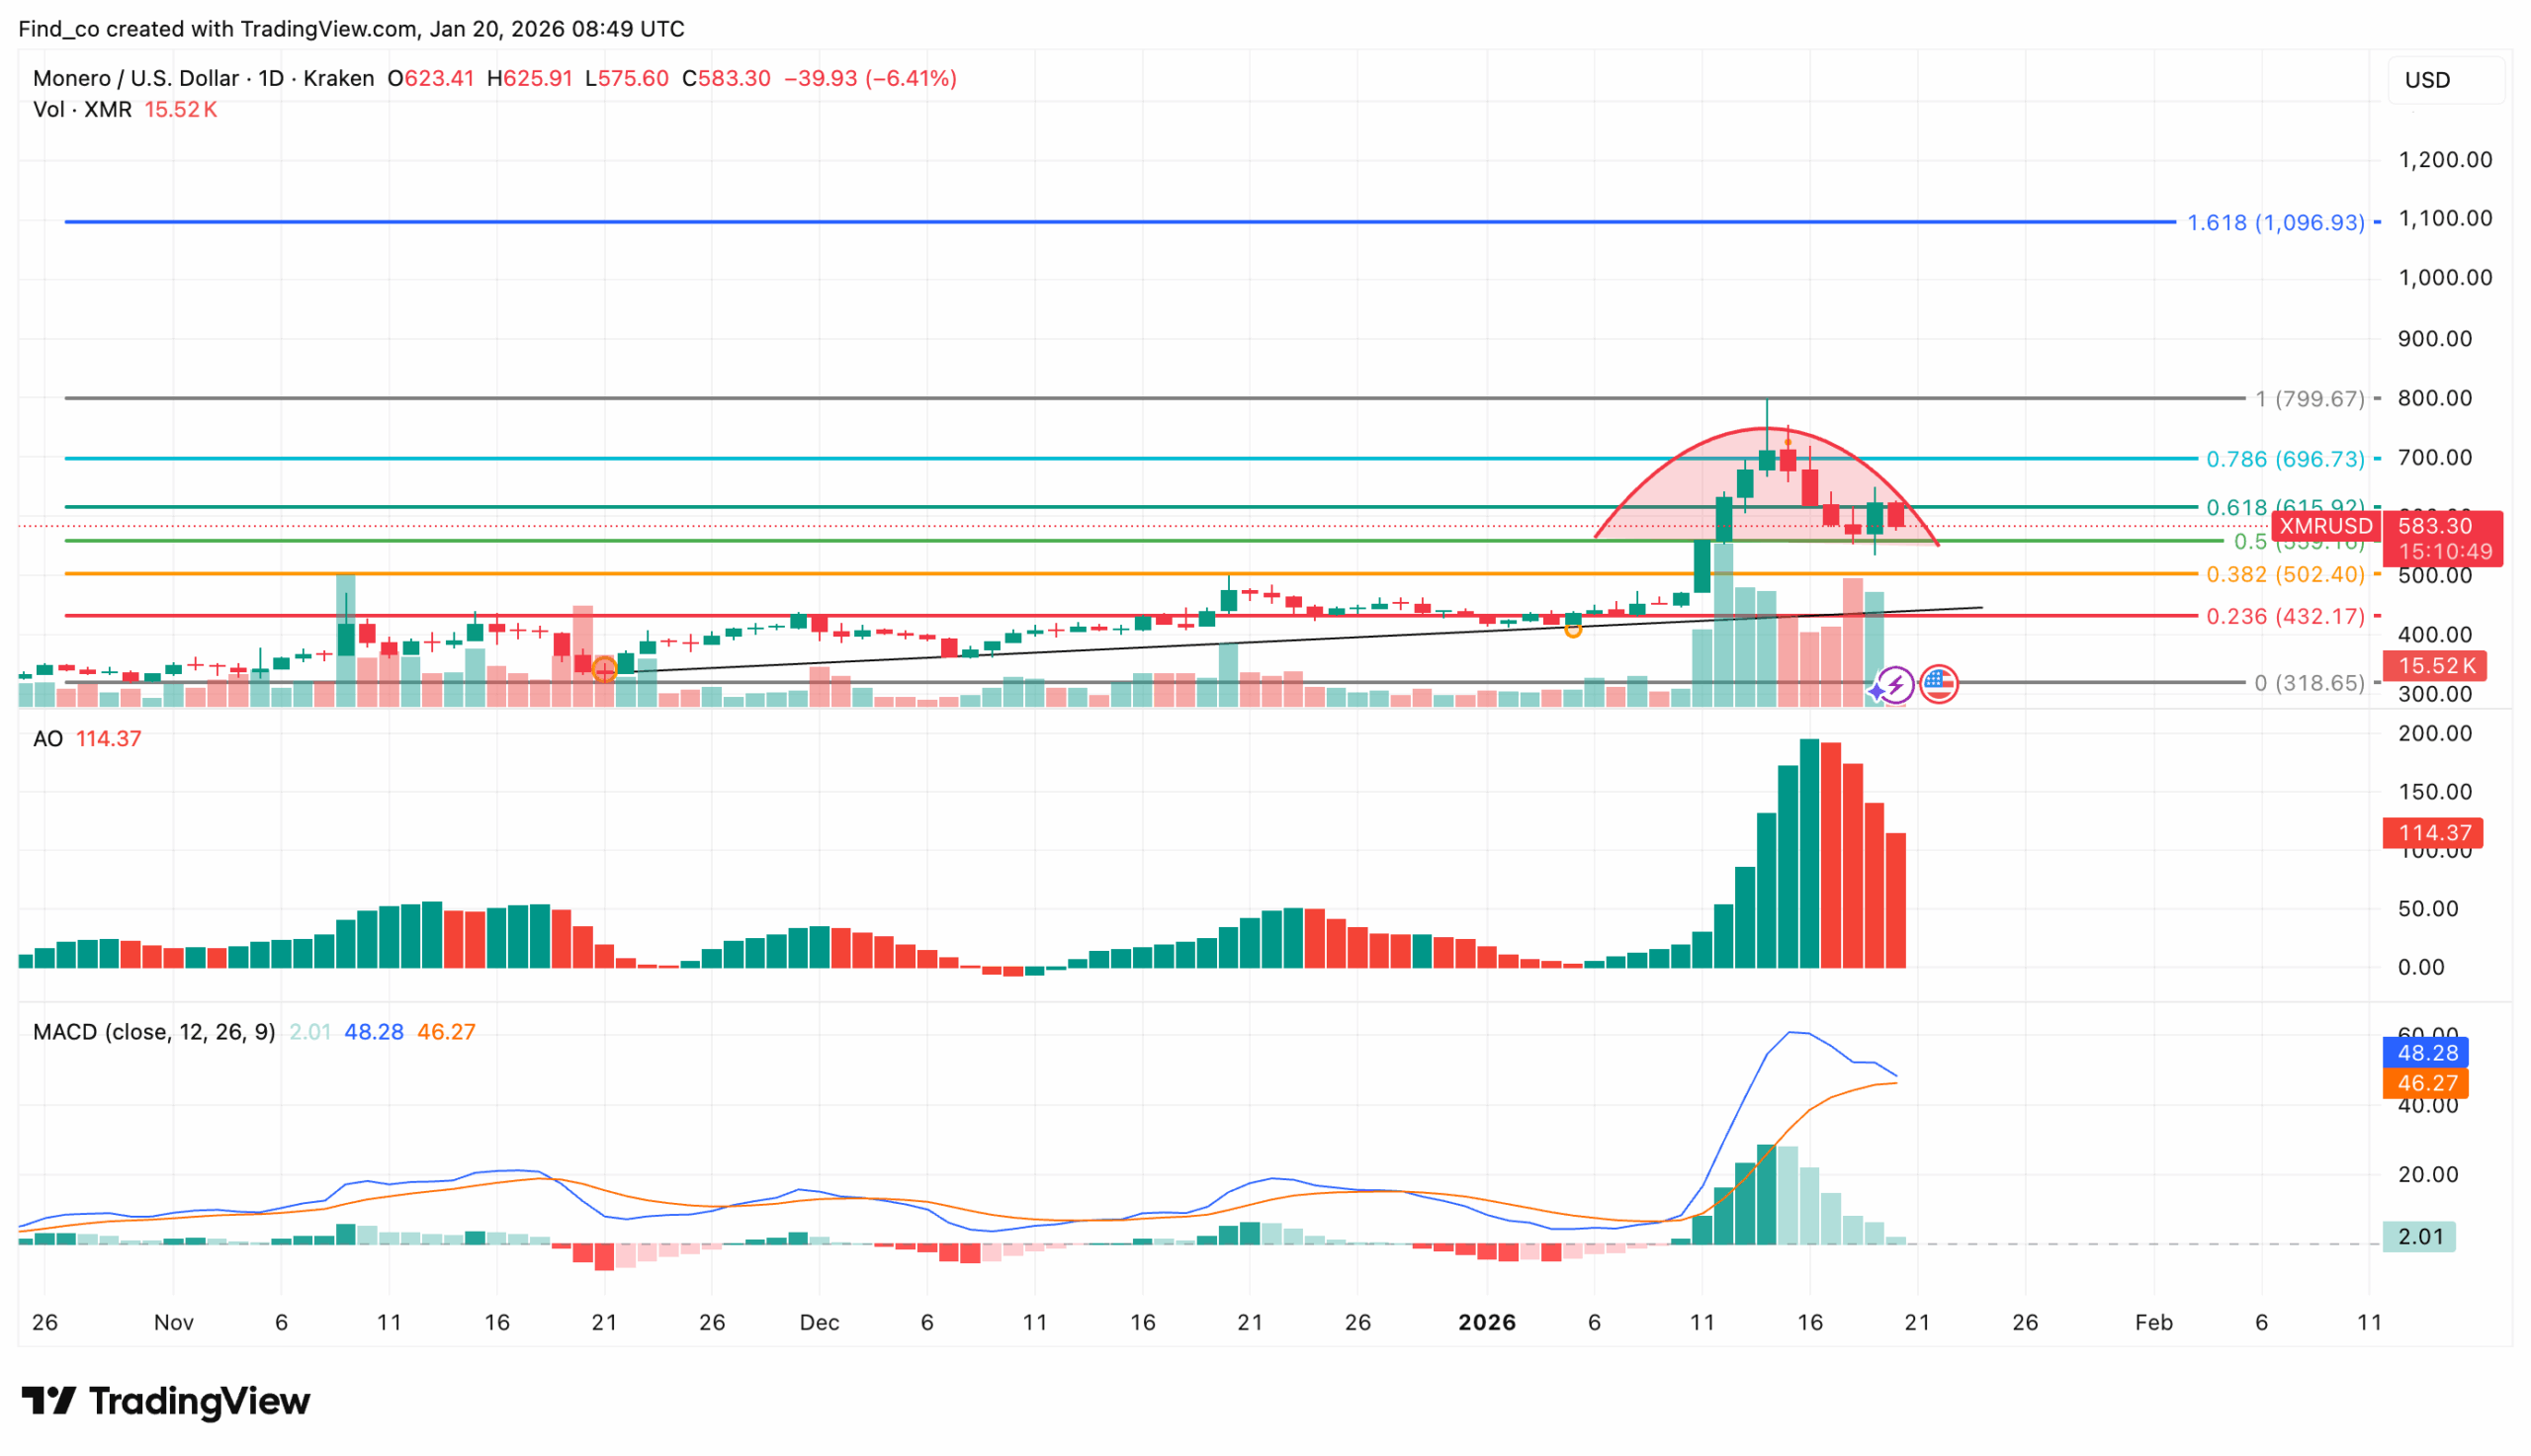
From a technical perspective, Monero trades near $583 on the daily chart after a rejection at the recent high near $800.
As seen below, the price rallied aggressively earlier in January, but that move stalled right below the 0.786 Fibonacci retracement around $697.
The rounded topping structure drawn on the chart reflects a loss of momentum rather than a trend continuation. If sustained, the subsequent selloff could lead buyers to fail to defend higher prices.
The pullback has now pushed XMR’s price back into a critical zone. As of this writing, the price is sitting between the 0.5 retracement near $536 and the 0.618 level around $613.
Furthermore, the failure to hold above the 0.618 level already tilts the short-term bias toward further downside unless buyers react quickly.
In addition, selling volume expanded notably during the drop, suggesting distribution rather than a low-liquidity dip.
At the same time, the Awesome Oscillator (AO) has rolled over from an elevated level. This signals that upside momentum has fully unwound.
Like the AO, the Moving Average Convergence Divergence (MACD) also shows a bearish turn, with momentum fading after the recent spike.
Structurally, the market still sits above the longer-term rising trendline and the 0.382 retracement near $502, which remains the most important medium-term support.
By the look of things, this could force XMR’s price down to $432.17.
However, as long as the price stays above the 0.382 Fib level, the broader uptrend from late 2025 will remain technically intact.
If that is the case, XMR might rebound to $799.67. If bullish momentum in privacy coins accelerates, it could rise to $1,096.93, a new all-time high.
Disclaimer:
The information provided in this article is for informational purposes only. It is not intended to be, nor should it be construed as, financial advice. We do not make any warranties regarding the completeness, reliability, or accuracy of this information. All investments involve risk, and past performance does not guarantee future results. We recommend consulting a financial advisor before making any investment decisions.
Victor Olanrewaju is a crypto analyst and reporter at CCN with deep roots in on-chain research and technical analysis. His crypto journey began in 2017, but it was the 2020 Uniswap airdrop that sparked a full-time pivot into the space.
With a foundation in copywriting, Victor honed his craft creating high-converting content for leading crypto brokers — most notably an XRP price prediction that ranked #1 on Google during the 2021 bull run.
He later joined AMBCrypto in 2022, where he combined storytelling with technical and on-chain analysis to cover key market narratives.
In 2024, he expanded his expertise at BeInCrypto, collaborating with analysts and using tools like Glassnode, Santiment, and IntoTheBlock to break down Bitcoin and altcoin trends.
At CCN, Victor covers the top cryptocurrencies, memecoins, macro shifts, blending real-time insights with deep-dive metrics.
He holds a Bachelor’s degree in Physics from the University of Ibadan, equipping him to simplify complex data for a wide audience. Follow his work or connect on LinkedIn or X.