Meet the Top 101 in Crypto

Monero Nears Critical $420 Resistance — Is an XMR All-Time High Finally Coming?

Published 18 December 2025
Valdrin Tahiri
Authors
Edited by Ryan James
Key Takeaways
  • Monero (XMR) trades inside the $420 horizontal resistance area.
  • The XMR price has outperformed the rest of the crypto market.
  • Can XMR sustain its increase and reach a new all-time high price?

Monero is quietly outperforming the broader crypto market, and traders are starting to take notice.

While most major altcoins struggle to regain momentum, XMR is pressing against a resistance level that has capped its price for nearly eight years.

With Monero now trading near the crucial $420 zone, the market is split.

A clean breakout could open the door to a new all-time high, but warning signs in momentum indicators suggest the rally may be losing steam.

The next move could define Monero’s trend for months.

XMR Price Analysis

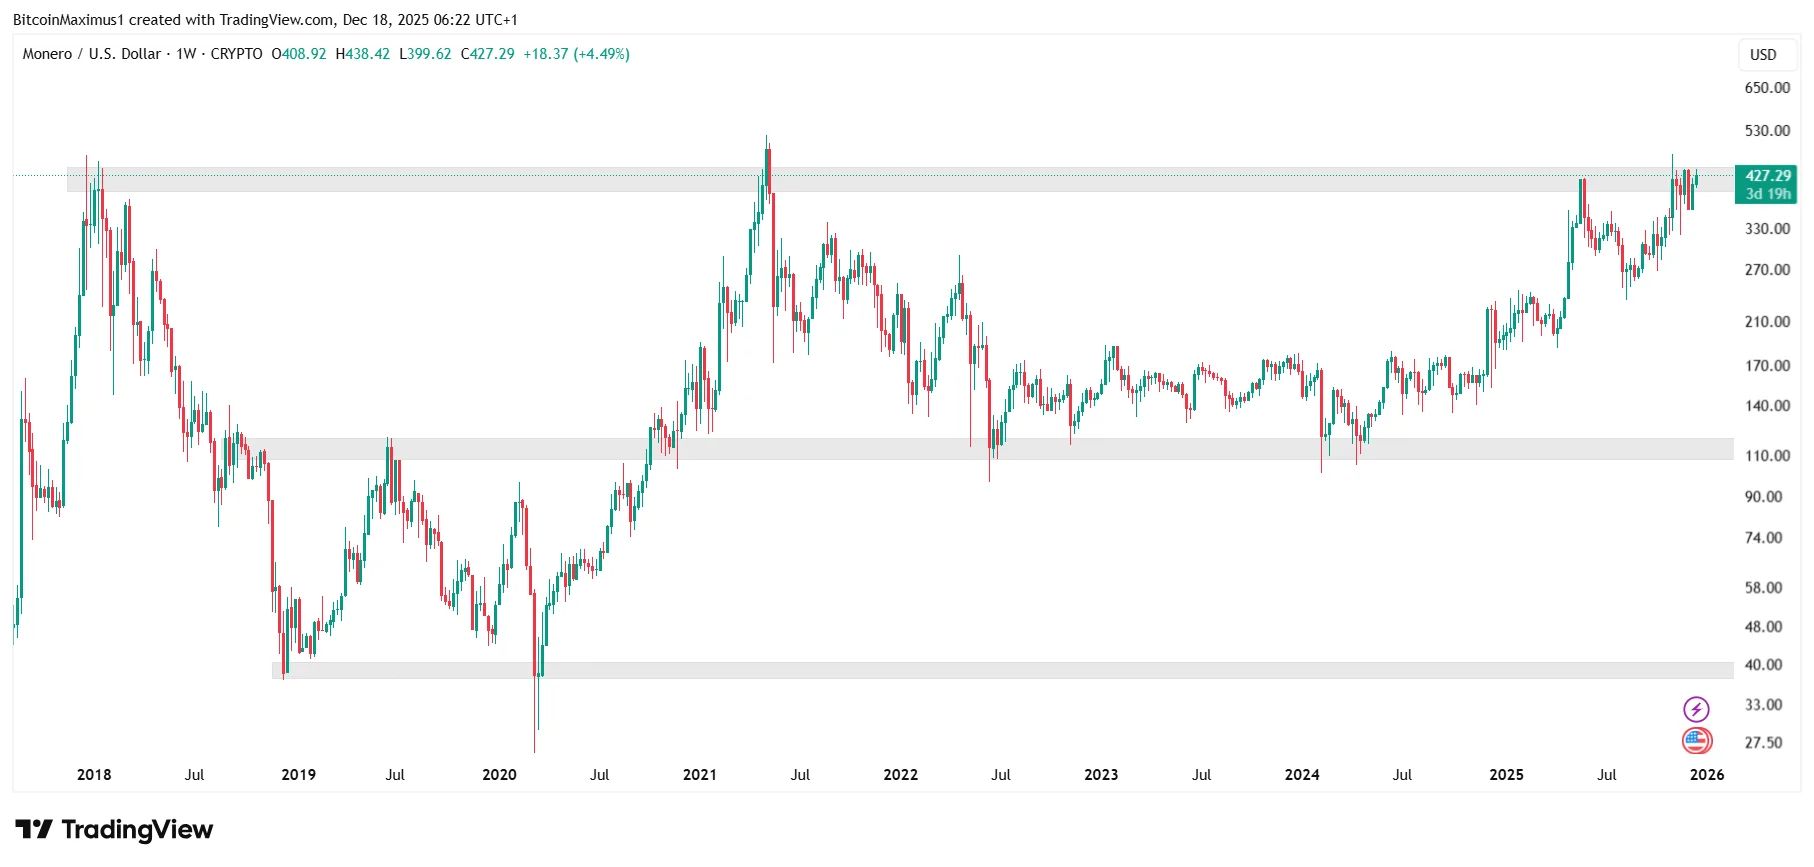
The weekly XMR chart indicates that the price is trading within the $420 horizontal resistance area.

This is the final resistance area before the all-time high of $517.60, reached in 2021.

Interestingly, the XMR price has never closed below this area.

XMR Weekly Chart
XMR/USDT Weekly Chart | Credit: Valdrin Tahiri/TradingView

The resistance has been in place since November 2017, and the XMR price has been unable to sustain it, even during its all-time high.

XMR has outperformed the rest of the crypto market and is very close to a new yearly high.

Therefore, traders are closely watching the $420 resistance area, as if XMR closes above it, it could surge to new highs quickly.

Can XMR Reach a New All-Time High Price?

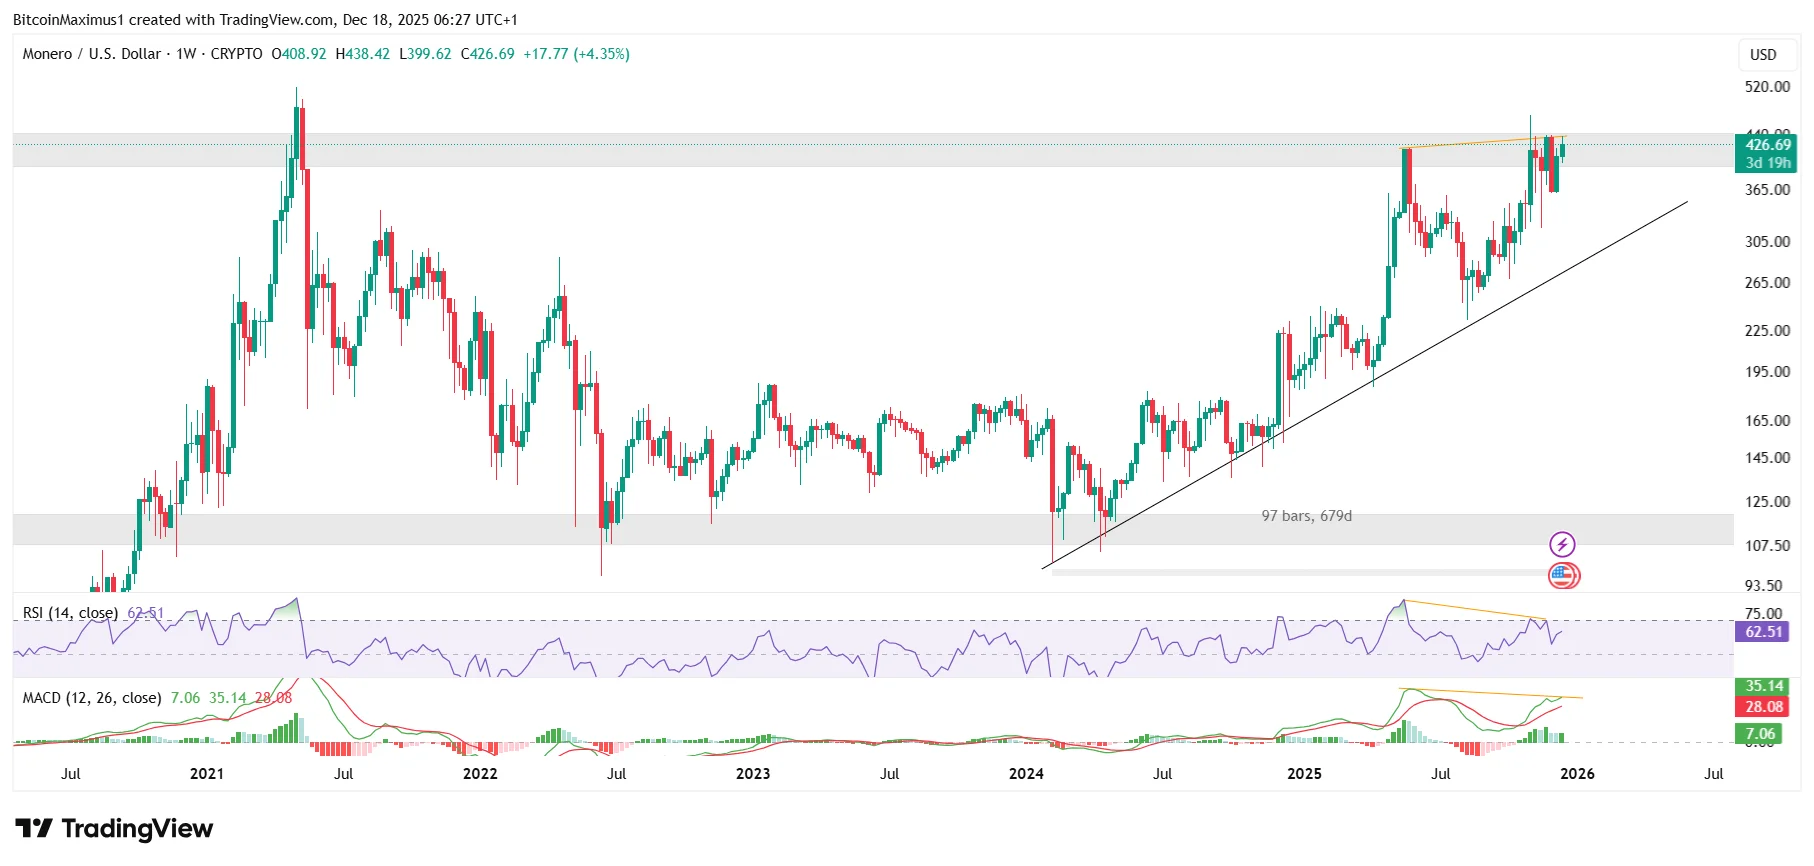
While the price action is positive, momentum indicators paint a worrying picture.

  • The Relative Strength Index (RSI) has generated a bearish divergence.
  • The Moving Average Convergence/Divergence (MACD) has done the same.

These divergences are evident in the weekly time frame, which could signal a long-term bearish trend reversal.

XMR Weekly Chart
XMR/USDT Weekly Chart | Credit: Valdrin Tahiri/TradingView

If they play out, the XMR price could initiate a bearish trend reversal, resulting in a breakdown below its 680-day support.

However, as long as the diagonal support trend line exists, the trend of higher highs is intact.

Bulls are still in control, and a breakout above $420 could trigger a parabolic rally.

Short-Term XMR Price Prediction

Finally, the daily XMR price analysis confirms that bears are in control.

This is because the entire bounce since August resembles a corrective structure.

XMR has gradually increased within an ascending parallel channel, indicating that the trend is not impulsive.

Additionally, the XMR price was rejected by the channel’s midline (represented by the red icon).

XMR Channel
XMR/USDT Daily Chart | Credit: Valdrin Tahiri/TradingView

As long as it trades in its lower portion, a downward trend is likely.

The short-term XMR prediction is that a 13% price decrease is expected to follow.

Afterward, the reaction there will determine if the long-term trend is bullish or bearish.

Uncertain Trend Ahead

Monero is currently positioned at one of the most significant technical levels in its entire history.

A decisive close above $420 would invalidate years of resistance and potentially trigger a fast move toward new all-time highs.

However, bearish divergences on higher time frames and a corrective short-term structure suggest caution is still warranted.

If XMR fails to break out convincingly, a pullback could follow before the next significant move.

For now, all eyes remain on the $420 level, as it is likely to determine whether Monero’s strength continues or stalls.

Disclaimer: The information provided in this article is for informational purposes only. It is not intended to be, nor should it be construed as, financial advice. We do not make any warranties regarding the completeness, reliability, or accuracy of this information. All investments involve risk, and past performance does not guarantee future results. We recommend consulting a financial advisor before making any investment decisions.
Valdrin Tahiri

Valdrin Tahiri is a cryptocurrency analyst and reporter at CCN, specializing in technical analysis with a focus on Elliott Wave theory, on-chain metrics, and fundamental research. He brings over seven years of experience in the crypto space as both a trader and writer.

He discovered cryptocurrencies in 2017 while earning his MSc in Financial Markets at the Barcelona School of Economics, which sparked a deep interest in blockchain and market dynamics. Since then, he’s contributed to top crypto outlets like BeInCrypto and CoinGape.

Valdrin also served as Community Manager of BeInCrypto’s Telegram group for three years, helping grow it into one of the largest crypto communities worldwide. His expertise in market structure and price patterns allows him to break down complex trends into clear, actionable insights.

He’s published thousands of articles covering altcoins, Bitcoin cycles, and macro trends.

Related

Survey Icon
Help us improve
1 of 4
Is this your first time here?
What brought you here today?
What are you most interested in?
Would you be interested in:
Thank you icon
Thank you for your feedback!
DMCA.com Protection Status