Will Litecoin Break Down From its Long-Term Pattern? | Credit: Hameem Sarwar
Share
Key Takeaways
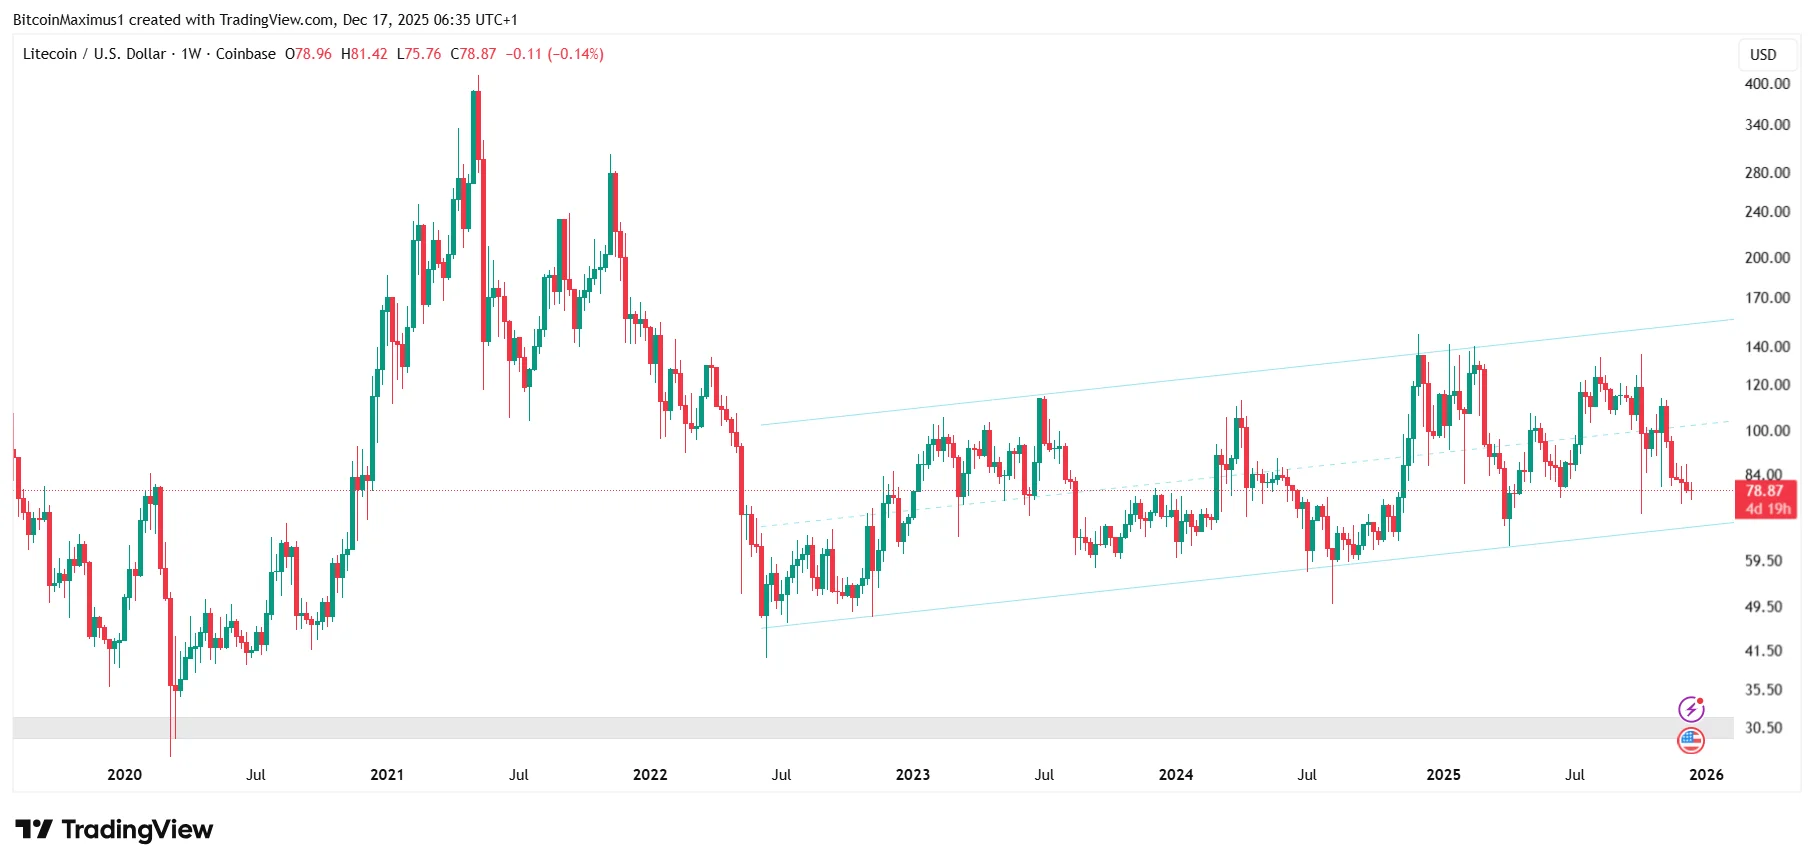
Litecoin (LTC) trades inside a long-term ascending parallel channel.
Litecoin’s entire price movement this cycle has been corrective.
Will Litecoin break down from the channel and crash to new lows?
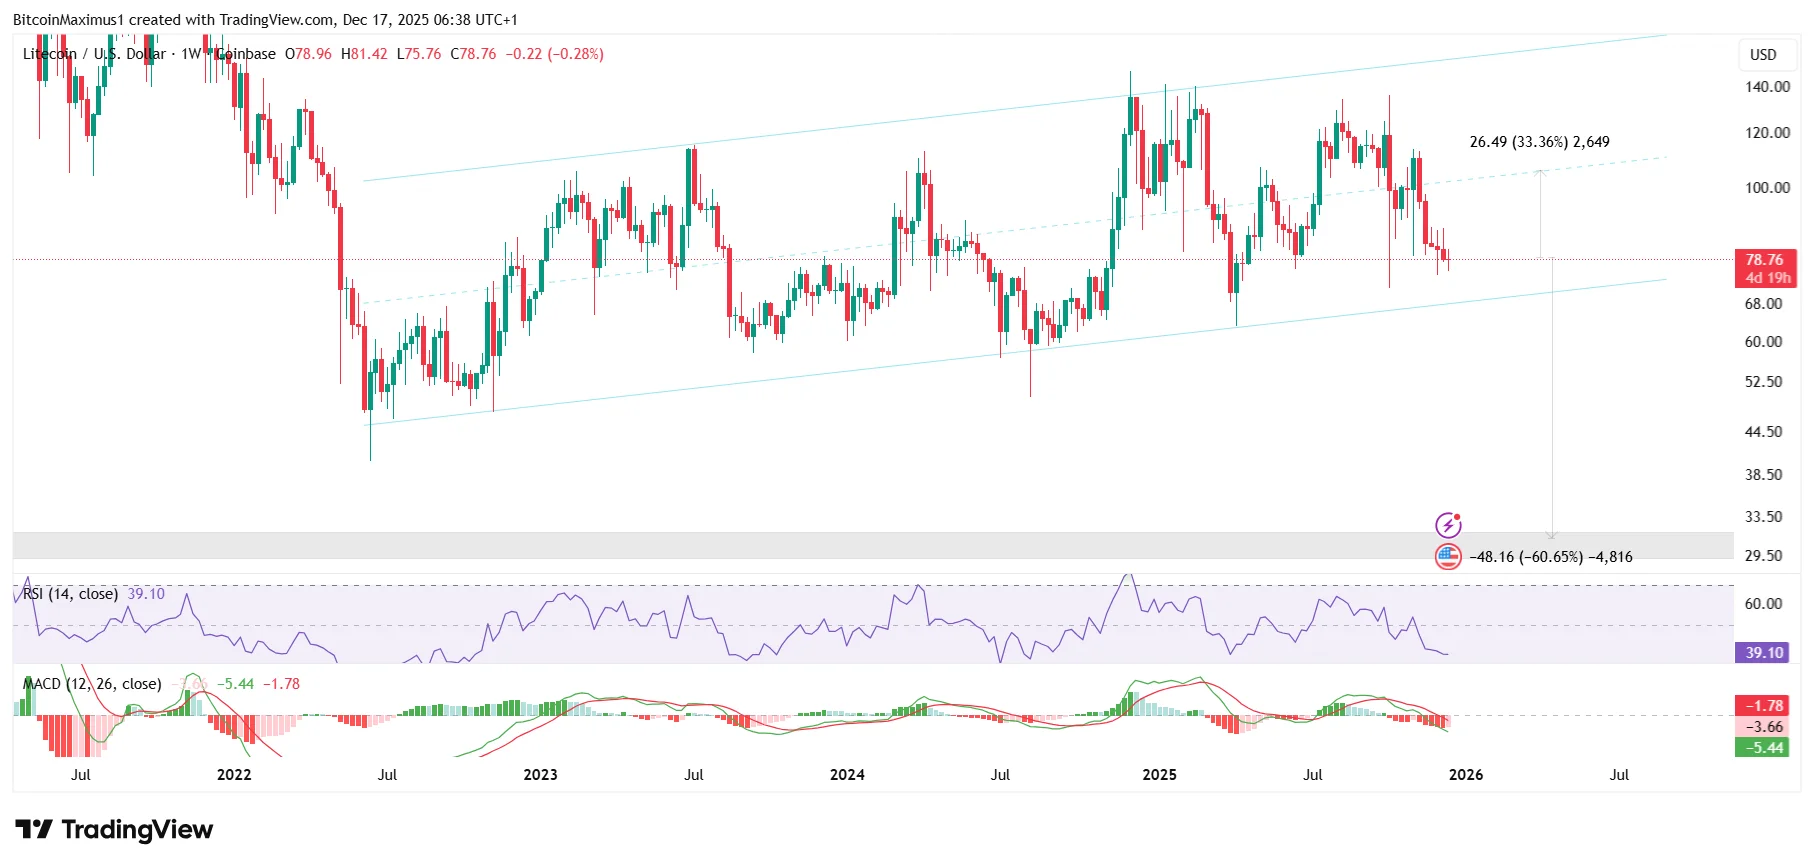
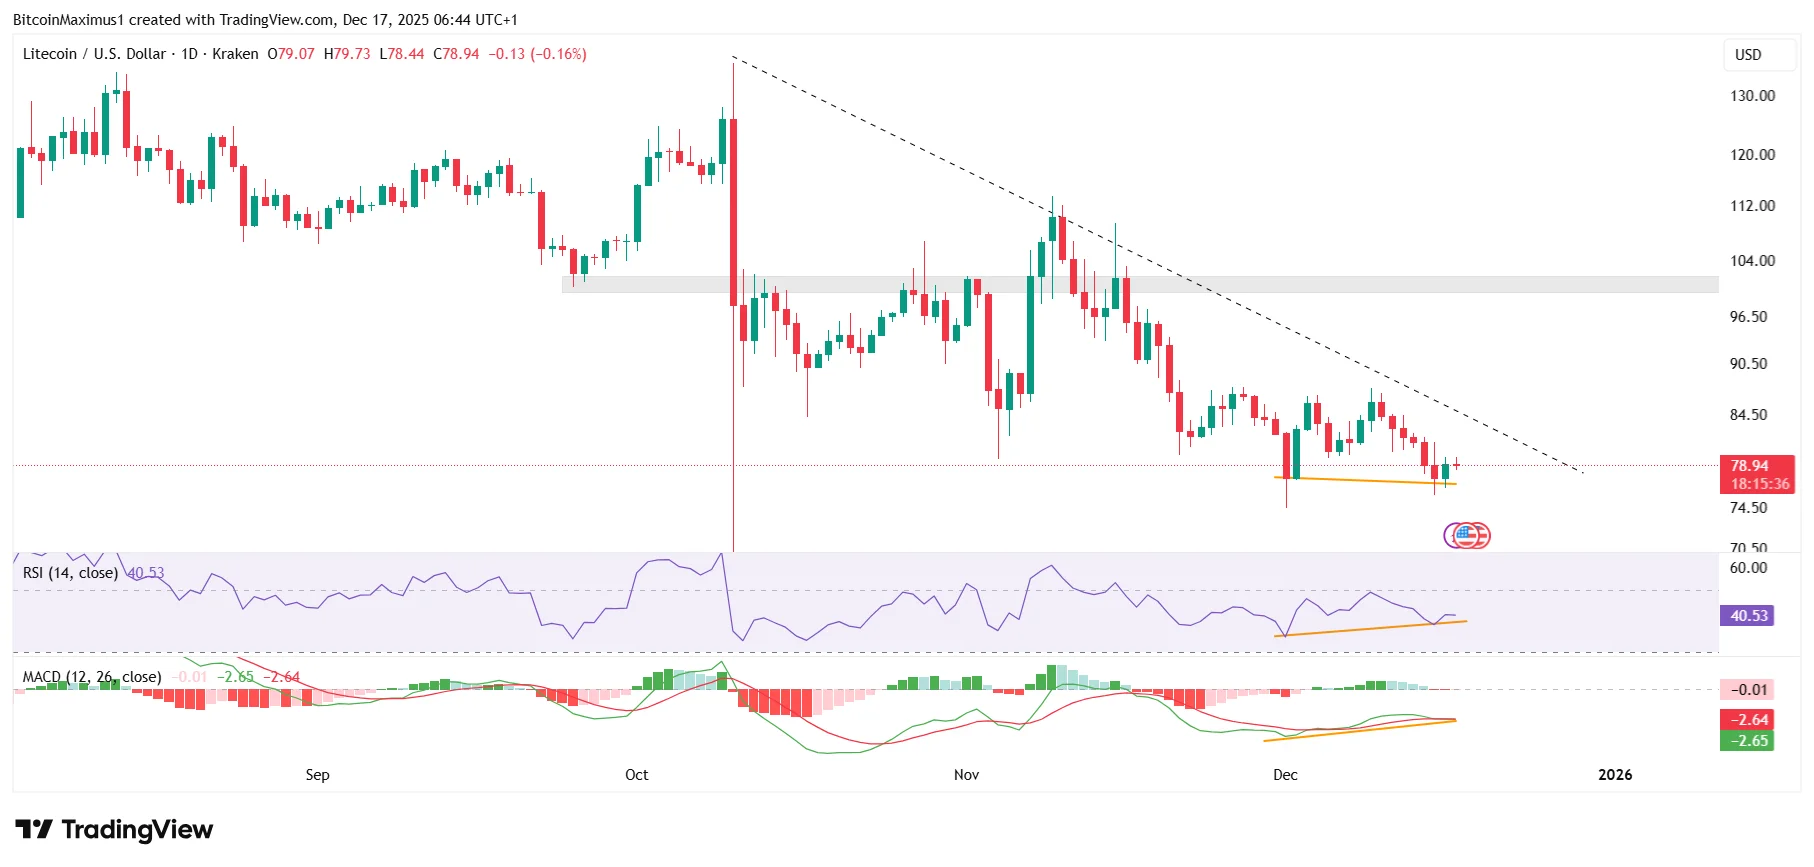
Litecoin is approaching a critical support level.
After nearly three years of grinding higher, LTC is now pressing against the lower boundary of its long-term price structure, raising serious questions about whether the entire rally is about to unravel.
So why is Litecoin’s price going down right now, and what happens if this key support finally snaps?
A short-term bounce is still possible, but the broader structure suggests the rally of the past three years is losing steam. If $70 breaks, downside risk increases dramatically.
Until Litecoin reclaims key resistance levels with conviction, the path of least resistance remains lower.
Valdrin Tahiri is a cryptocurrency analyst and reporter at CCN, specializing in technical analysis with a focus on Elliott Wave theory, on-chain metrics, and fundamental research. He brings over seven years of experience in the crypto space as both a trader and writer.
He discovered cryptocurrencies in 2017 while earning his MSc in Financial Markets at the Barcelona School of Economics, which sparked a deep interest in blockchain and market dynamics. Since then, he’s contributed to top crypto outlets like BeInCrypto and CoinGape.
Valdrin also served as Community Manager of BeInCrypto’s Telegram group for three years, helping grow it into one of the largest crypto communities worldwide. His expertise in market structure and price patterns allows him to break down complex trends into clear, actionable insights.
He’s published thousands of articles covering altcoins, Bitcoin cycles, and macro trends.