Will the VET Price Plunge to New Lows? | Credit: Hameem Sarwar
Share
Key Takeaways
VeChain (VET) broke down from an ascending trend line of support.
VeChain’s price might have completed an A-B-C corrective structure.
Has VET reached a bottom, or will the price continue to fall this year?
VeChain’s (VET) price action this cycle has been disappointing, since the token has struggled to hold its primary support levels.
Despite its lackluster price action, VeChain is trending due to its VeBetter program, which enables users to earn B3TR by completing sustainable actions.
Will this positive news be enough to cause a VeChain price bounce, or is the downward pressure too intense? Let’s examine the charts and figure out what’s next.
VET Technical Analysis
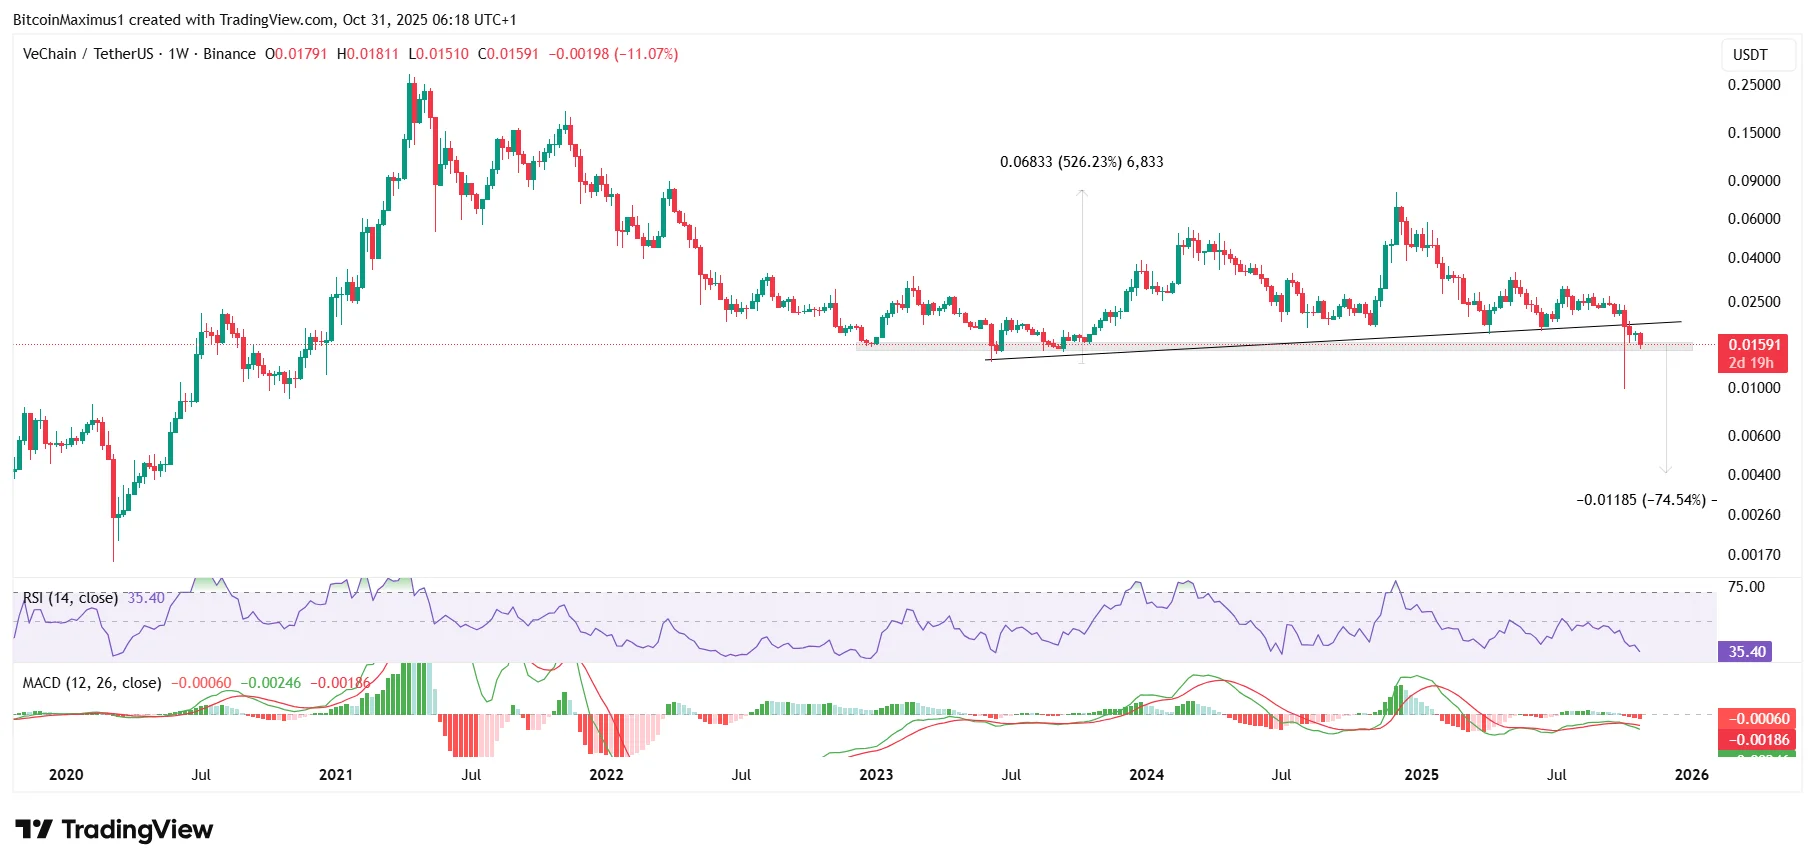
The VET price increased alongside an ascending support trend line in June 2023.
Its rally led to a high of $0.08 in December 2024, marking a surge of more than 500% since the lows.
However, that turned out to be the cycle high, as the VET price fell sharply from then on without experiencing any primary bounces.
Get These Top Crypto Casino Offers Now!
Sponsored
Disclosure
We sometimes use affiliate links in our content, when clicking on those we might receive a commission at no extra cost to you. By using this website you agree to our terms and conditions and privacy policy.
Momentum indicators suggest a breakdown is incoming. The Relative Strength Index (RSI) is below 50 while the Moving Average Convergence/Divergence (MACD) is negative.
Both are falling, and the MACD has made a bearish cross.
As a result, the VET prediction is bearish, and an eventual price breakdown followed by new lows awaits this year.
Can the VET Price Bounce?
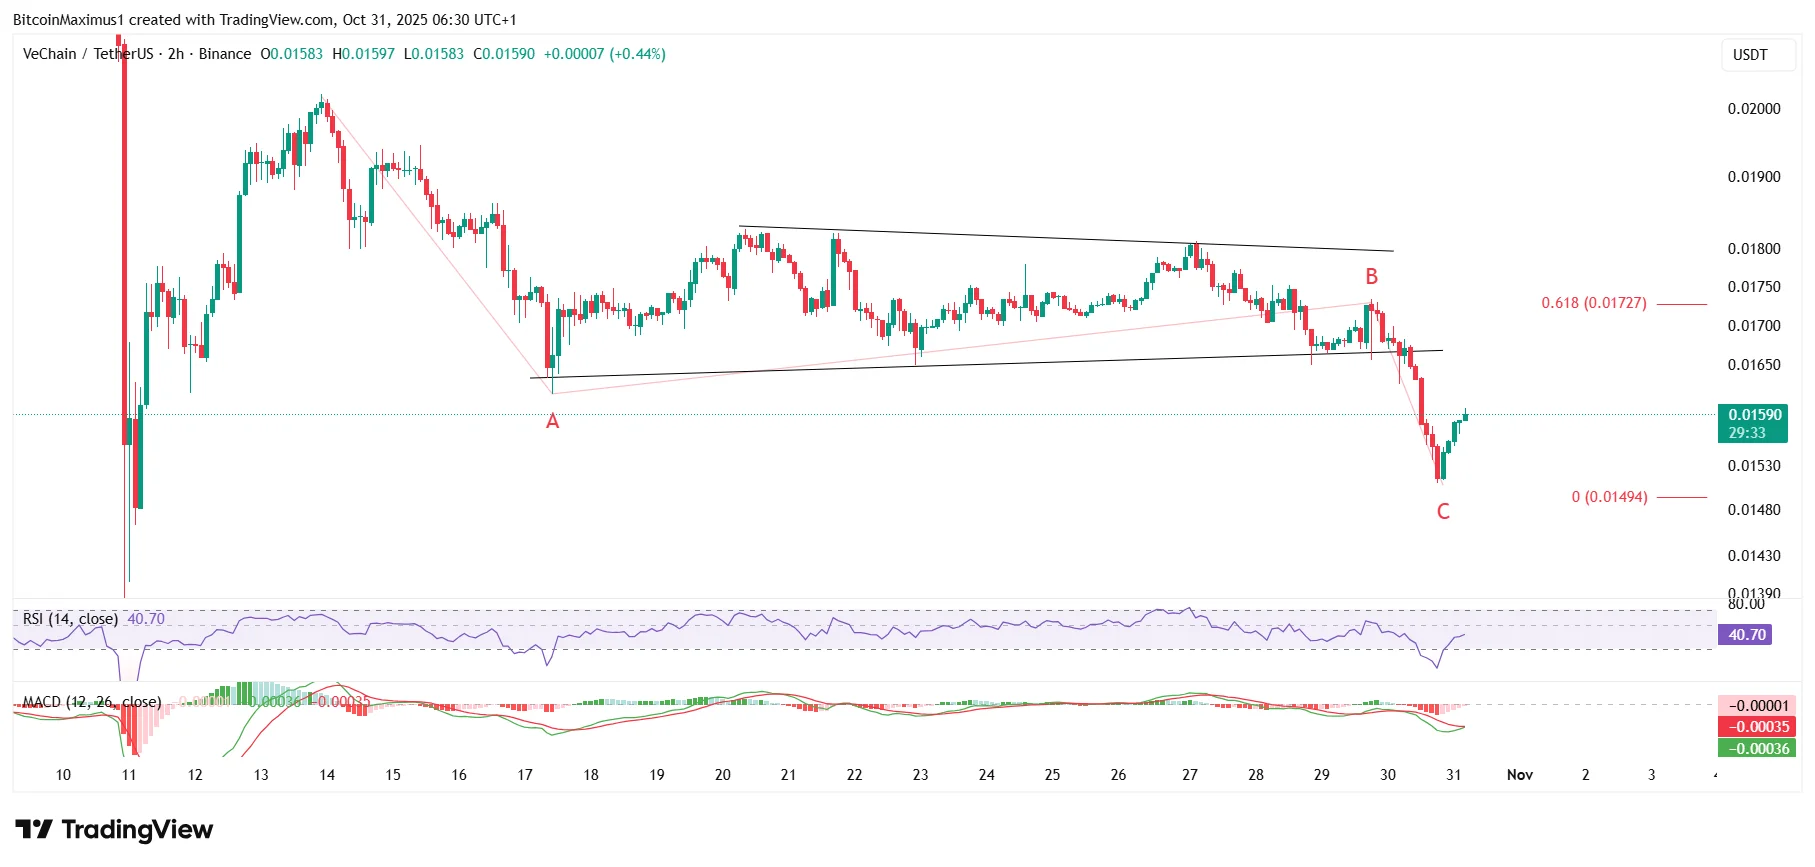
While the weekly time frame chart is decisively bearish, the two-hour one offers hope for a significant bounce.
The main reason for this is the wave count, which shows a completed A-B-C structure (red).
Wave B is a symmetrical triangle, while wave C is 0.618 times the length of wave A, confirming the count’s accuracy.
However, it is worth mentioning that momentum indicators have generated no bullish divergence, which is customary during price bottoms.
When combined with the bearish readings from the weekly time frame, the lack of a bullish divergence casts some doubt as to whether the price of VET has reached a bottom.
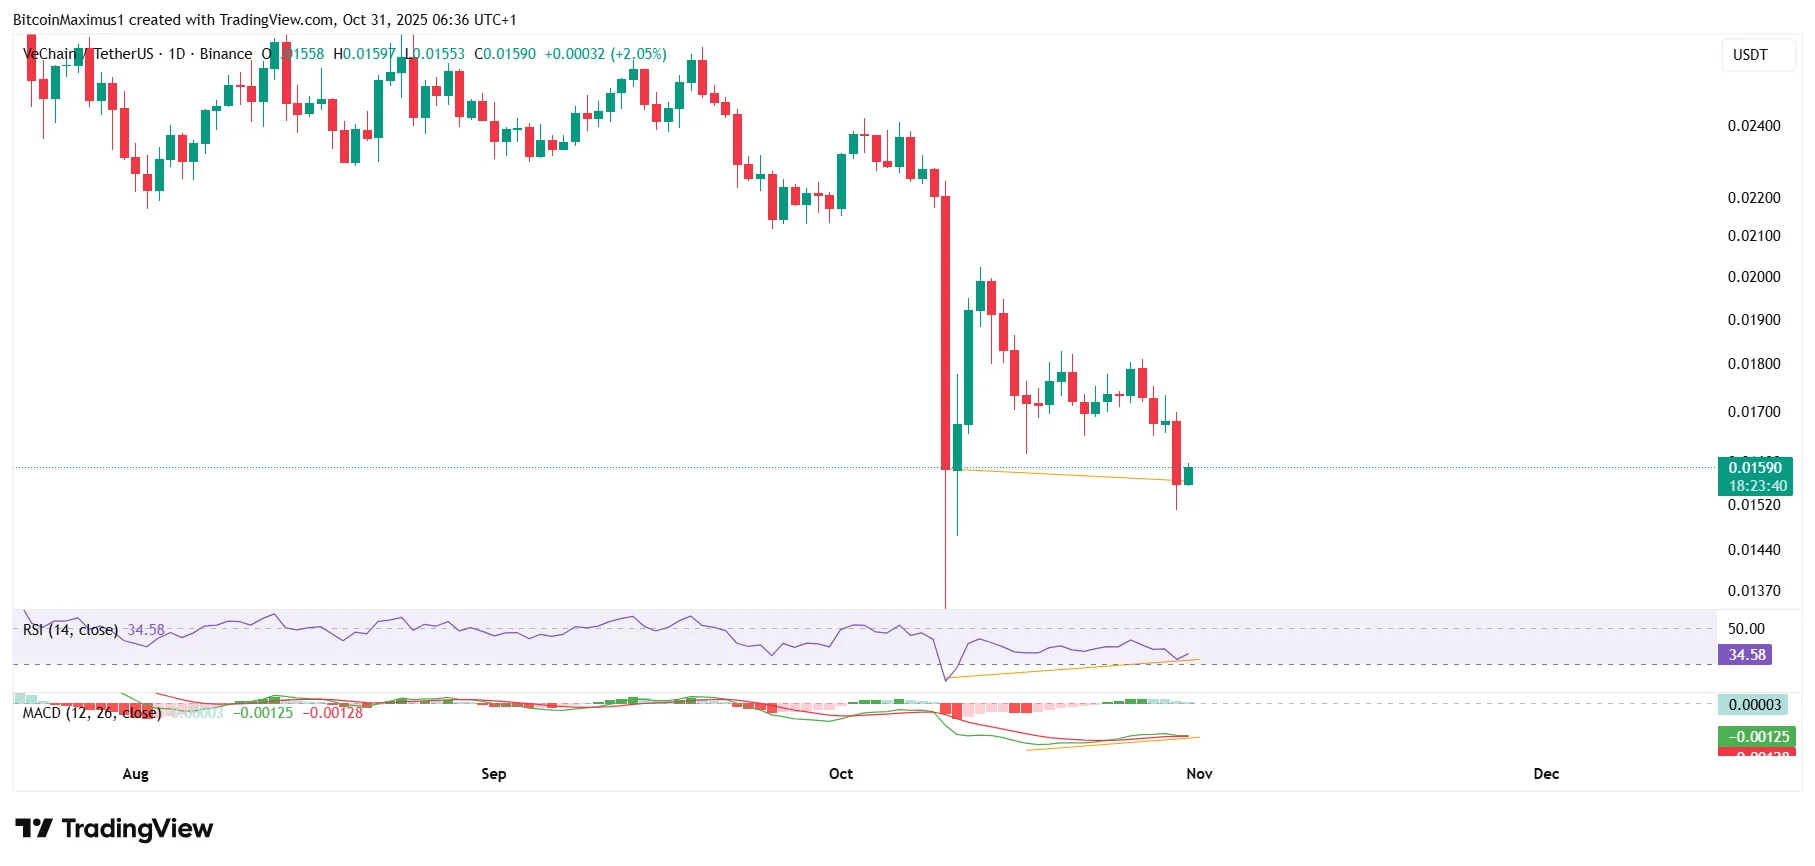
The main bullish sign comes from the bullish divergence (orange) in the daily time frame, which is created relative to the Oct. 11 price.
Disclaimer:
The information provided in this article is for informational purposes only. It is not intended to be, nor should it be construed as, financial advice. We do not make any warranties regarding the completeness, reliability, or accuracy of this information. All investments involve risk, and past performance does not guarantee future results. We recommend consulting a financial advisor before making any investment decisions.
Valdrin Tahiri is a cryptocurrency analyst and reporter at CCN, specializing in technical analysis with a focus on Elliott Wave theory, on-chain metrics, and fundamental research. He brings over seven years of experience in the crypto space as both a trader and writer.
He discovered cryptocurrencies in 2017 while earning his MSc in Financial Markets at the Barcelona School of Economics, which sparked a deep interest in blockchain and market dynamics. Since then, he’s contributed to top crypto outlets like BeInCrypto and CoinGape.
Valdrin also served as Community Manager of BeInCrypto’s Telegram group for three years, helping grow it into one of the largest crypto communities worldwide. His expertise in market structure and price patterns allows him to break down complex trends into clear, actionable insights.
He’s published thousands of articles covering altcoins, Bitcoin cycles, and macro trends.