LAB targets new all-time high following pullback | Credit: Hameem Sarwar
Share
Key Takeaways
LAB surged before dropping over 40%, but is now stabilizing with signs of rising bullish momentum.
Strong fundamentals, such as a low circulating supply and token burns, are supporting demand.
Holding above key support keeps the breakout intact, with potential for a move to a new all-time high.
LAB had a massive run in April, but the rally didn’t hold.
After surging roughly 1,500% in just 30 days, the token has pulled back sharply, dropping about 41% from its all-time high.
The move also triggered a spike in trading activity as momentum cooled.
Even so, while LAB remains well below its peak, current indicators suggest the rally may not be over just yet.
Here is why.
LAB Token Parabolic Move Meets Reality
The move in LAB was rapid.
At its peak, the token became one of the market’s most actively traded assets, posting $407 million in 24-hour volume against a market cap of about $504 million.
We sometimes use affiliate links in our content, when clicking on those we might receive a commission at no extra cost to you. By using this website you agree to our terms and conditions and privacy policy.
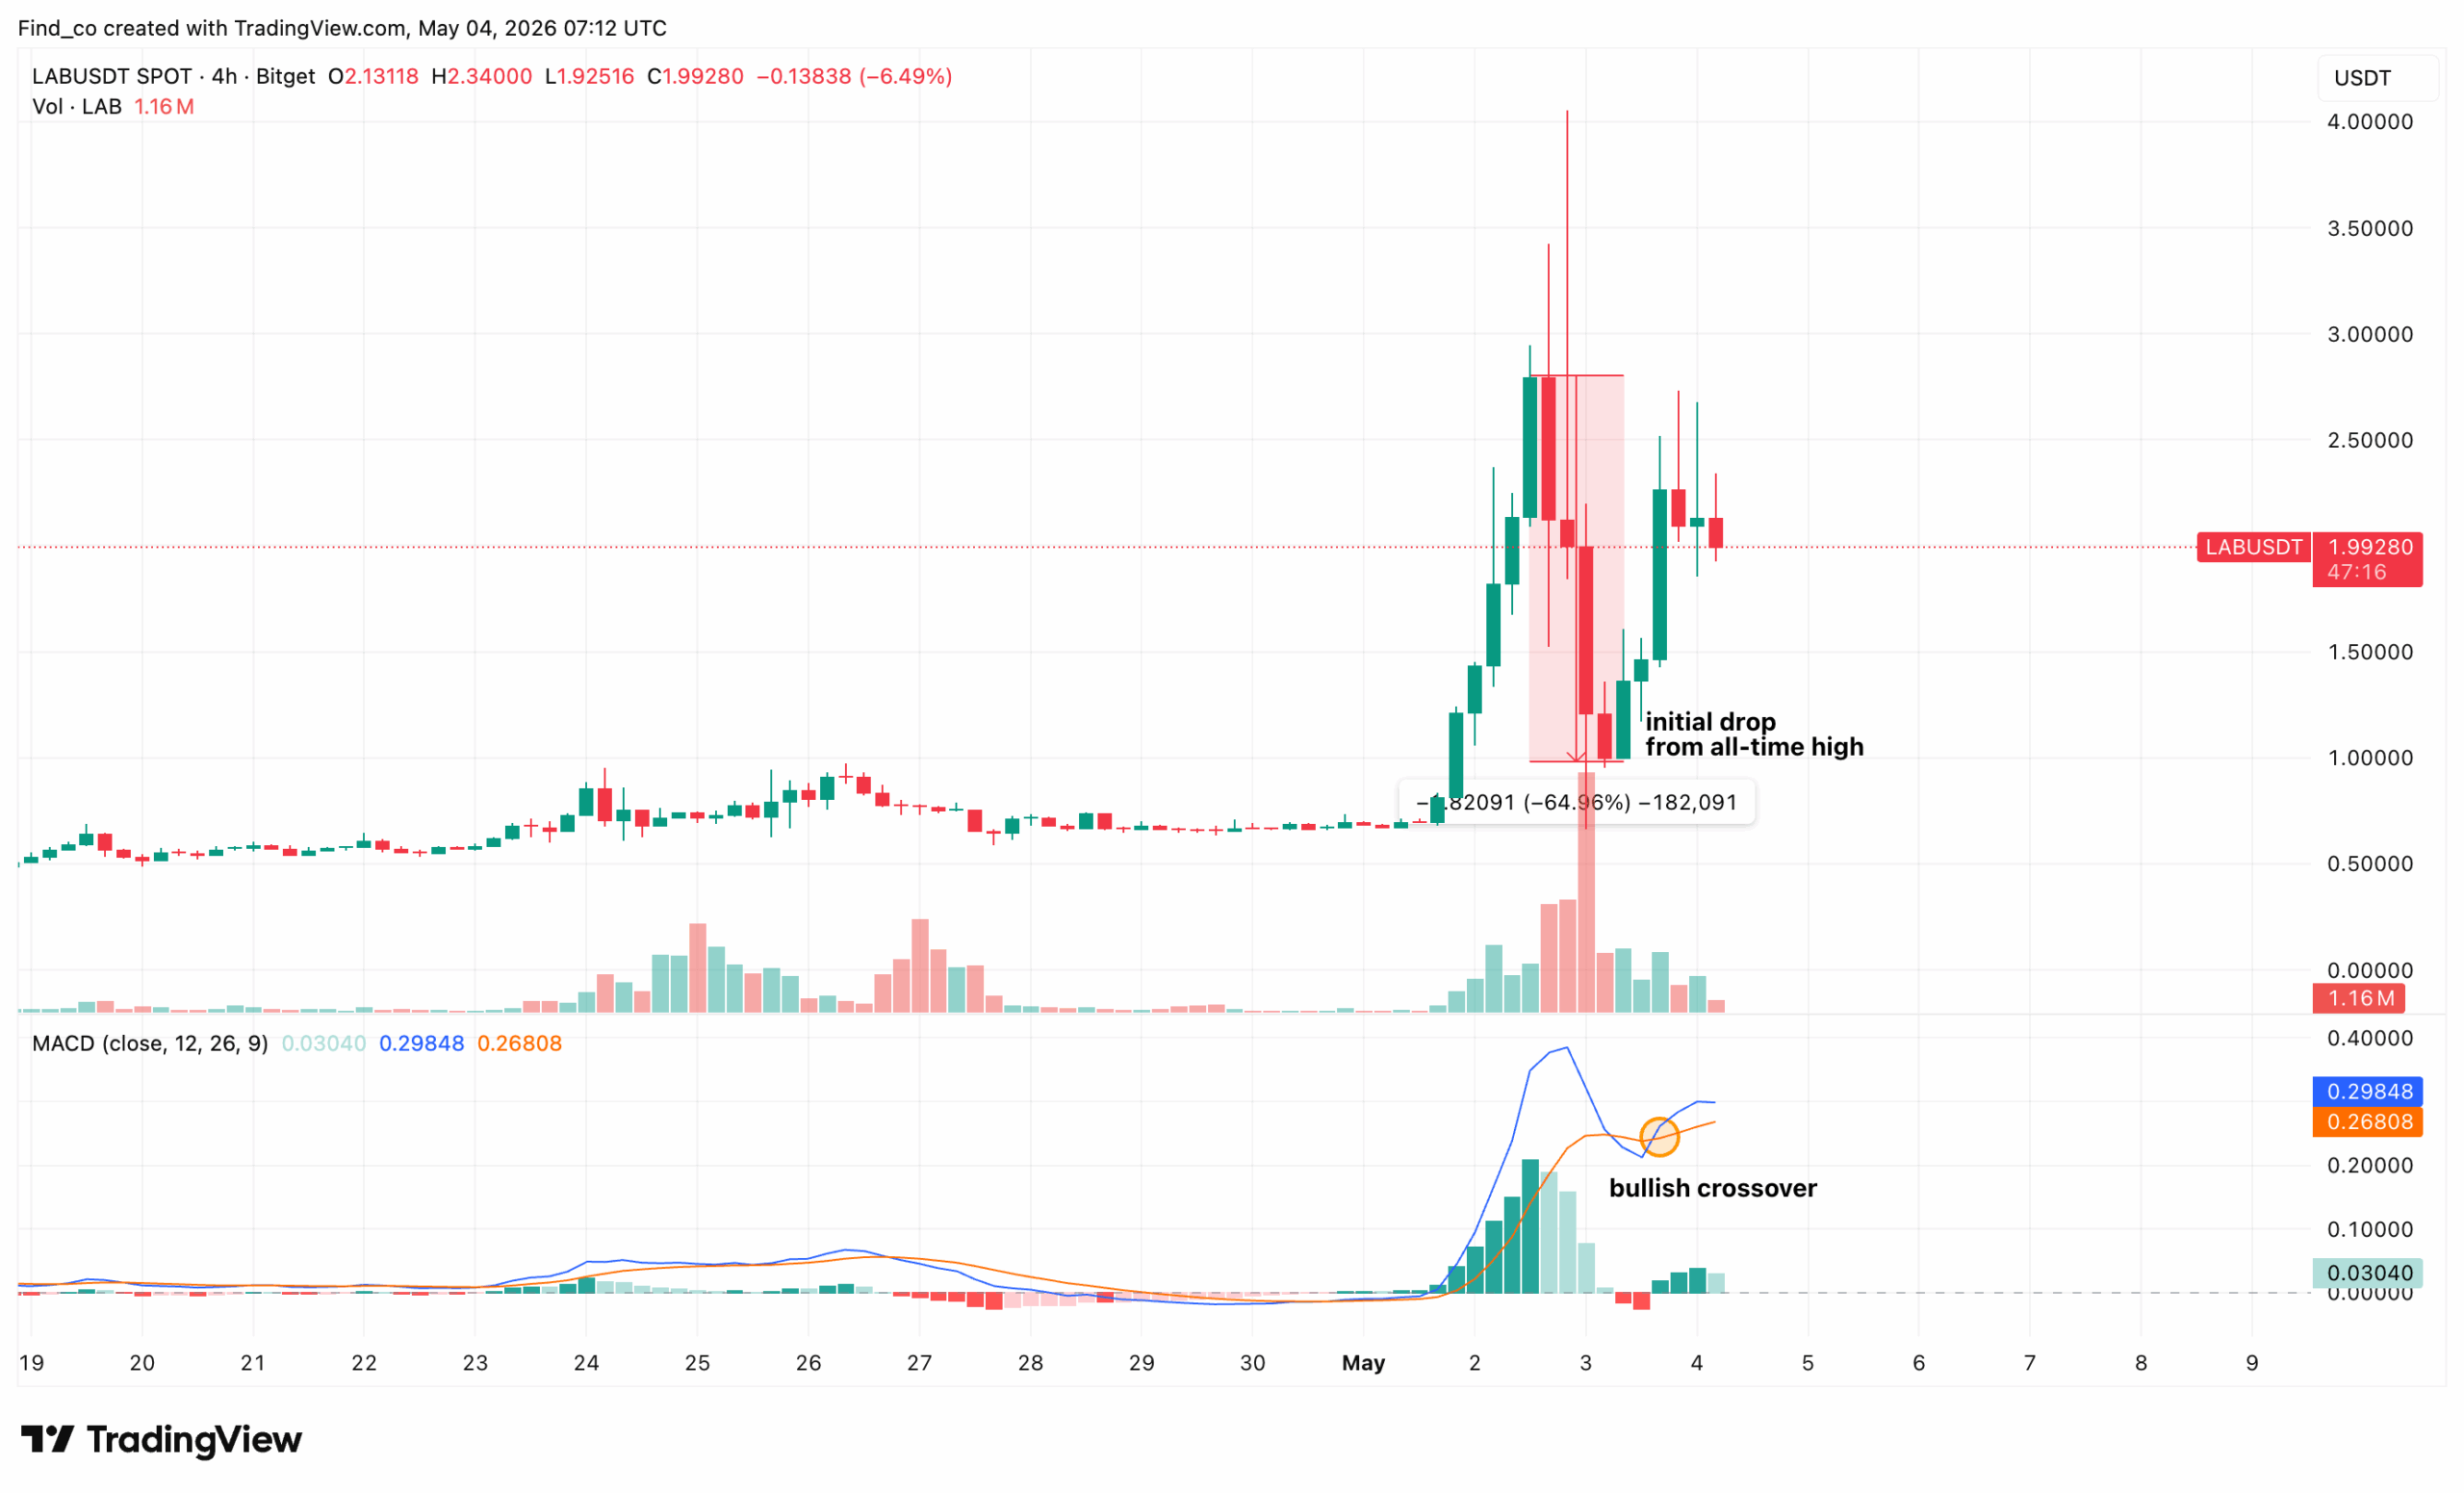
After topping out near $3.41, the price fell roughly 64% before finding support around $1. From there, it started to recover.
That rebound matters because it suggests buyers are stepping back in, helping form a higher low instead of allowing the sell-off to continue.
Momentum is also beginning to improve. A bullish MACD crossover signals easing selling pressure and suggests the correction may be losing strength.
For now, the key level to watch is $2. If LAB can stay above that zone, the structure remains constructive and could support a move back toward the $3 area, with the $2.8 to $3.0 range acting as the next major resistance.
If LAB’s price falls below this level, $1.0 could become the major support level.
What LAB Actually Is — And Why It Matters
For those unfamiliar, LAB isn’t just another speculative token. It powers a multi-chain trading terminal designed to unify DeFi activity across Ethereum, Solana, and BNB Chain.
Think of it as a Bloomberg Terminal for crypto traders.
Instead of switching between Uniswap, Raydium, or PancakeSwap, users can manage everything from a single interface.
But it goes deeper than that, as the platform also offers:
Limit orders and perpetual futures.
AI-powered trade routing to reduce slippage.
and a “Boost Mode” for near-instant execution.
The Tokenomics Is Driving Demand
The LAB token sits at the center of this system as holders benefit from:
Fee discounts through staking tiers.
Governance rights over platform decisions.
Access to Terminal Pro features and early-stage project launches.
But the most important element is the deflationary mechanism.
According to CCN’s findings, a portion of trading revenue is used to buy back and burn LAB tokens. That creates a supply squeeze over time.
Outside that, the recent rally wasn’t random. Three key catalysts triggered it.
First, the mobile app launched on May 3. This was a major milestone, expanding the platform from browser-only to mobile, opening the door to retail users.
Second, low circulating supply. At the time of writing, Only 23% of the 1 billion total supply is currently in circulation. That means demand hits a tight float, amplifying price moves.
Third, there is speculation of insider activity. Blockchain data shows that certain wallets realized profits of over $1.1 million during the rally.
While that has added momentum, it has also raised caution.
Amid all of that, LAB’s price pulled back. But at $2.19, the altcoin is still up 87% in the last 24 hours.
LAB Price Prediction
Despite the pullback, LAB’s price setup remains bullish.
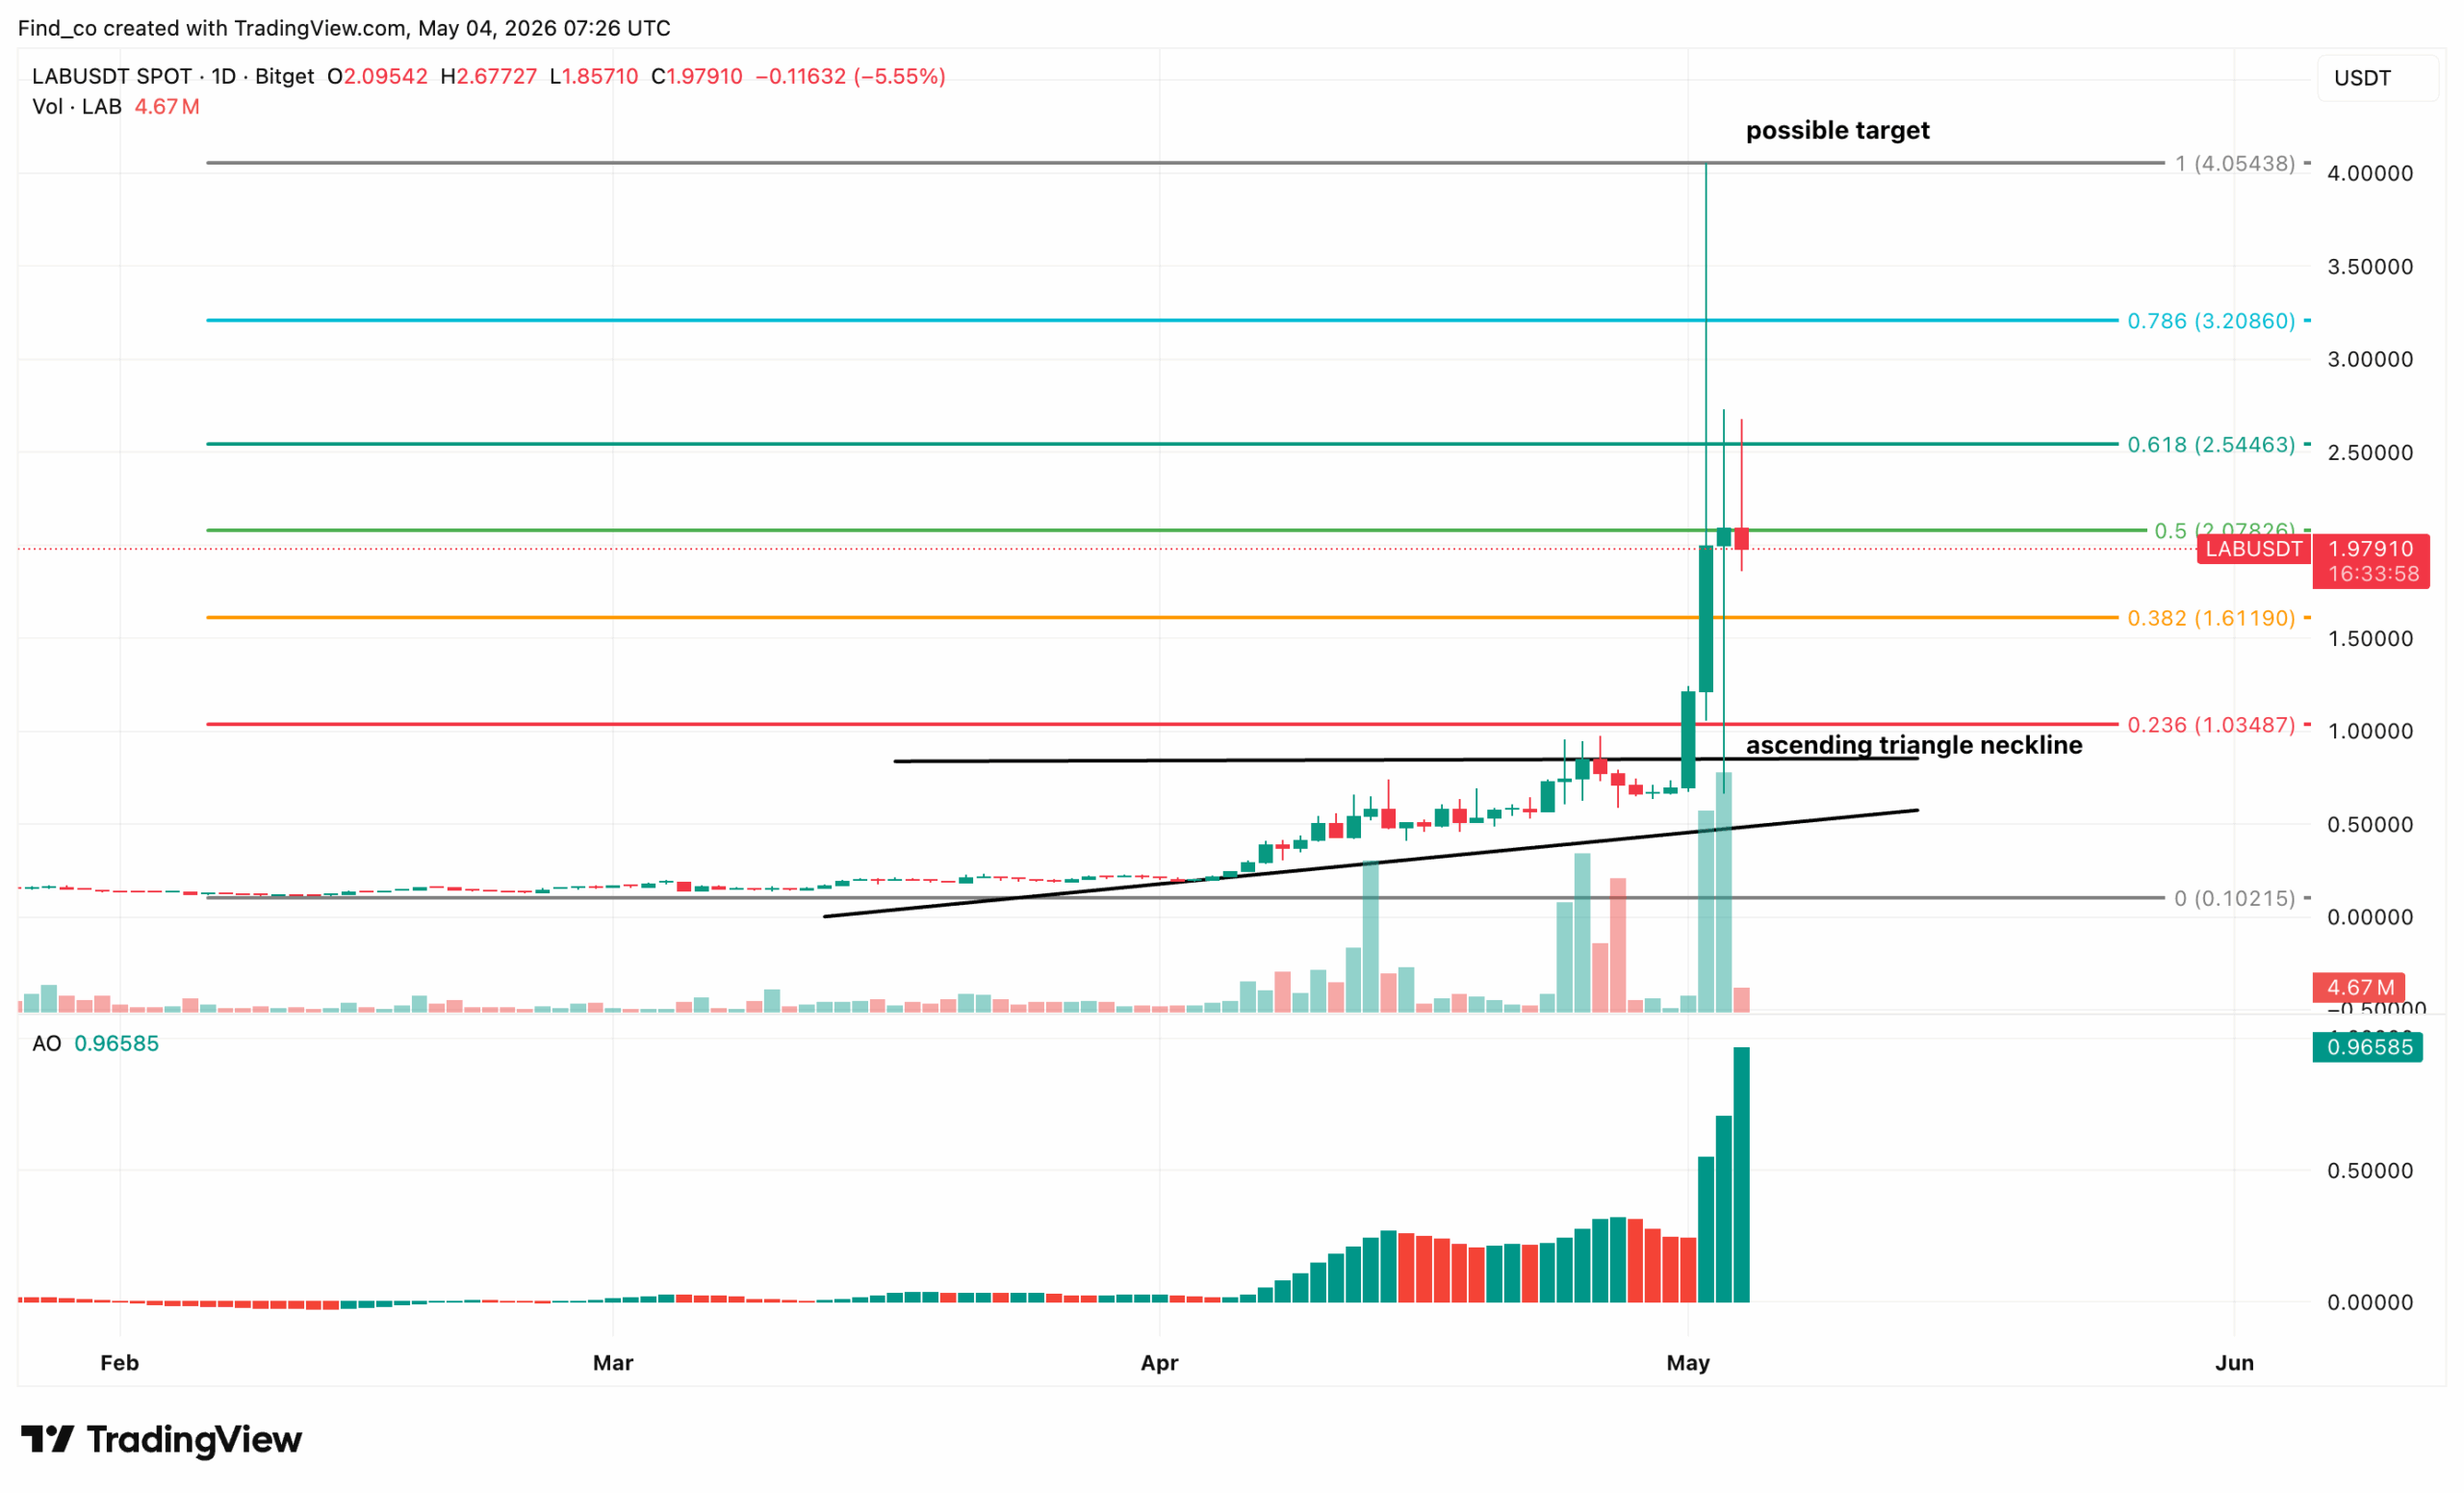
On the daily chart, LAB has broken out of an ascending triangle. Interestingly, the move is backed by a clear rise in volume, which adds credibility to the breakout.
The key level was the neckline around $1, and once LAB’s price pushed through it, the move accelerated quickly, with little resistance, until the 0.5 Fibonacci level near $2.07.
This kind of move usually signals strong demand. But it can also signal a short consolidation phase after such a breakout.
Right now, the $2 to $2.15 region is acting as the first major resistance.
However, the important thing is whether LAB’s price can hold above the previous breakout zone, especially the $1.65 region.
As long as that holds, this looks more like consolidation rather than a reversal.
If price stabilizes here and continues higher, the next targets are well defined. The 0.618 Fib level around $2.54 is the next resistance, followed by $3.20 at the 0.786 Fib level.
A full continuation move could extend toward the $4 region, which aligns with the measured move from the triangle and the prior all-time high zone.
On the downside, if the LAB crypto price breaks below the $1.65 area, it would weaken the breakout structure and likely lead to a deeper pullback toward the $1 neckline, which would then act as major support.
Disclaimer:
The information provided in this article is for informational purposes only. It is not intended to be, nor should it be construed as, financial advice. We do not make any warranties regarding the completeness, reliability, or accuracy of this information. All investments involve risk, and past performance does not guarantee future results. We recommend consulting a financial advisor before making any investment decisions.
Victor Olanrewaju is a crypto analyst and reporter at CCN with deep roots in on-chain research and technical analysis. His crypto journey began in 2017, but it was the 2020 Uniswap airdrop that sparked a full-time pivot into the space.
With a foundation in copywriting, Victor honed his craft creating high-converting content for leading crypto brokers — most notably an XRP price prediction that ranked #1 on Google during the 2021 bull run.
He later joined AMBCrypto in 2022, where he combined storytelling with technical and on-chain analysis to cover key market narratives.
In 2024, he expanded his expertise at BeInCrypto, collaborating with analysts and using tools like Glassnode, Santiment, and IntoTheBlock to break down Bitcoin and altcoin trends.
At CCN, Victor covers the top cryptocurrencies, memecoins, macro shifts, blending real-time insights with deep-dive metrics.
He holds a Bachelor’s degree in Physics from the University of Ibadan, equipping him to simplify complex data for a wide audience. Follow his work or connect on LinkedIn or X.