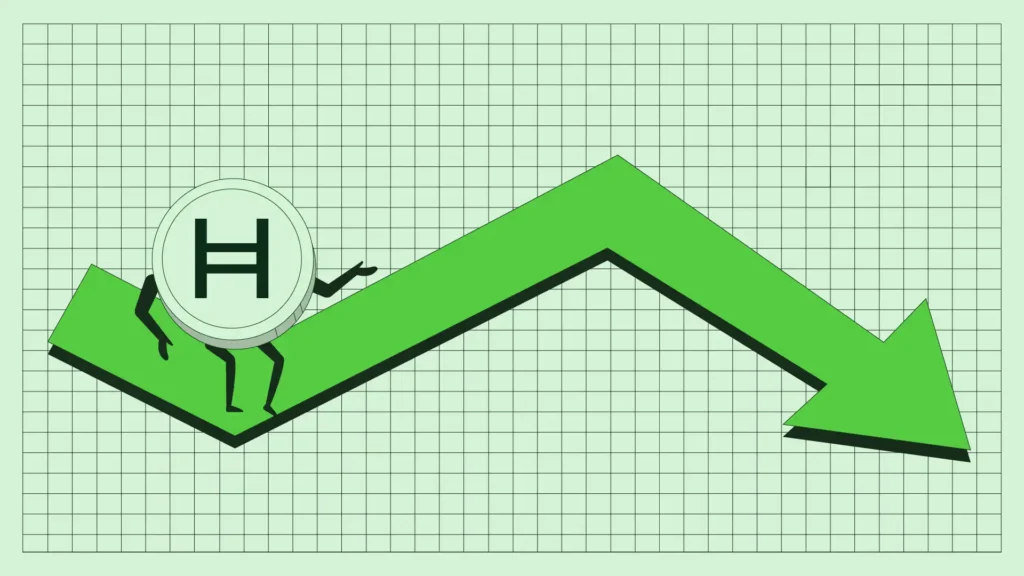
HBAR charts show fading momentum and bearish pressure | Credit: Hameem Sarwar
Share
Key Takeaways
HBAR is down 51% YTD and is trapped in a weak triangle pattern.
Indicators show fading momentum and persistent seller dominance.
If the altcoin breaks below $0.13, this analysis reveals what could happen.
Hedera’s (HBAR) year-to-date 51% plunge has exposed a painful truth about the altcoin.
Sentiment has completely flipped. As seen below, the once-optimistic outlook of the last quarter of 2024 has vanished.
Buyers are retreating. And unless demand returns soon, HBAR’s price decline could stretch well beyond this December.
HBAR Fails to Break Resistance Repeatedly
With key support levels repeatedly tested and the market sentiment leaning bearish, HBAR’s price action mirrors a market struggling to find stability.
As shown below, the altcoin is currently trapped in a symmetrical triangle. A closer look reveals that it failed to breach the overhead resistance.
Get These Top Crypto Casino Offers Now!
Sponsored
Disclosure
We sometimes use affiliate links in our content, when clicking on those we might receive a commission at no extra cost to you. By using this website you agree to our terms and conditions and privacy policy.
As a result, this altcoin is inching toward the lower trendline of the triangle. This has increased the likelihood of a more profound decline as the year-end approaches.
The Relative Strength Index (RSI) on the 4-hour chart shows the indicator hovering just above the neutral 50 mark.
Yet, the indicator slopes downward, signaling fading momentum and a potential slide back toward the oversold region.
This weakening trend highlights the growing dominance of sellers, despite recent bounces. Due to this, HBAR’s price might struggle to recover.
Meanwhile, the Chaikin Money Flow (CMF) signals a similarly bearish outlook.
The indicator remains pinned near the zero line with clear downward pressure, indicating that buying pressure is drying up.
Sustained negative CMF readings typically reinforce bearish continuation patterns, aligning with the broader downtrend visible on the chart.
With HBAR’s price repeatedly rejecting the $0.16 resistance zone and struggling to sustain higher lows, the cryptocurrency remains vulnerable to further downside.
A break below the $0.13 support area could accelerate the decline and keep the asset under pressure as the year comes to a close.
HBAR Price Prediction: Further Downtrend Ahead
As shown below, HBAR’s price is in a downward trend and continues to lose momentum as sellers tighten their grip.
The market shows little interest in reversing course, signaling that buyers remain hesitant while traders brace for deeper pullbacks.
The Awesome Oscillator (AO) on the daily chart trends in negative territory, reinforcing the broader bearish sentiment.
Although the indicator prints green histogram bars below the neutral line, the signals still point to a fragile recovery attempt rather than a confirmed shift in direction, keeping downside risks in play.
Similarly, the Directional Movement Index (DMI) mirrors this trajectory.
The negative -DMI (red) sits at 22.58 above the positive +DMI (green) at 17.89, highlighting continued seller dominance and the pressure weighing on Hedera’s price.
Additionally, the Average Directional Index (ADX) lies between the two DMIs at 19.17, indicating that the current trend lacks strong momentum and the market is in a consolidation phase.
This low ADX reading shows that neither buyers nor sellers have complete control, leaving HBAR’s price vulnerable to short-term fluctuations until a more apparent trend emerges.
Disclaimer:
The information provided in this article is for informational purposes only. It is not intended to be, nor should it be construed as, financial advice. We do not make any warranties regarding the completeness, reliability, or accuracy of this information. All investments involve risk, and past performance does not guarantee future results. We recommend consulting a financial advisor before making any investment decisions.
Victor Olanrewaju is a crypto analyst and reporter at CCN with deep roots in on-chain research and technical analysis. His crypto journey began in 2017, but it was the 2020 Uniswap airdrop that sparked a full-time pivot into the space.
With a foundation in copywriting, Victor honed his craft creating high-converting content for leading crypto brokers — most notably an XRP price prediction that ranked #1 on Google during the 2021 bull run.
He later joined AMBCrypto in 2022, where he combined storytelling with technical and on-chain analysis to cover key market narratives.
In 2024, he expanded his expertise at BeInCrypto, collaborating with analysts and using tools like Glassnode, Santiment, and IntoTheBlock to break down Bitcoin and altcoin trends.
At CCN, Victor covers the top cryptocurrencies, memecoins, macro shifts, blending real-time insights with deep-dive metrics.
He holds a Bachelor’s degree in Physics from the University of Ibadan, equipping him to simplify complex data for a wide audience. Follow his work or connect on LinkedIn or X.