Monad breaks out of a falling wedge as inflows rise | Credit: Veronica Cestari
Share
Key Takeaways
MON is bullish in the short term, as the AO and MACD are positive.
MON must break $0.024 to target $0.035, but falling OI adds risk.
If MON loses $0.018 support, the price could slide toward $0.017.
Monad (MON) is showing renewed bullish traction after rallying roughly 32% over the last seven days.
This signals a clear improvement in short-term market control.
The rebound follows an extended period of consolidation and downside pressure, during which Monad’s price traded at depressed levels.
Trading volume is up 8% over the past 24 hours, indicating that the move is attracting incremental activity.
With price reclaiming key levels, MON now sits at a critical point, where bulls are attempting to transition a bounce into an extended rally.
Can the Monad price rally hold?
Monad Reclaims Support
On the 4-hour chart, the Awesome Oscillator (AO) confirms a shift in momentum.
The indicator remains above the zero line, signaling strengthening bullish pressure after weeks of muted price action.
The Moving Average Convergence Divergence (MACD) supports the shift. The 12-day EMA has crossed above the 26-day EMA, while the histogram continues to print positive bars.
Get These Top Crypto Casino Offers Now!
Sponsored
Disclosure
We sometimes use affiliate links in our content, when clicking on those we might receive a commission at no extra cost to you. By using this website you agree to our terms and conditions and privacy policy.
This alignment reflects an improving uptrend, particularly as the MACD lines continue to separate amid the ascending channel.
Furthermore, the price structure reinforces the thesis. As seen below, MON’s price has bounced above the $0.018 demand zone, forming a sequence of higher lows.
The rally has pushed the price back above the $0.022 level, flipping it into near-term support.
However, Monad is now pressing into a key resistance zone near $0.024, where prior upside attempts were met with aggressive sell-side responses.
If MON clears this level, the next upside target sits near the $0.030 psychological zone, with further extension potentially toward $0.035 if momentum holds.
Open Interest Drops as Traders Reduce Risk
Despite the improving technical setup, derivatives positioning introduces a note of caution.
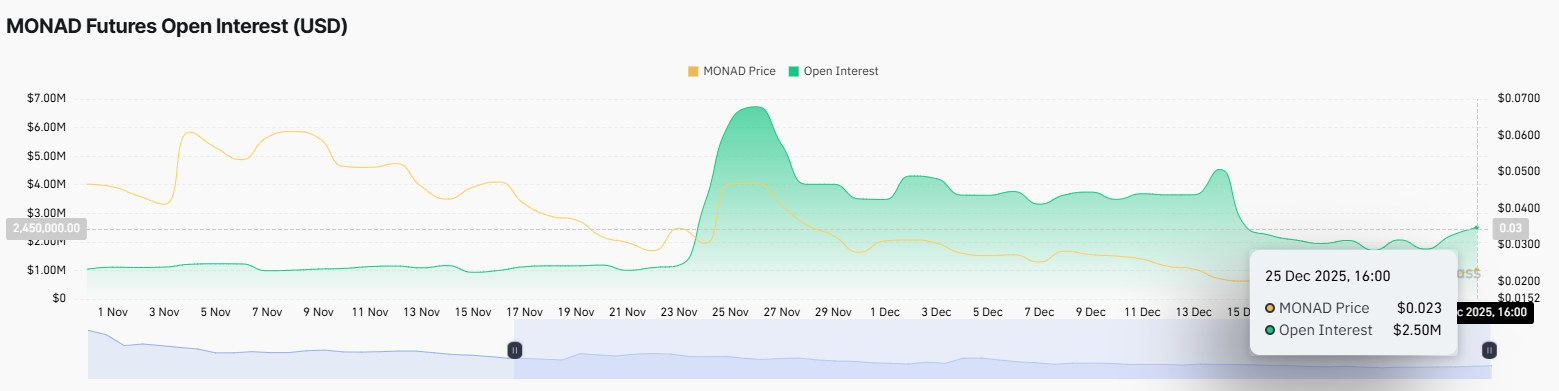
Open interest (OI) has declined by approximately 17%, indicating that traders are reducing their exposure rather than adding leverage to the move.
Falling OI during a price rally can imply one of two things: spot-led demand is driving the move without leverage support, or traders are positioning defensively in anticipation of a pullback.
If OI continues to trend lower, it could limit follow-through and keep the Monad price rally vulnerable to retracements.
MON Price Outlook: Confirmation Matters
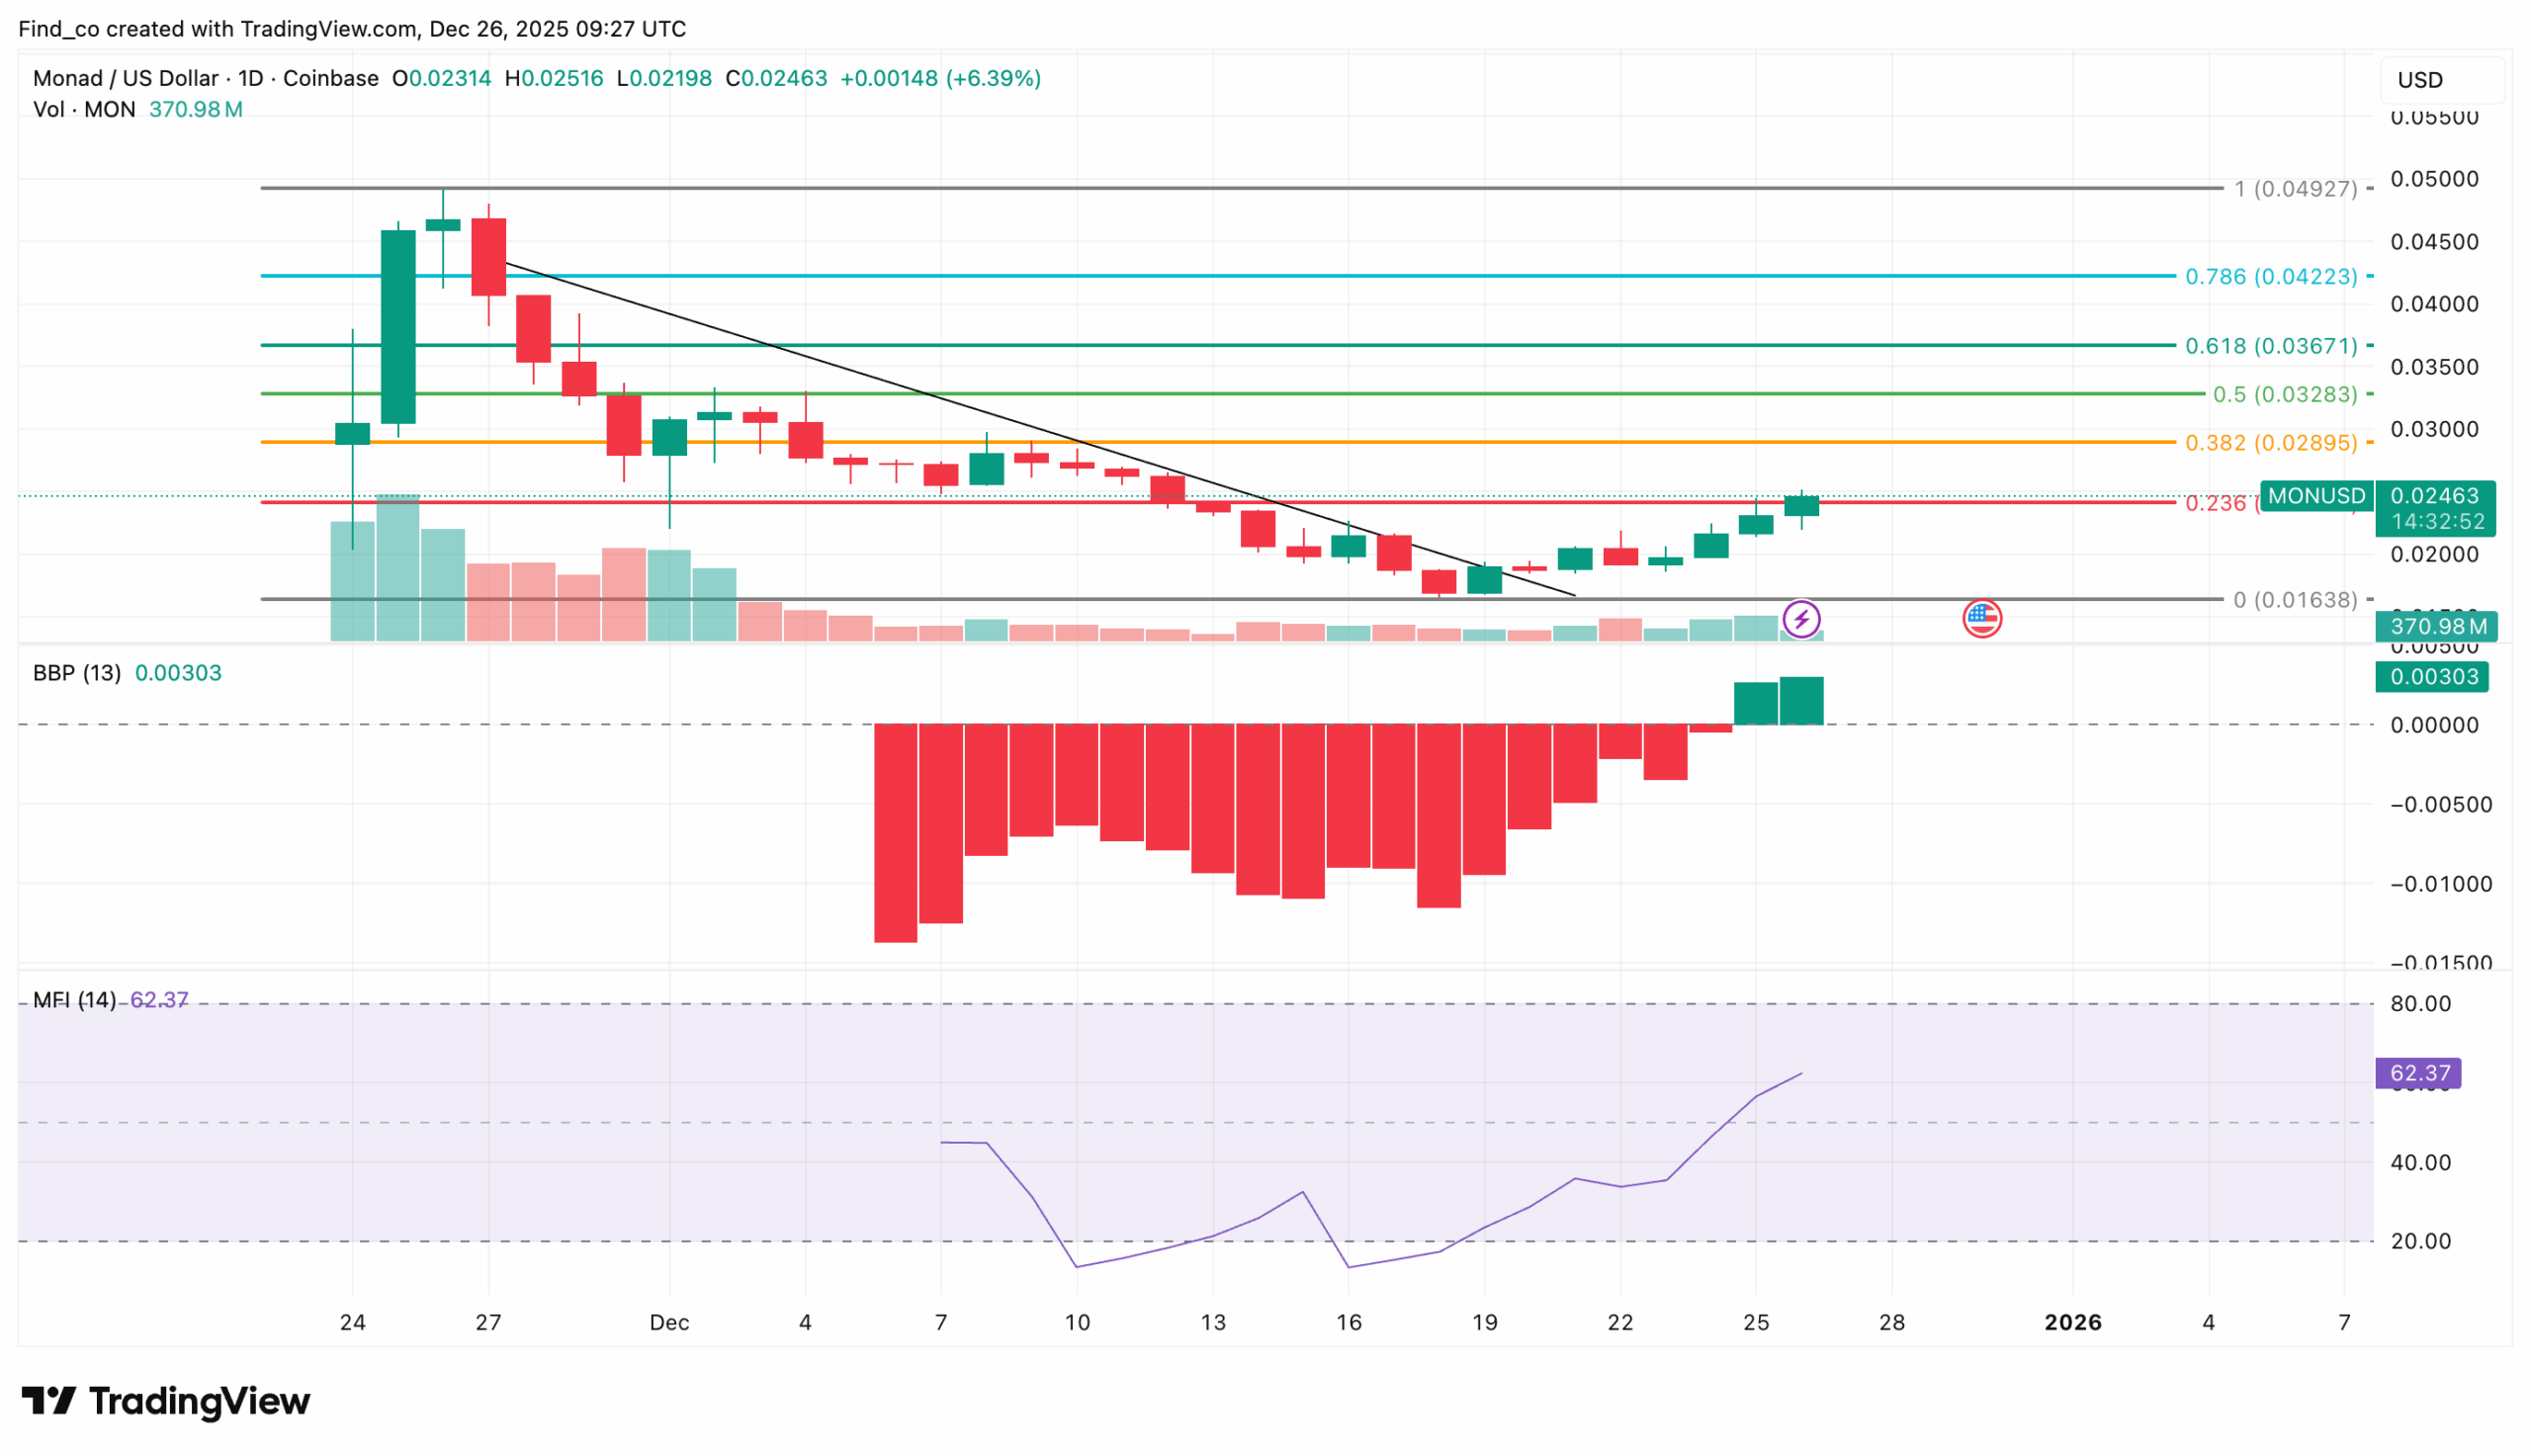
On the daily timeframe, MON’s price has broken out of a falling wedge — a structure often associated with bullish reversals when supported by sustained inflows.
Bull Bear Power (BBP) has flipped into positive territory and continues to print green histogram bars, signaling that buyers have regained directional control.
The Money Flow Index (MFI) provides further confirmation, rising to 61.89.
This MFI reading suggests that capital inflows are outweighing outflows, and the rally is gaining improved participation behind it.
Fibonacci levels provide clearer reference points. At press time, MON trades around $0.023, with resistance aligned near the 0.236 retracement zone.
Disclaimer:
The information provided in this article is for informational purposes only. It is not intended to be, nor should it be construed as, financial advice. We do not make any warranties regarding the completeness, reliability, or accuracy of this information. All investments involve risk, and past performance does not guarantee future results. We recommend consulting a financial advisor before making any investment decisions.
Victor Olanrewaju is a crypto analyst and reporter at CCN with deep roots in on-chain research and technical analysis. His crypto journey began in 2017, but it was the 2020 Uniswap airdrop that sparked a full-time pivot into the space.
With a foundation in copywriting, Victor honed his craft creating high-converting content for leading crypto brokers — most notably an XRP price prediction that ranked #1 on Google during the 2021 bull run.
He later joined AMBCrypto in 2022, where he combined storytelling with technical and on-chain analysis to cover key market narratives.
In 2024, he expanded his expertise at BeInCrypto, collaborating with analysts and using tools like Glassnode, Santiment, and IntoTheBlock to break down Bitcoin and altcoin trends.
At CCN, Victor covers the top cryptocurrencies, memecoins, macro shifts, blending real-time insights with deep-dive metrics.
He holds a Bachelor’s degree in Physics from the University of Ibadan, equipping him to simplify complex data for a wide audience. Follow his work or connect on LinkedIn or X.