Key Takeaways
- Ethereum usage is surging, but the ETH price remains stuck below $3,500.
- Regulatory uncertainty and staking dynamics have restricted a breakout.
- Losing whale support increases downside risk unless ETH reclaims resistance.


Ethereum (ETH) has presented a startling divergence between on-chain utility and market valuation.
Over the last few days, network activity on the blockchain has been heating up. Yet Ethereum’s price still stalls below $3,500, currently hovering around $3,200 at this writing.
That gap is the story right now. So, why is ETH struggling to keep pace with the rise in active addresses, and what could this imply for the price? Let’s find out.
Activity is exploding first. Etherscan-based trackers show daily transactions spiking to record levels in mid-January, with prints around 2.8 million per day.
At the same time, based on Santiment data, daily active addresses exceeded 849,00 on Jan. 20, signaling broad participation.
Even more interesting, Glassnode-cited reporting says the “new user” cohort is growing fast.
First-time interacting addresses reportedly climbed from roughly 4 million to 8 million over about 30 days. That looks like onboarding, not just leveraging churn.
Typically, the rise in these metrics should be bullish for Ethereum’s price. Unfortunately, that is not the case as ETH has been consolidating around the same area over the past week.

Regulatory noise is one anchor. Coinbase pulled support for the Senate’s draft CLARITY Act on Jan. 14, 2026. That move slowed the “regulatory clarity” trade. It also made institutions hesitate.
Staking is the next anchor. Staked ETH has hit record levels near 36 million ETH, or about 30% of supply. That sounds bullish. It reduces the liquid supply.
However, it also changes who holds the bag. Stakers chase yield. They often sell less. But they also buy less aggressively on breakouts. That can flatten upside bursts.

Then comes the leverage ceiling. Liquidation data shows a heavy pocket of short liquidations sitting just above $3,400.
That creates a magnet and a battlefield at once. Bears defend the zone because a clean break can trigger a squeeze. Bulls hesitate because they know the fight will be violent.
Put it together, and ETH’s current price action starts to make sense. Usage surges. Fresh wallets arrive. Yet macro and positioning keep price pinned.
That is why the next move could be sharp. If spot demand stays real and ETH clears $3,400 to $3,500, the squeeze dynamics can flip fast.
However, if it fails again, the market may keep valuing Ethereum’s price like a range trade, even while the chain runs at full speed.
While ETH can still trend higher over the long run, this short-term signal argues against a clean breakout. The number of addresses holding ≥10,000 ETH has been falling for three straight months.
That matters because this cohort usually represents whales, treasuries, significant funds, and long-duration allocators.
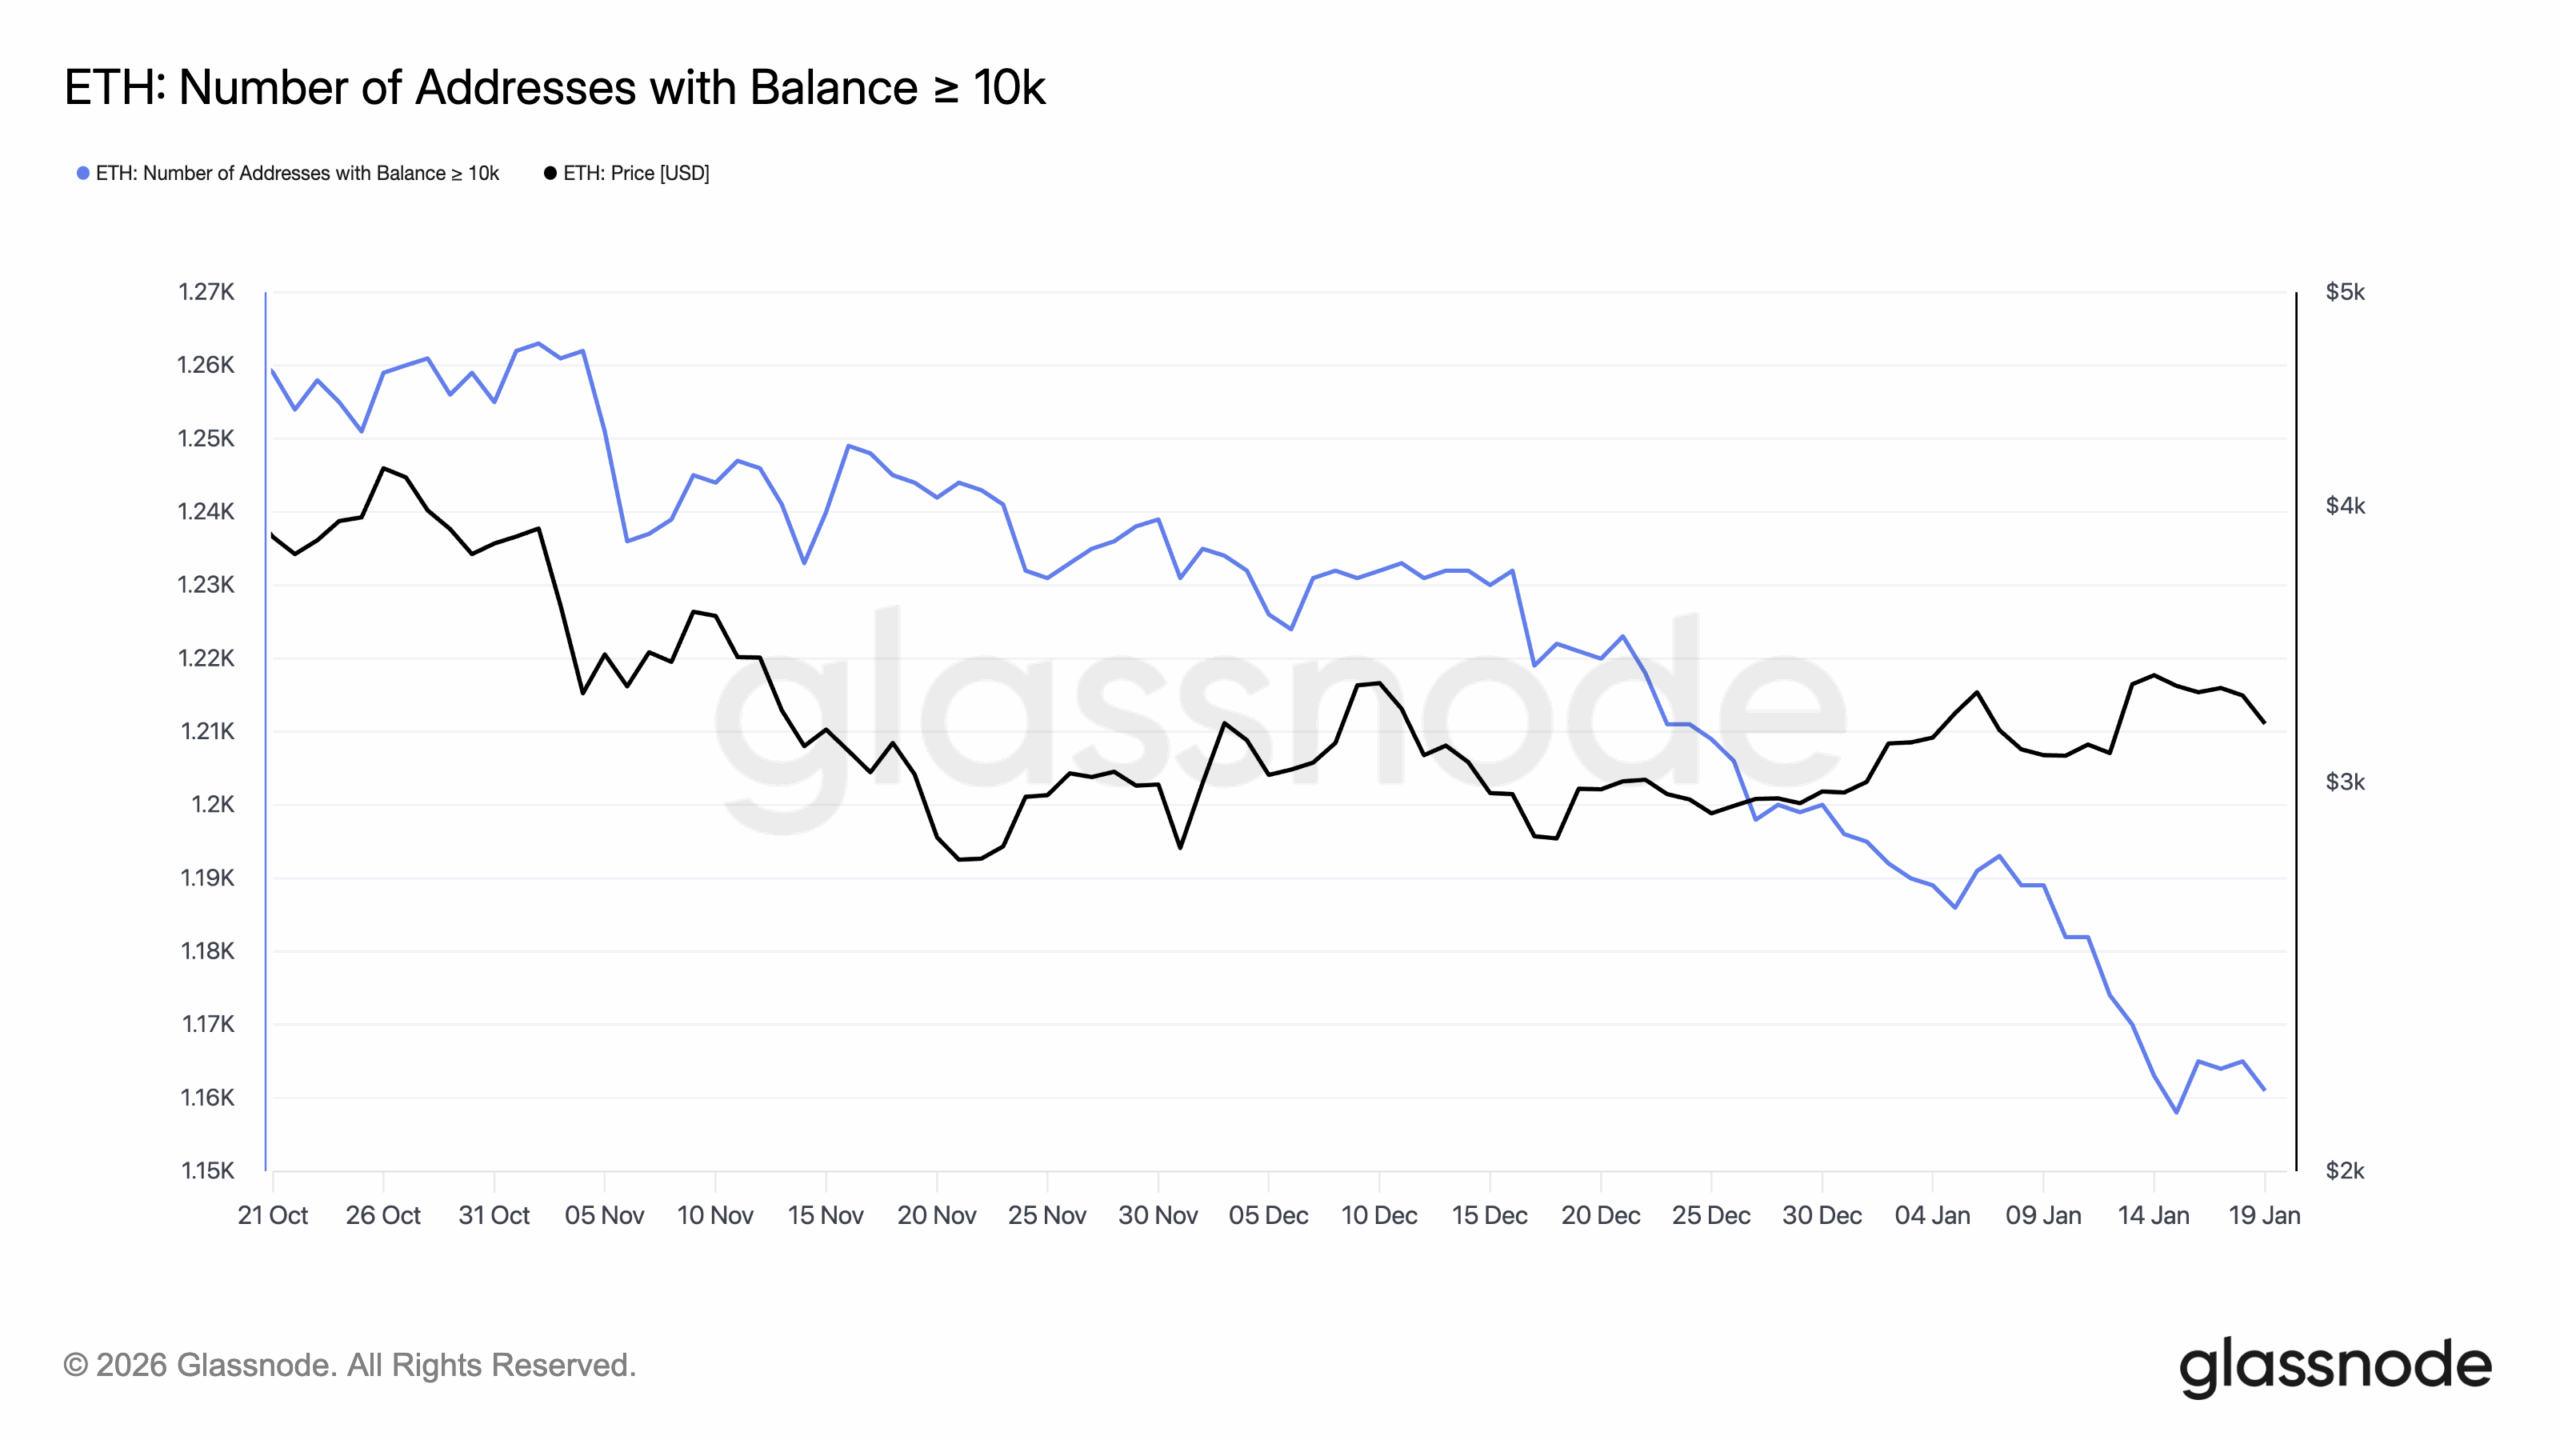
When this metric declines, it often means one of two things is happening. First, big holders may be reducing exposure. They distribute into strength.
They also trim during uncertainty. That behavior adds supply at key levels and makes it harder for the price to punch through resistance, such as the $3,500 region.
Second, even if they are not selling outright, they may be breaking up holdings across wallets. That still lowers the “whale count,” and it can weaken the market’s perception of conviction.
Either way, the signal can affect price through liquidity. So, if whale presence continues to shrink, Ethereum’s price can become more sensitive to sell-offs.
From a technical perspective, Ethereum’s price failed to break above the $3,438 resistance on the daily chart.
That rejection matters because it shows sellers still control the supply zone, and buyers have not forced a clean trend expansion yet.
Momentum has also cooled fast. The Money Flow Index (MFI) has dropped sharply, which signals weaker inflows and fading demand.
When the MFI falls like this after a rejection, ETH often drifts toward support because buyers stop stepping in with the same urgency.
Price structure adds to the risk. Notably, ETH’s price has slipped below the 20-day EMA (blue), a move that usually signals a shift from “buy-the-dip” to “sell-the-rally”.
In other words, the 20 EMA is no longer providing support. It becomes a ceiling until price reclaims it.
If this setup holds, Ethereum’s price risks breaking the support near $3,100. If that level gives way, the next move could cut below the $3,000 psychological mark, especially if volume rises on down candles.
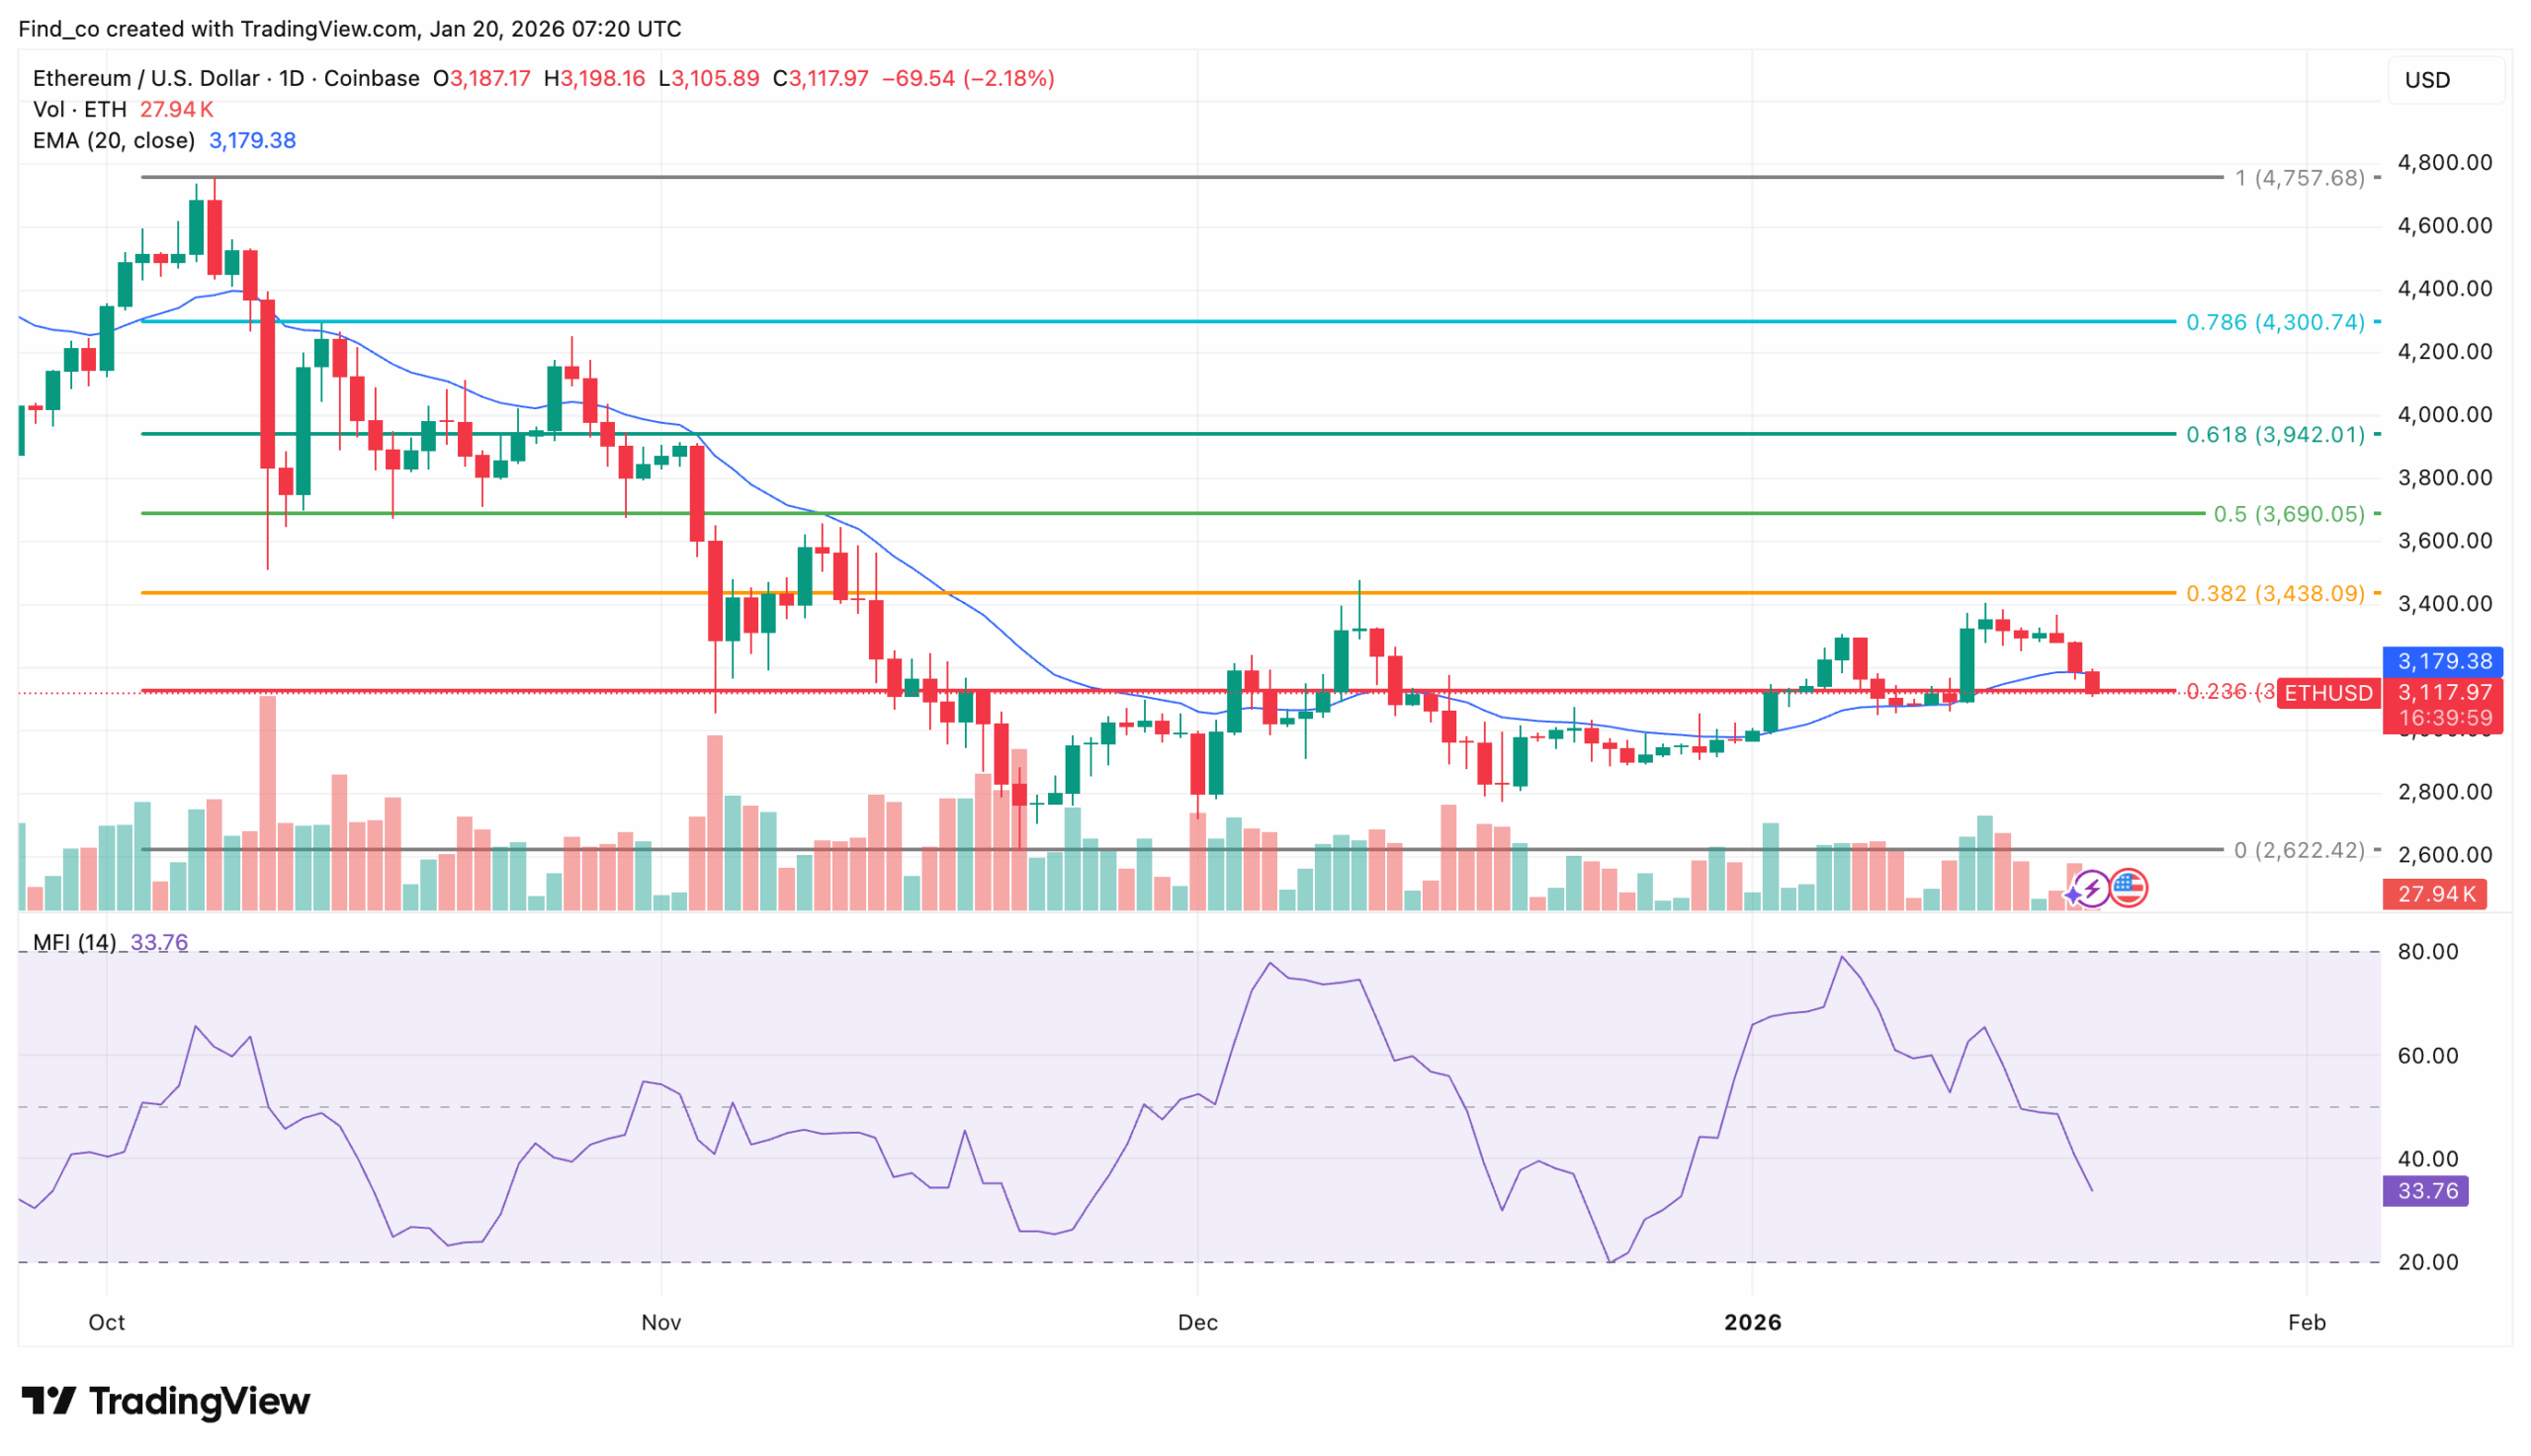
Still, the bearish case is not set in stone. If buying pressure returns and ETH reclaims the 20 EMA, it could quickly reset momentum.
A break above $3,438 would invalidate the immediate downside threat and signal that demand is strong enough to absorb sellers.
In that bullish scenario, ETH could rally toward $3,942. If momentum accelerates and the breakout sticks, the next extension zone comes into view near $4,300.
You May Also Like
Victor Olanrewaju is a crypto analyst and reporter at CCN with deep roots in on-chain research and technical analysis. His crypto journey began in 2017, but it was the 2020 Uniswap airdrop that sparked a full-time pivot into the space.
With a foundation in copywriting, Victor honed his craft creating high-converting content for leading crypto brokers — most notably an XRP price prediction that ranked #1 on Google during the 2021 bull run.
He later joined AMBCrypto in 2022, where he combined storytelling with technical and on-chain analysis to cover key market narratives.
In 2024, he expanded his expertise at BeInCrypto, collaborating with analysts and using tools like Glassnode, Santiment, and IntoTheBlock to break down Bitcoin and altcoin trends.
At CCN, Victor covers the top cryptocurrencies, memecoins, macro shifts, blending real-time insights with deep-dive metrics.
He holds a Bachelor’s degree in Physics from the University of Ibadan, equipping him to simplify complex data for a wide audience. Follow his work or connect on LinkedIn or X.