DOGE enters consolidation after a 23% rally | Credit: Hameem Sarwar
Share
Key Takeaways
DOGE is correcting after a 23% weekly rally, as indicated by the 4-hour chart, which shows short-term profit-taking.
The key support level to hold is $0.14, as defending it maintains the “higher lows” structure.
A breakout above $0.16 could lead to $0.19, but losing support raises the downside risk to $0.11.
Dogecoin (DOGE) has entered a consolidation phase after posting an impressive 23% rally in the last week.
The pullback follows a strong move that lifted Dogecoin’s price out of its range-bound movement in December.
Interestingly, this also reignited bullish sentiment across the memecoin sector.
While the recent retracement introduces short-term uncertainty, the current technical structure suggests the move is corrective rather than a complete trend reversal.
With DOGE now stabilizing above key support, traders are watching closely to see whether buyers can defend higher lows and set the stage for another breakout.
Can DOGE’s price hold above its immediate support? Let’s find out.
Profit-Taking Slows Uptrend
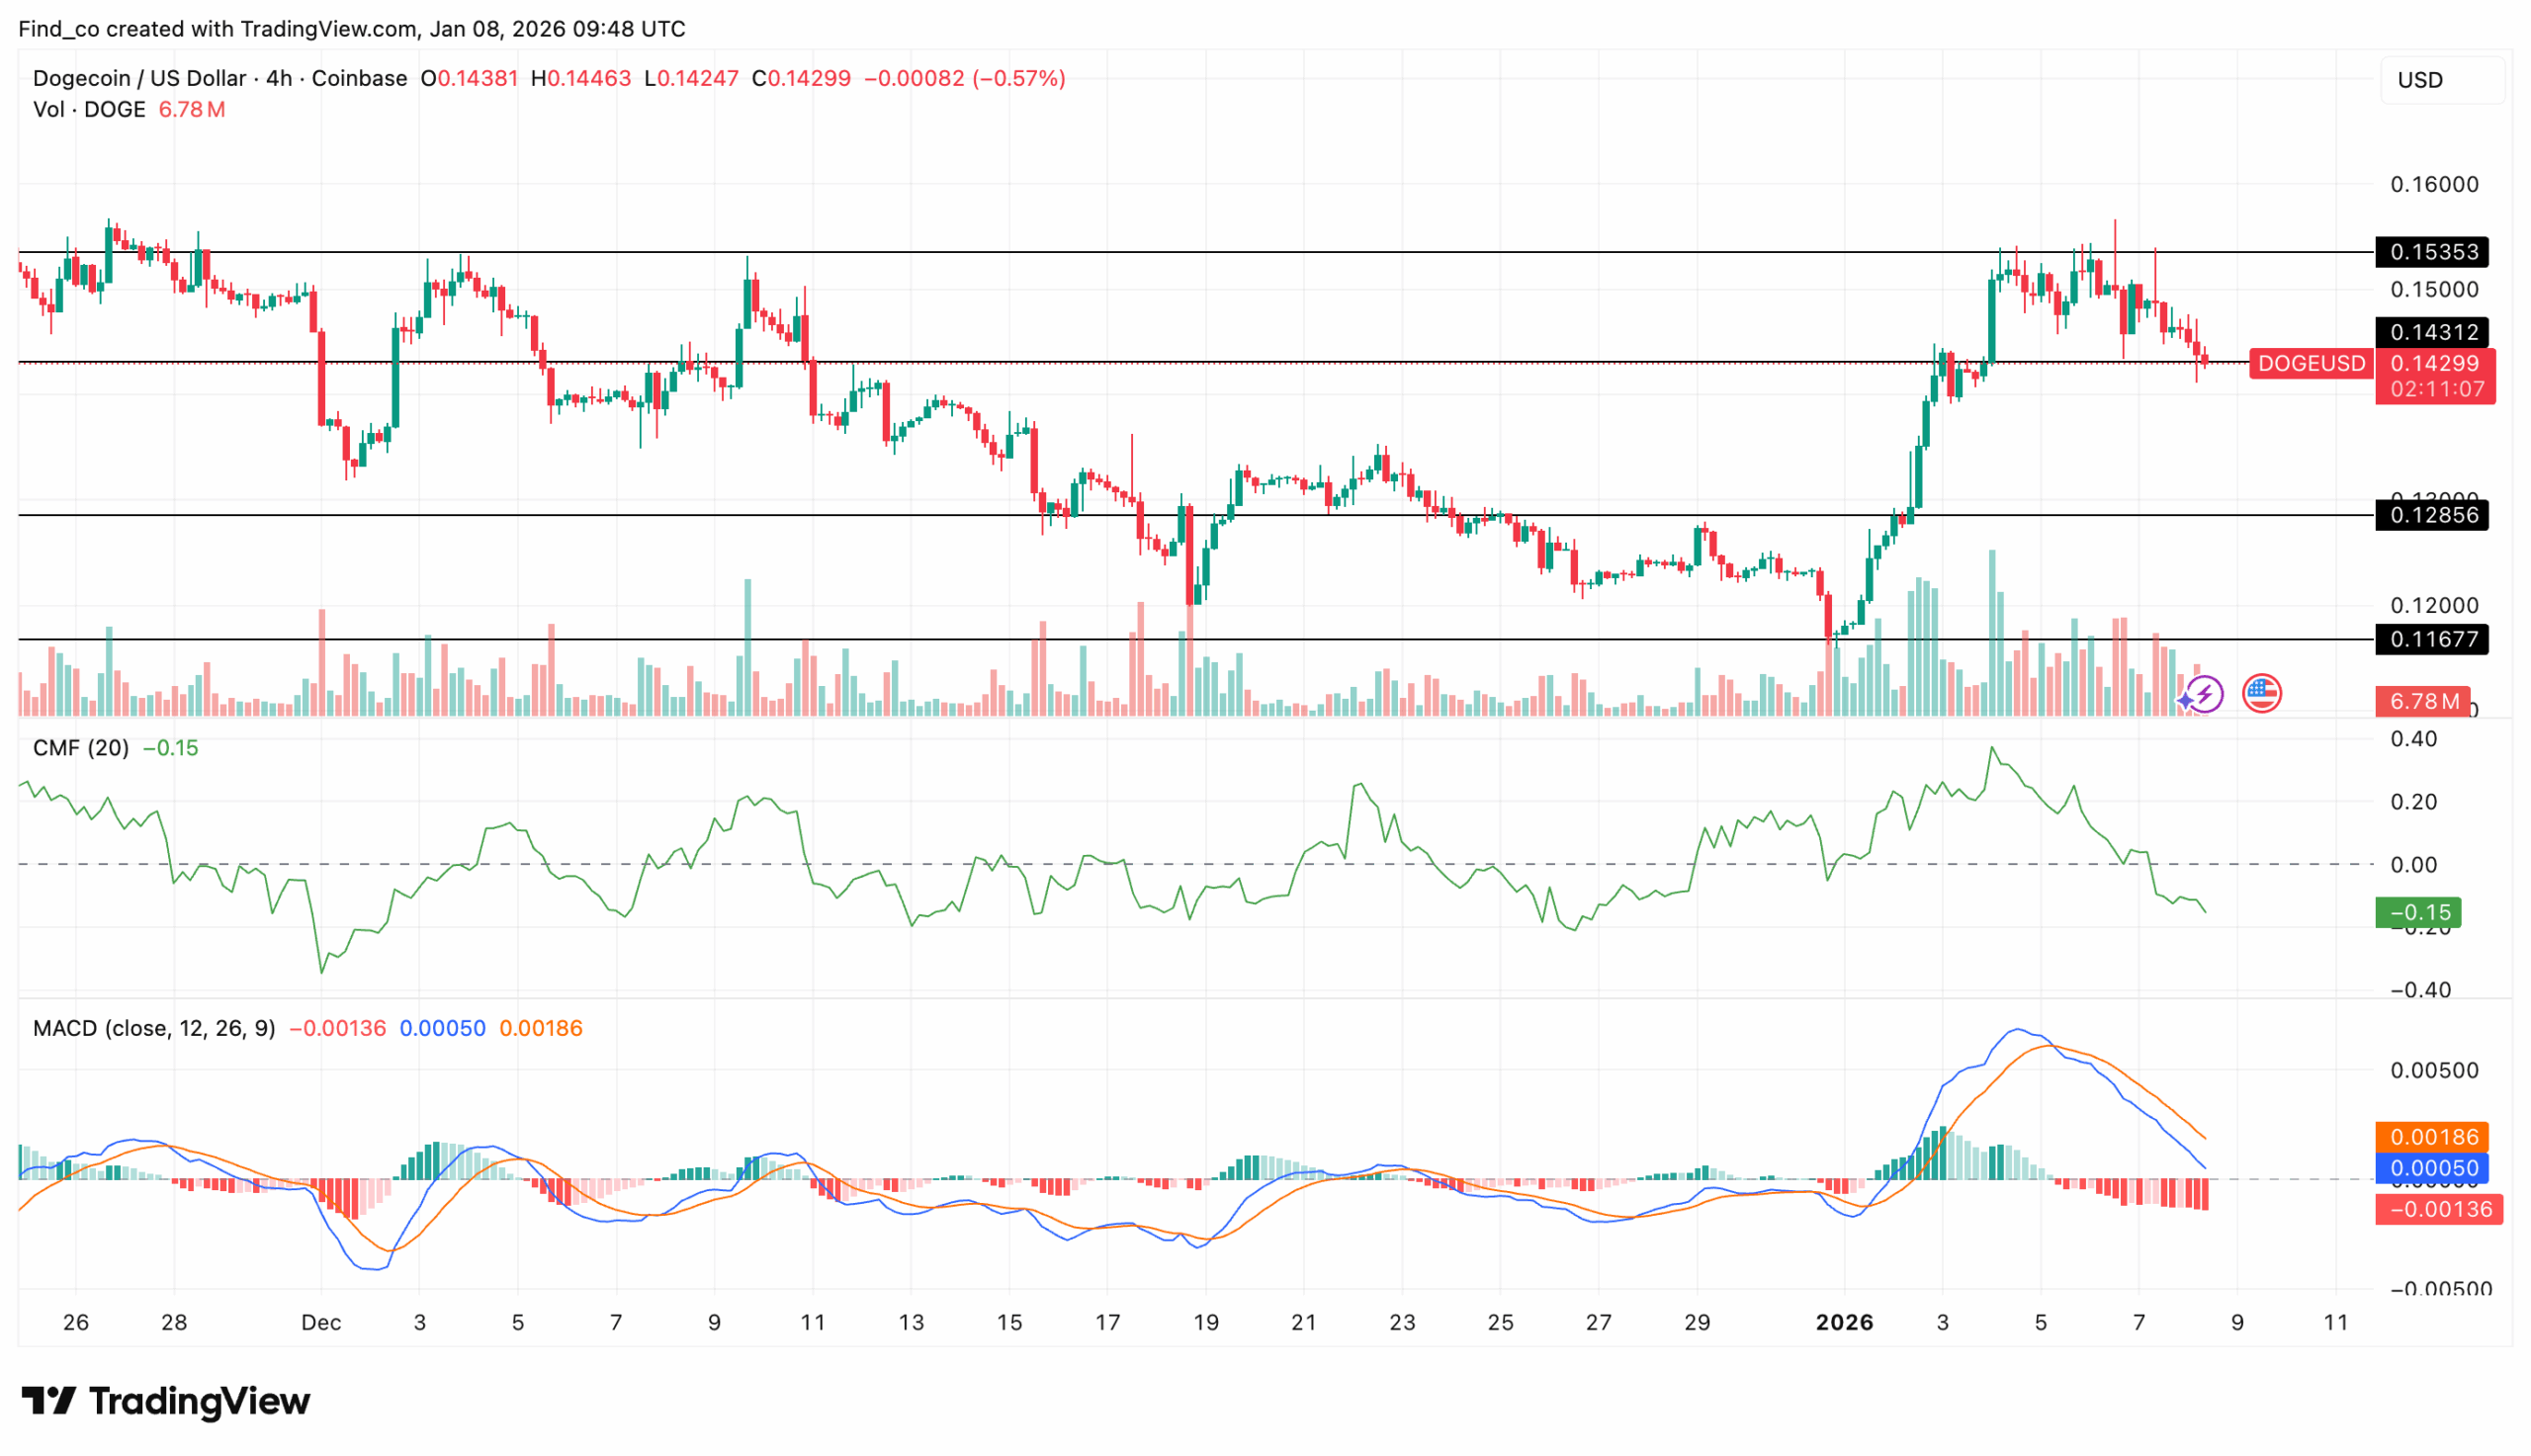
The Chaikin Money Flow (CMF) offers a clear view of the current capital flow behind DOGE’s pullback on the 4-hour chart.
Currently, the indicator remains in negative territory, around -0.16, indicating a short-term distribution phase.
This reading reflects profit-taking as traders lock in gains, temporarily slowing upside momentum.
However, DOGE’s price remains well above its December lows, indicating that the broader accumulation structure has not yet broken.
From another technical perspective, the Moving Average Convergence Divergence (MACD) shows a similar cooling pattern.
The 26-day EMA (orange) has crossed above the 12-day EMA (blue), and the histogram has flipped into red territory.
This shift highlights fading bullish momentum and reinforces the view that Dogecoin’s price is undergoing a corrective phase.
Yet, this does not imply a complete bearish reversal. In strong trending environments, pullbacks like this often precede another continuation leg to the upside once momentum resets.
A closer look at Dogecoin’s price action shows that the memecoin has pulled back from the $0.16 resistance zone after failing to hold above this level.
The rejection triggered a retracement toward the $0.14 support region, which now serves as a key short-term demand zone.
A successful defense here would signal buyer commitment at higher lows and keep the broader bullish structure intact.
Dogecoin Buyers Retain Marginal Advantage
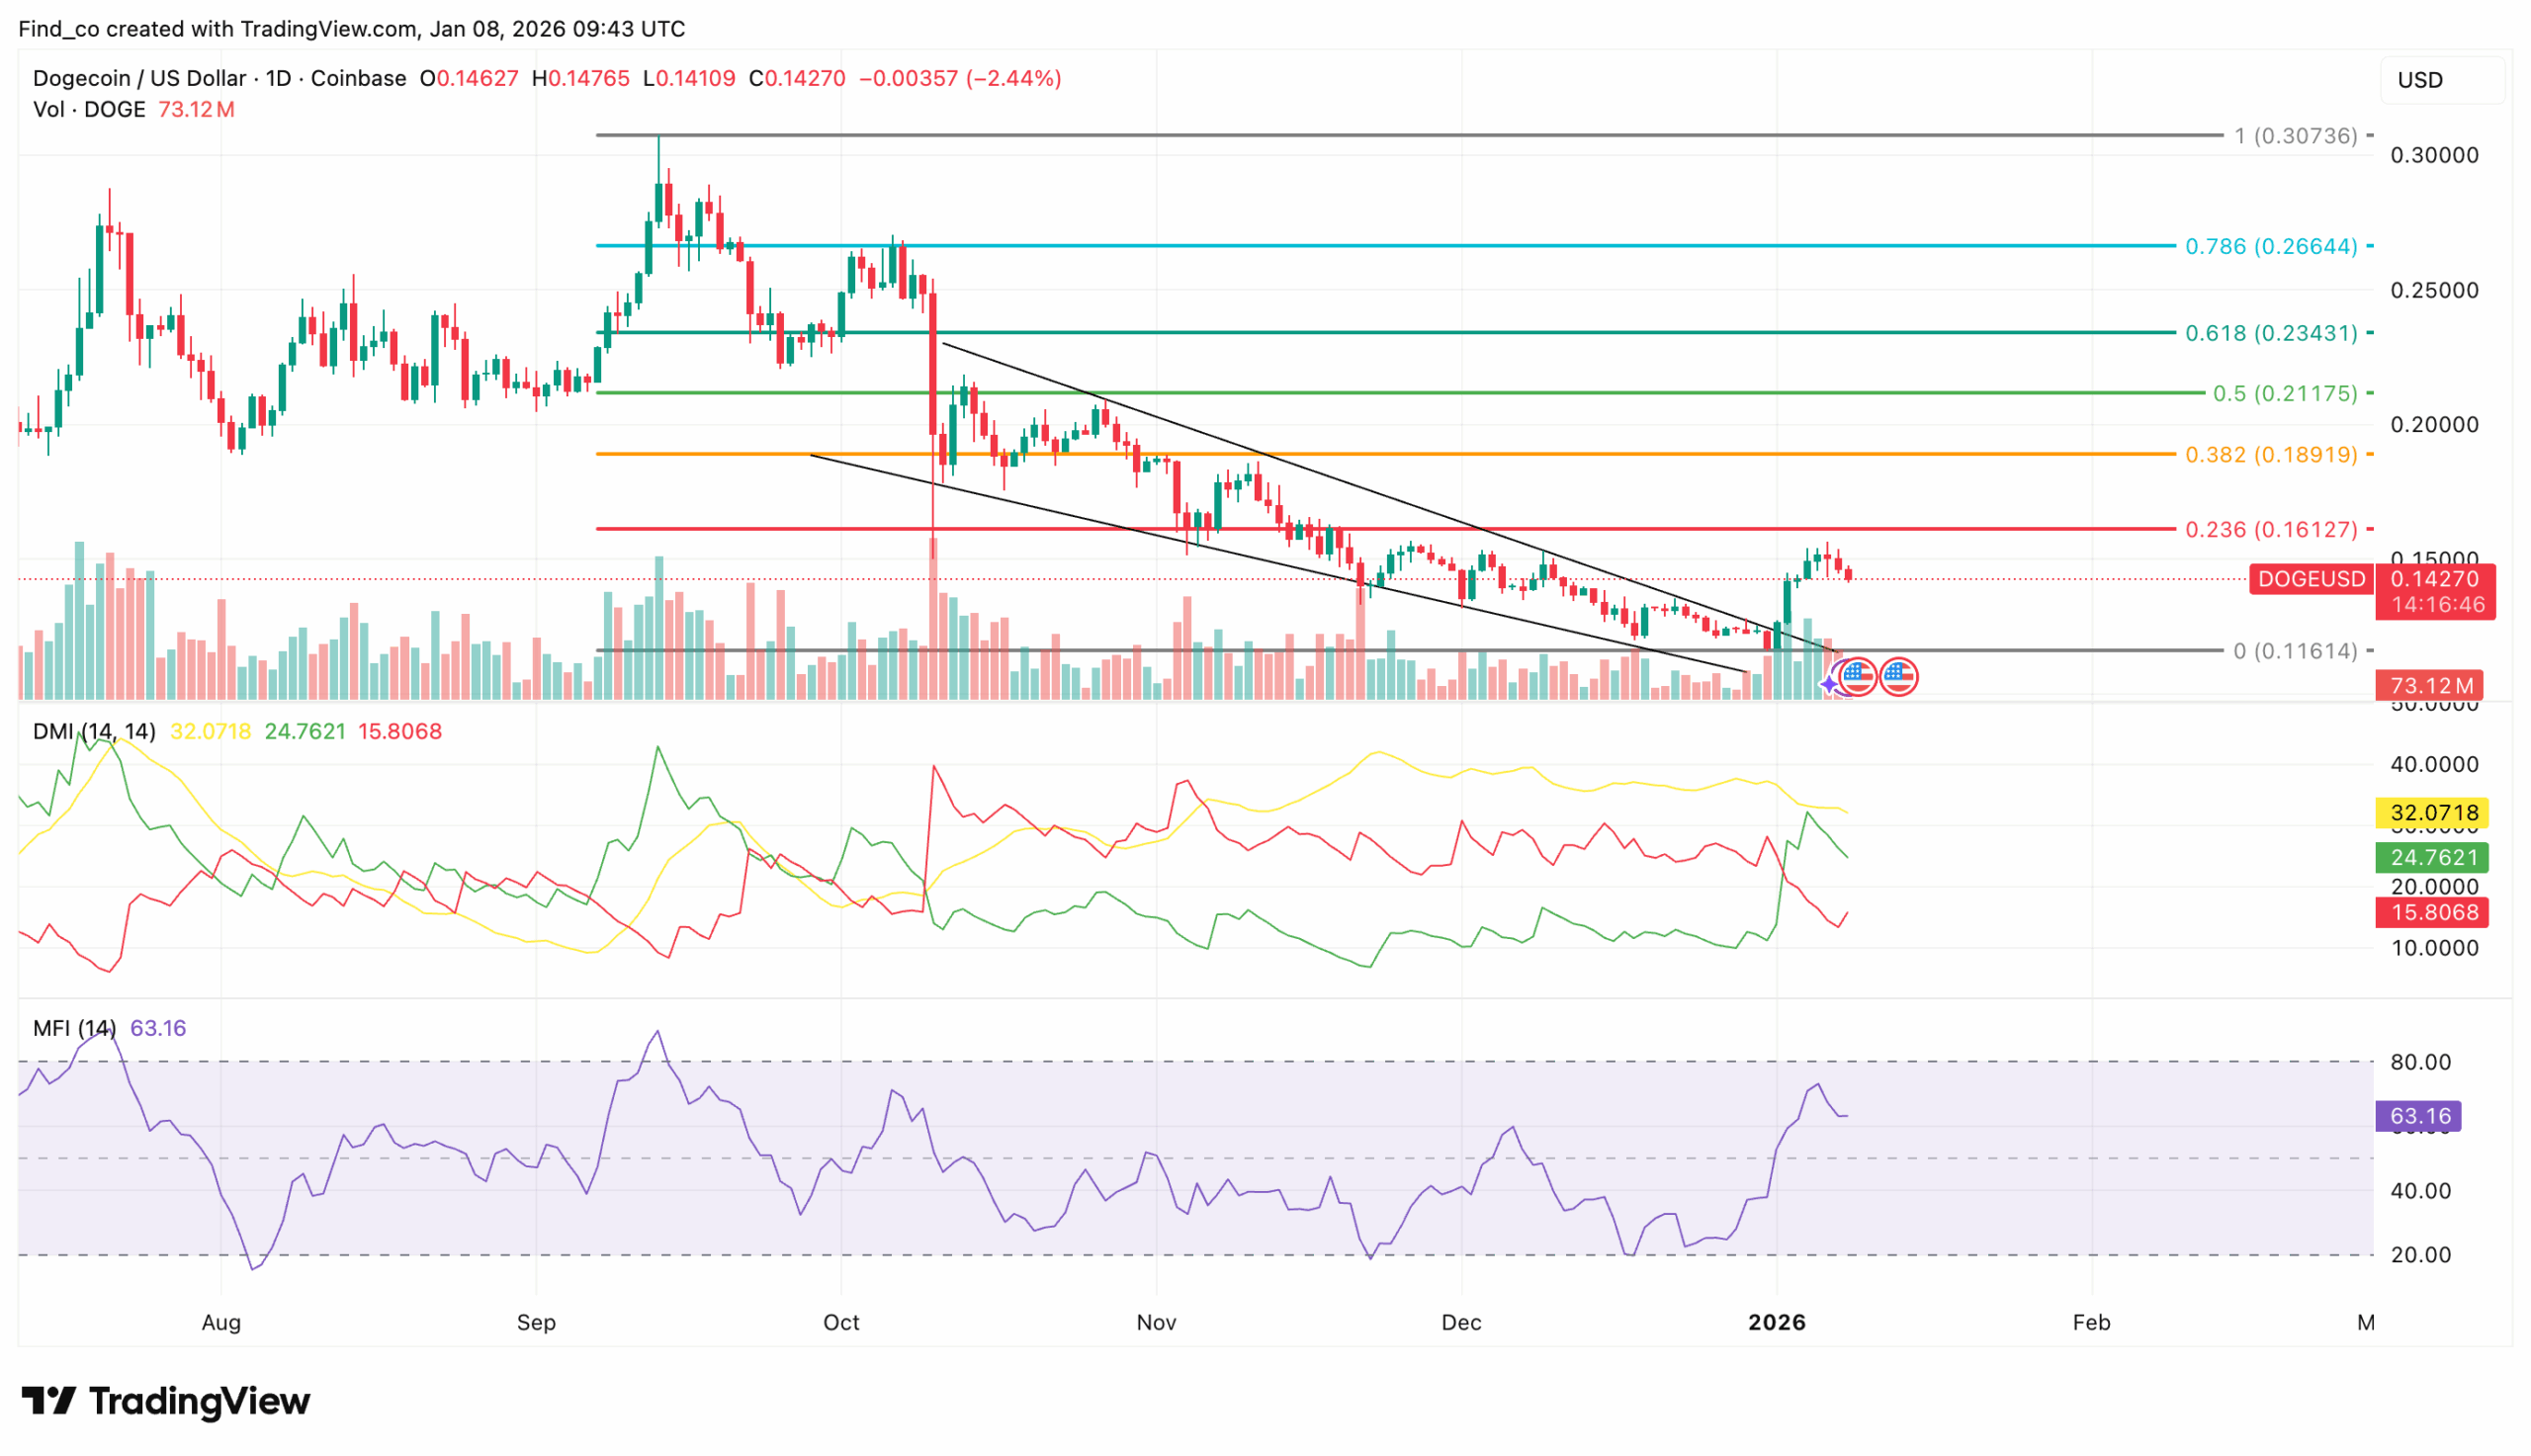
On the daily chart, Dogecoin’s price has reversed on its bullish course, indicating a market cool-off.
Technical indicators still show a slight bullish bias. For instance, the Directional Movement Index (DMI) indicates that buyers retain a marginal advantage.
As seen below, the +DMI remains above the negative DMI, confirming bullish pressure despite the pullback. However, the narrowing gap between the lines points to slowing momentum rather than a trend reversal.
At the same time, the Average Directional Index (ADX) stands at 30.23, indicating that the trend remains relatively strong despite losing momentum.
An ADX reading above 25 confirms an active trend, indicating that Dogecoin’s broader bullish structure remains intact as the price consolidates.
The Money Flow Index (MFI) remains above the midline, signaling that capital inflows are positive.
With MFI holding above 50, buying pressure continues to outweigh selling activity, and a reversal could soon take shape if momentum indicators align.
Where Is DOGE Price Headed?
Drawing from the Fibonacci retracement level as shown above, DOGE’s price sits below the 0.236 Fib level as it struggles to break above its key resistance point at $0.16.
This level has acted as a short-term ceiling, capping gains from the recent rally.
A break above $0.16, confirmed by rising volume, could pave the way for the next resistance at $0.19.
However, if sellers continue to push the price downward, DOGE risks hitting its support level at $0.11, which would invalidate any bullish momentum.
Disclaimer:
The information provided in this article is for informational purposes only. It is not intended to be, nor should it be construed as, financial advice. We do not make any warranties regarding the completeness, reliability, or accuracy of this information. All investments involve risk, and past performance does not guarantee future results. We recommend consulting a financial advisor before making any investment decisions.
Victor Olanrewaju is a crypto analyst and reporter at CCN with deep roots in on-chain research and technical analysis. His crypto journey began in 2017, but it was the 2020 Uniswap airdrop that sparked a full-time pivot into the space.
With a foundation in copywriting, Victor honed his craft creating high-converting content for leading crypto brokers — most notably an XRP price prediction that ranked #1 on Google during the 2021 bull run.
He later joined AMBCrypto in 2022, where he combined storytelling with technical and on-chain analysis to cover key market narratives.
In 2024, he expanded his expertise at BeInCrypto, collaborating with analysts and using tools like Glassnode, Santiment, and IntoTheBlock to break down Bitcoin and altcoin trends.
At CCN, Victor covers the top cryptocurrencies, memecoins, macro shifts, blending real-time insights with deep-dive metrics.
He holds a Bachelor’s degree in Physics from the University of Ibadan, equipping him to simplify complex data for a wide audience. Follow his work or connect on LinkedIn or X.