Here’s Why Dogecoin Will Continue to Go Down | Credit: Hameem Sarwar
Share
Key Takeaways
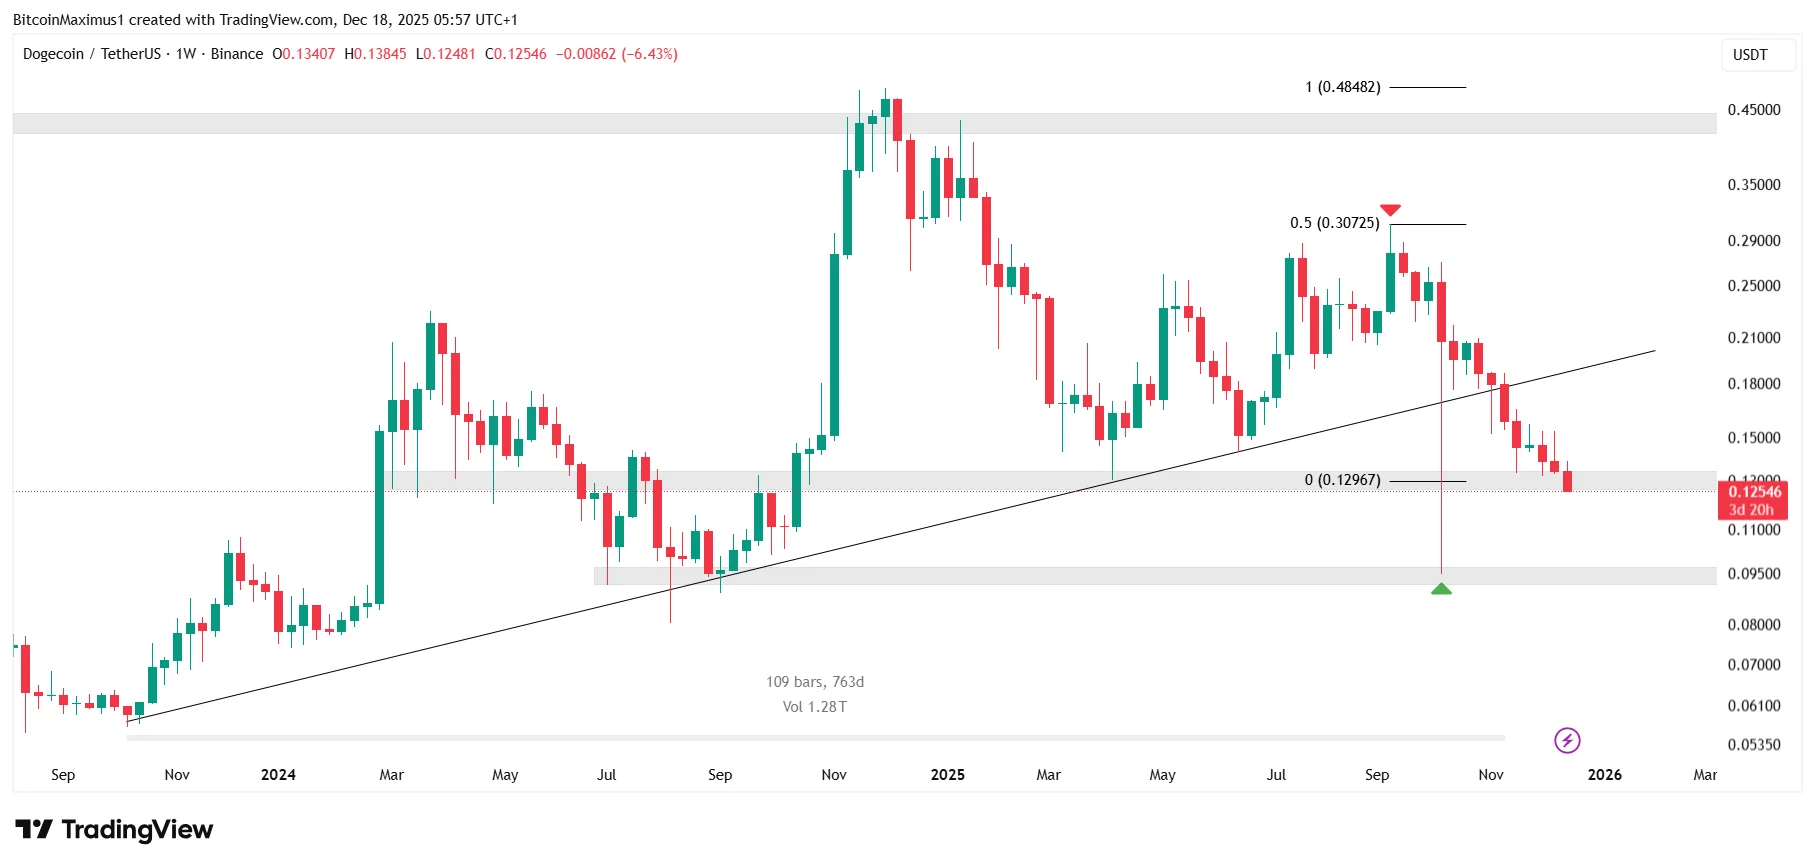
Dogecoin’s (DOGE) price broke down from a 763-day support trend line.
The DOGE price has nearly returned to its Oct. 10 wick low of $0.095.
Can Dogecoin rebound, or will its price continue to decline for the rest of the year?
Dogecoin is back under pressure, and this time the charts are flashing serious warning signs.
After holding a crucial support trend line for more than two years, DOGE has finally slipped below it, raising fears that the meme coin’s bull cycle may be over.
With price now testing key horizontal support and momentum firmly bearish, traders are asking the same question: why is Dogecoin going down, and is a deeper drop still ahead?
The support trend line had existed for the entire bull run, so the fact that it broke down is a strong signal that the bull cycle has ended.
Get These Top Crypto Casino Offers Now!
Sponsored
Disclosure
We sometimes use affiliate links in our content, when clicking on those we might receive a commission at no extra cost to you. By using this website you agree to our terms and conditions and privacy policy.
Dogecoin is sitting at a crossroads, but the technical analysis currently favors the bears.
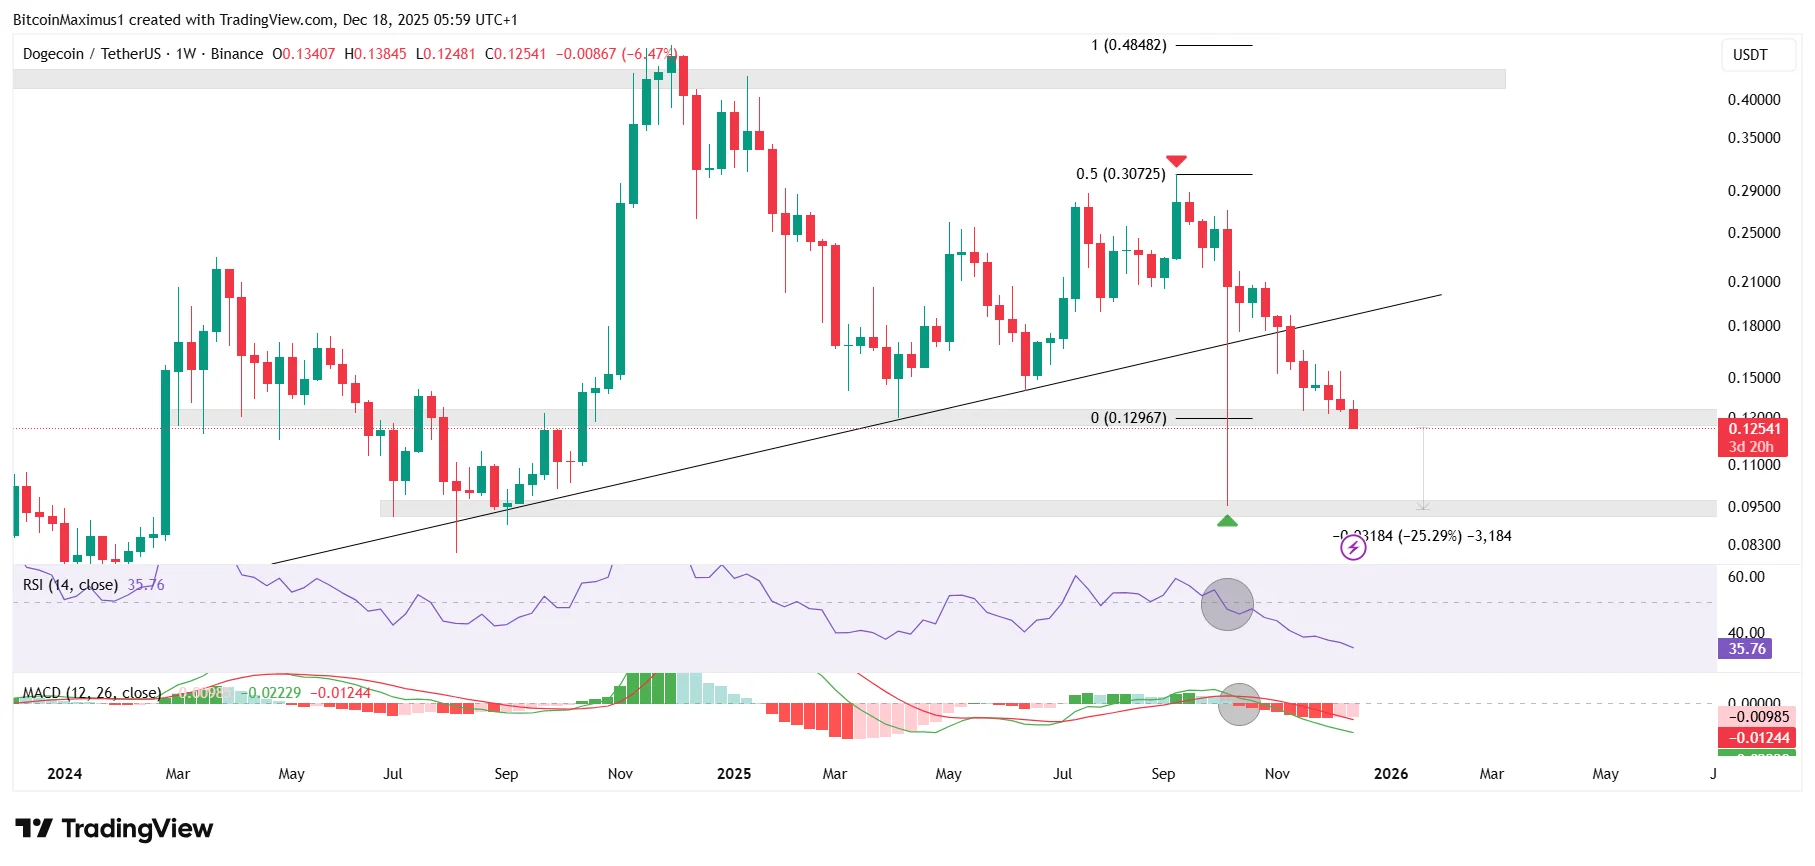
A breakdown from a multi-year support trend line, weakening momentum indicators, and a loss of key horizontal support all point to continued downside risk.
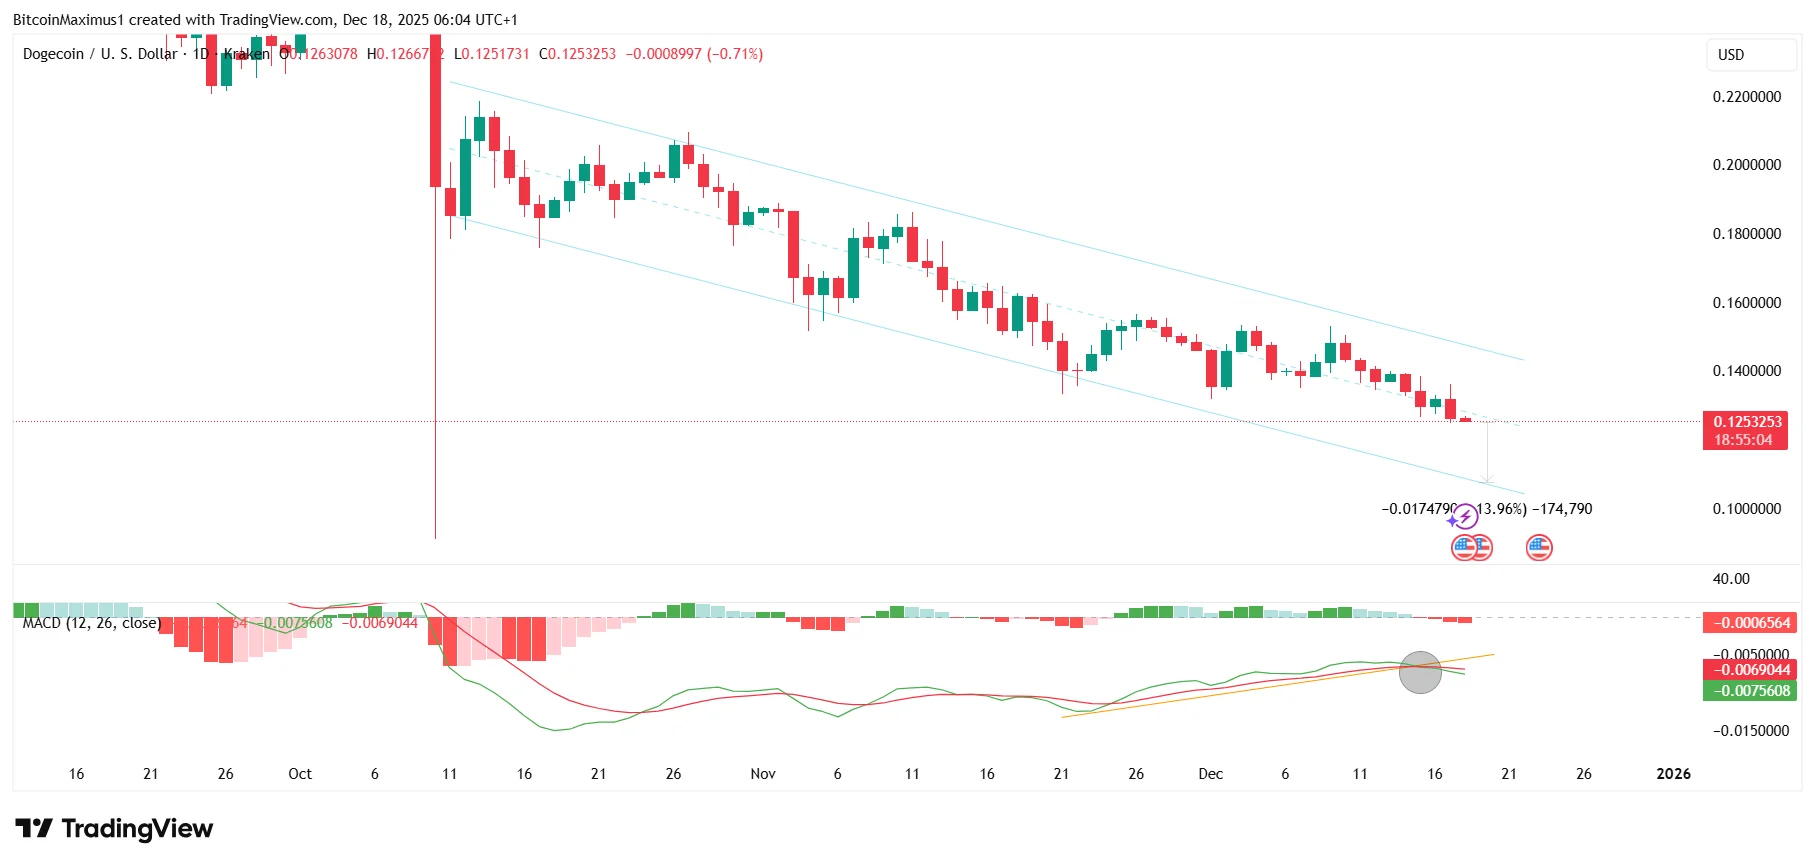
Unless DOGE quickly reclaims lost levels, the path of least resistance remains lower, with $0.105 and $0.095 the critical zones to watch.
For now, Dogecoin’s chart suggests that the downtrend may not be finished just yet.
Disclaimer:
The information provided in this article is for informational purposes only. It is not intended to be, nor should it be construed as, financial advice. We do not make any warranties regarding the completeness, reliability, or accuracy of this information. All investments involve risk, and past performance does not guarantee future results. We recommend consulting a financial advisor before making any investment decisions.
Valdrin Tahiri is a cryptocurrency analyst and reporter at CCN, specializing in technical analysis with a focus on Elliott Wave theory, on-chain metrics, and fundamental research. He brings over seven years of experience in the crypto space as both a trader and writer.
He discovered cryptocurrencies in 2017 while earning his MSc in Financial Markets at the Barcelona School of Economics, which sparked a deep interest in blockchain and market dynamics. Since then, he’s contributed to top crypto outlets like BeInCrypto and CoinGape.
Valdrin also served as Community Manager of BeInCrypto’s Telegram group for three years, helping grow it into one of the largest crypto communities worldwide. His expertise in market structure and price patterns allows him to break down complex trends into clear, actionable insights.
He’s published thousands of articles covering altcoins, Bitcoin cycles, and macro trends.