We sometimes use affiliate links in our content, when clicking on those we might receive a commission at no extra cost to you. By using this website you agree to our terms and conditions and privacy policy.
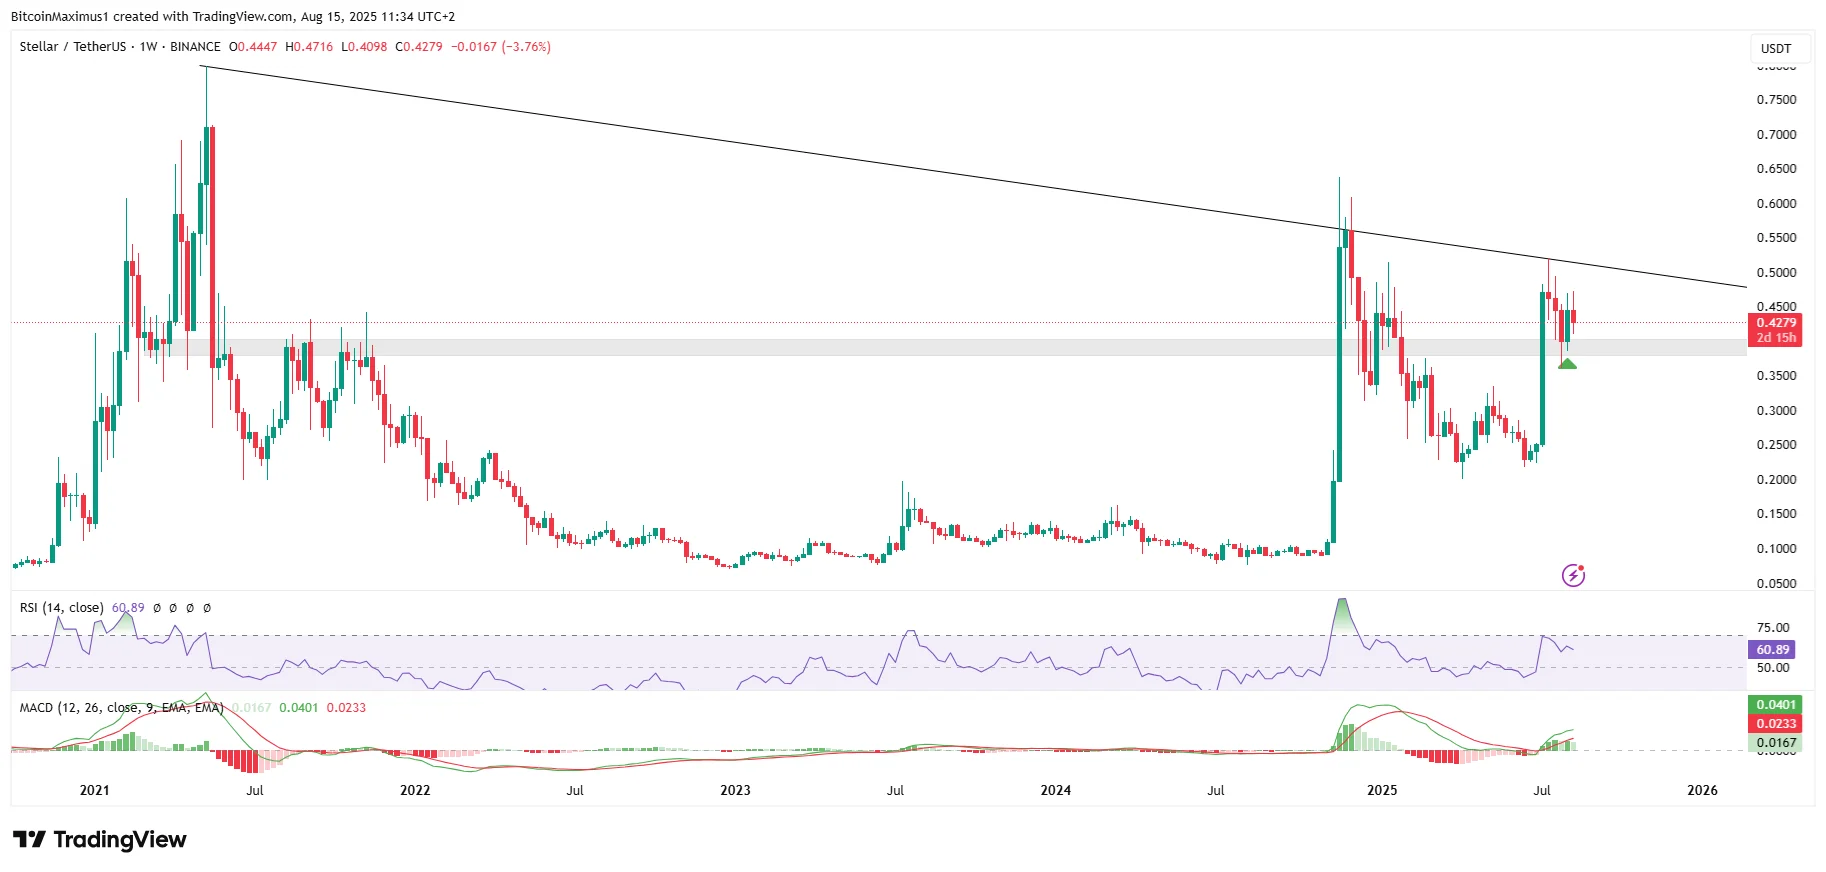
Last week, XLM bounced at the $0.40 horizontal support area (green icon), creating a bullish engulfing candlestick and stopping the crash on its tracks.
Currently, the XLM price is attempting to make another breakout attempt from the resistance trend line.
Momentum indicators support the breakout. The Relative Strength Index (RSI) is above 50, and the Moving Average Convergence/Divergence (MACD) is positive.
So, the XLM price prediction for the rest of 2025 is bullish as long as Stellar does not close below the $0.40 support area.
XLM Correction Over?
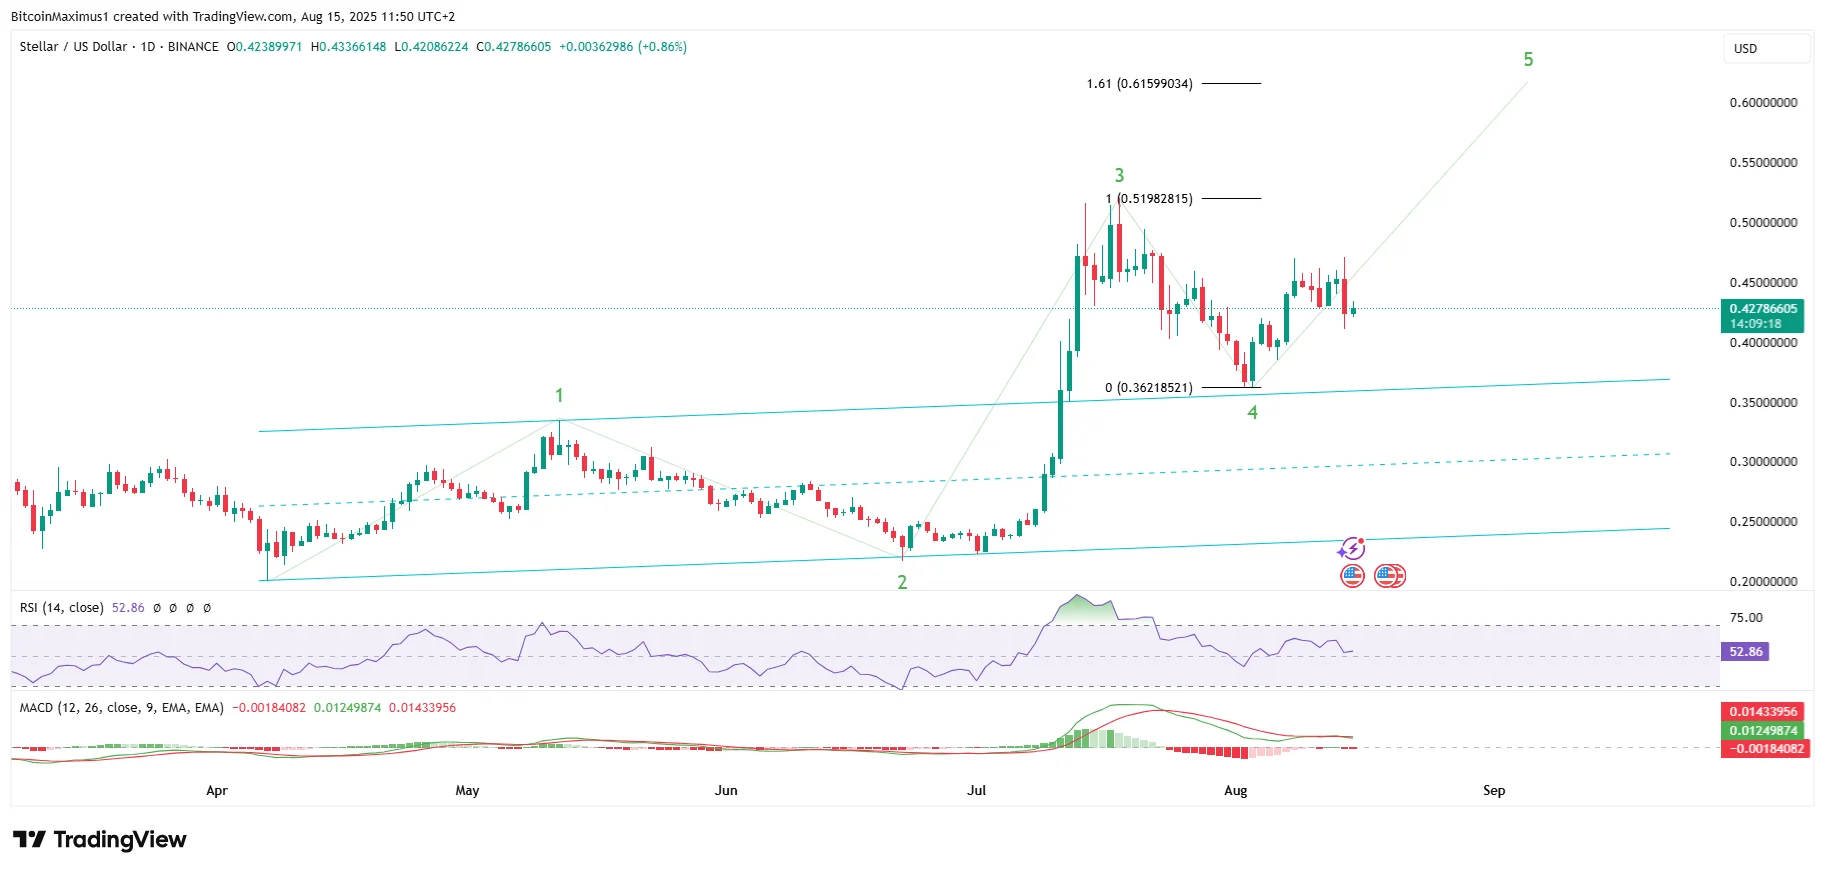
Stellar’s short-term count leans bullish but raises more questions than it answers.
The most likely count is that the price of XLM completed wave four in a five-wave upward movement with a fourth-wave pullback on Aug.3.
While the count shows no irregularities, the RSI and MACD are falling, casting some doubt about whether it will transpire.
Moreover, the count does not match the long-term movement. The first target for wave five is at $0.61, slightly above the long-term resistance trend line.
A breakout of a four-year trendline is likely to give a significant breakout, rather than a minor upward movement.
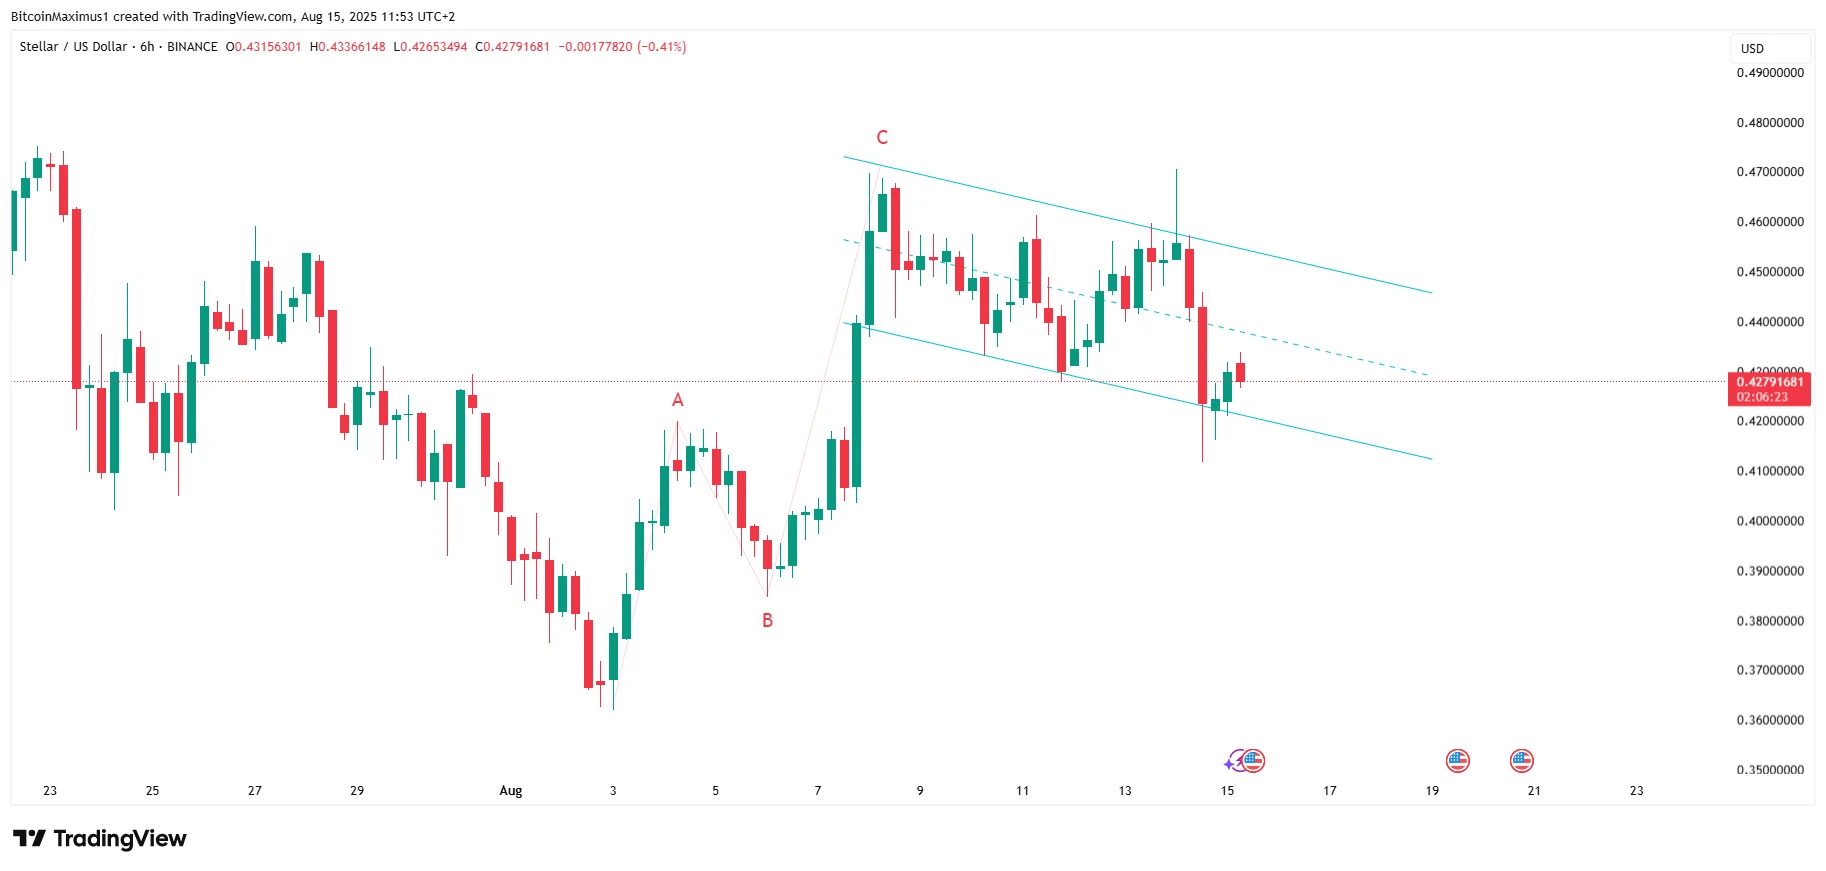
The short-term count’s incongruity with the long-term triangle raises questions about whether it is the correct count, and the six-hour chart further adds to the confusion.
Disclaimer:
The information provided in this article is for informational purposes only. It is not intended to be, nor should it be construed as, financial advice. We do not make any warranties regarding the completeness, reliability, or accuracy of this information. All investments involve risk, and past performance does not guarantee future results. We recommend consulting a financial advisor before making any investment decisions.
Valdrin Tahiri is a cryptocurrency analyst and reporter at CCN, specializing in technical analysis with a focus on Elliott Wave theory, on-chain metrics, and fundamental research. He brings over seven years of experience in the crypto space as both a trader and writer.
He discovered cryptocurrencies in 2017 while earning his MSc in Financial Markets at the Barcelona School of Economics, which sparked a deep interest in blockchain and market dynamics. Since then, he’s contributed to top crypto outlets like BeInCrypto and CoinGape.
Valdrin also served as Community Manager of BeInCrypto’s Telegram group for three years, helping grow it into one of the largest crypto communities worldwide. His expertise in market structure and price patterns allows him to break down complex trends into clear, actionable insights.
He’s published thousands of articles covering altcoins, Bitcoin cycles, and macro trends.