Why did the crypto market crash? | Credit: Veronica Cestari
Share
Key Takeaways
This week, the Total Crypto Market Cap (TOTALCAP) fell by 4%.
Altcoins have been hit much harder than Bitcoin during the drop.
Why is the crypto market down, and will the decline continue?
The crypto market is back on shaky ground, as the total market cap slipped more than 4%.
Altcoins led the plunge, with Ethereum (ETH) sliding over 10% from recent highs.
The big question now is: Is this just a bump in the road or the start of a deeper correction?
Why is Crypto Down Today?
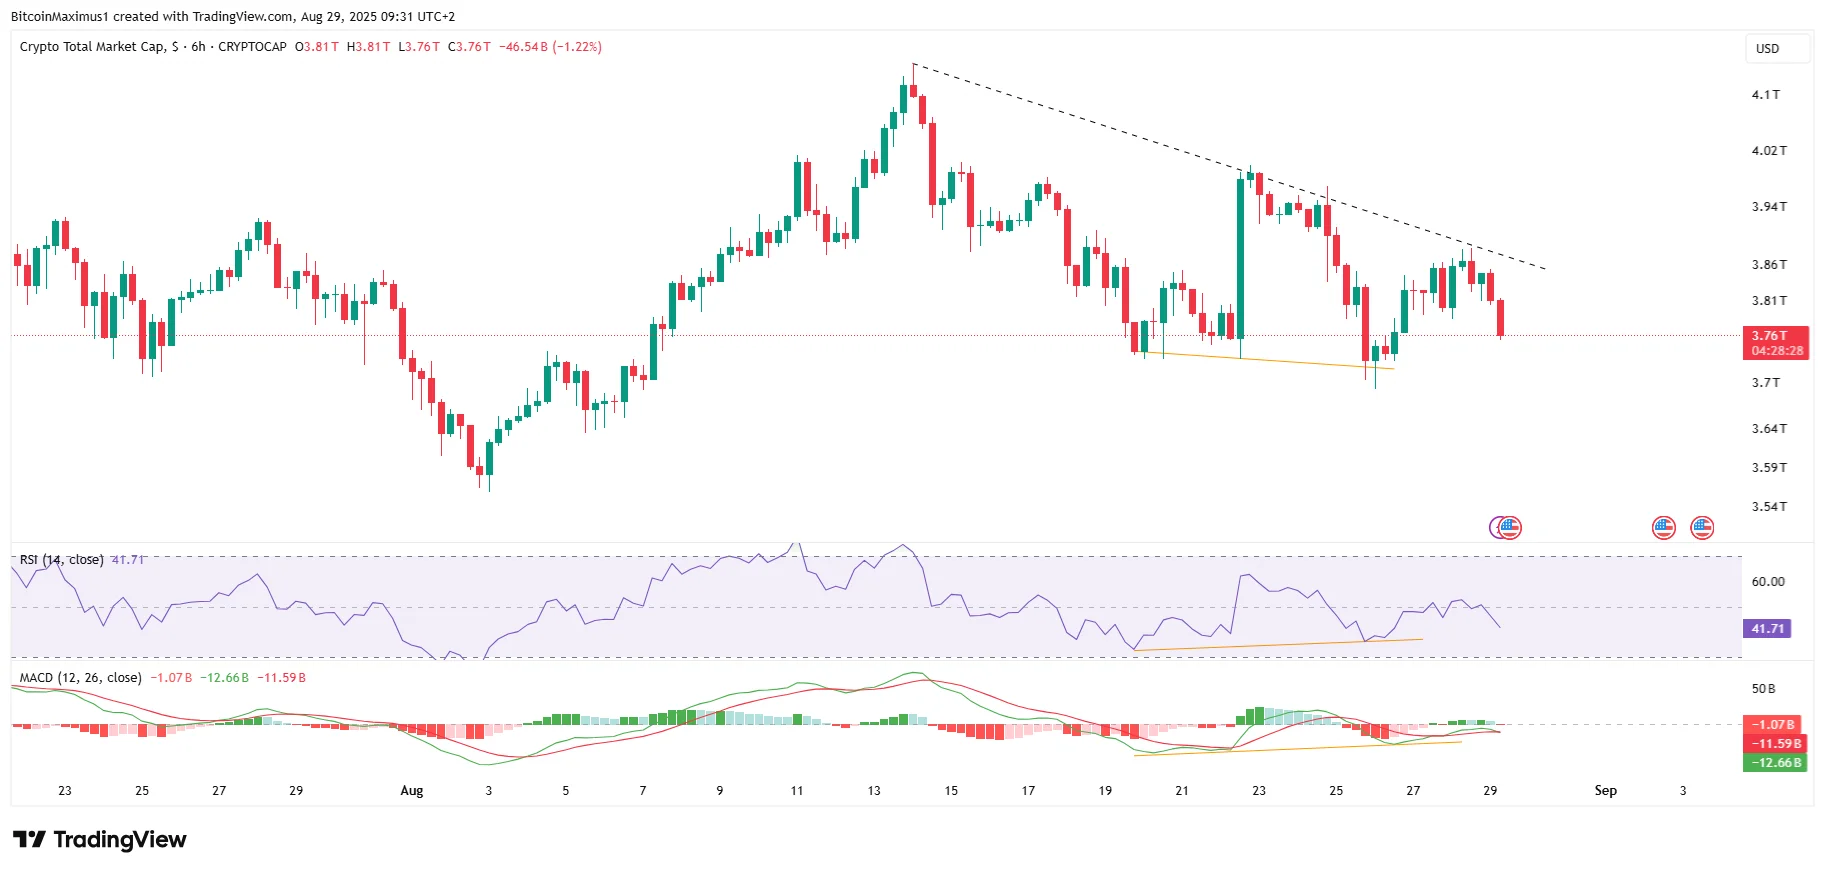
The crypto market is flashing red again, with signs pointing to a possible market top after TOTALCAP peaked at $4.17 trillion in August.
That peak left behind a long upper wick and a classic “shooting star” candlestick, an early warning that bullish momentum might be fading.
Get These Top Crypto Casino Offers Now!
Sponsored
Disclosure
We sometimes use affiliate links in our content, when clicking on those we might receive a commission at no extra cost to you. By using this website you agree to our terms and conditions and privacy policy.
The weakness didn’t stop there. What began as a minor dip the following week has now spiraled into a sharp crash, with more than two days left before the weekly close.
If selling pressure continues, the bearish candle could grow even larger, putting the next support levels at $3.47 trillion and $3.26 trillion, based on key Fibonacci retracements.
The technical picture is just as worrying as the charts. Bearish divergences are showing up in the Relative Strength Index (RSI) and the Moving Average Convergence Divergence (MACD).
If the RSI slips below 50 and the MACD confirms a bearish cross, it could solidify the case for more downside in the weeks ahead.
On the six-hour chart, TOTALCAP has swept its previous August low and created a bullish divergence in the RSI and MACD.
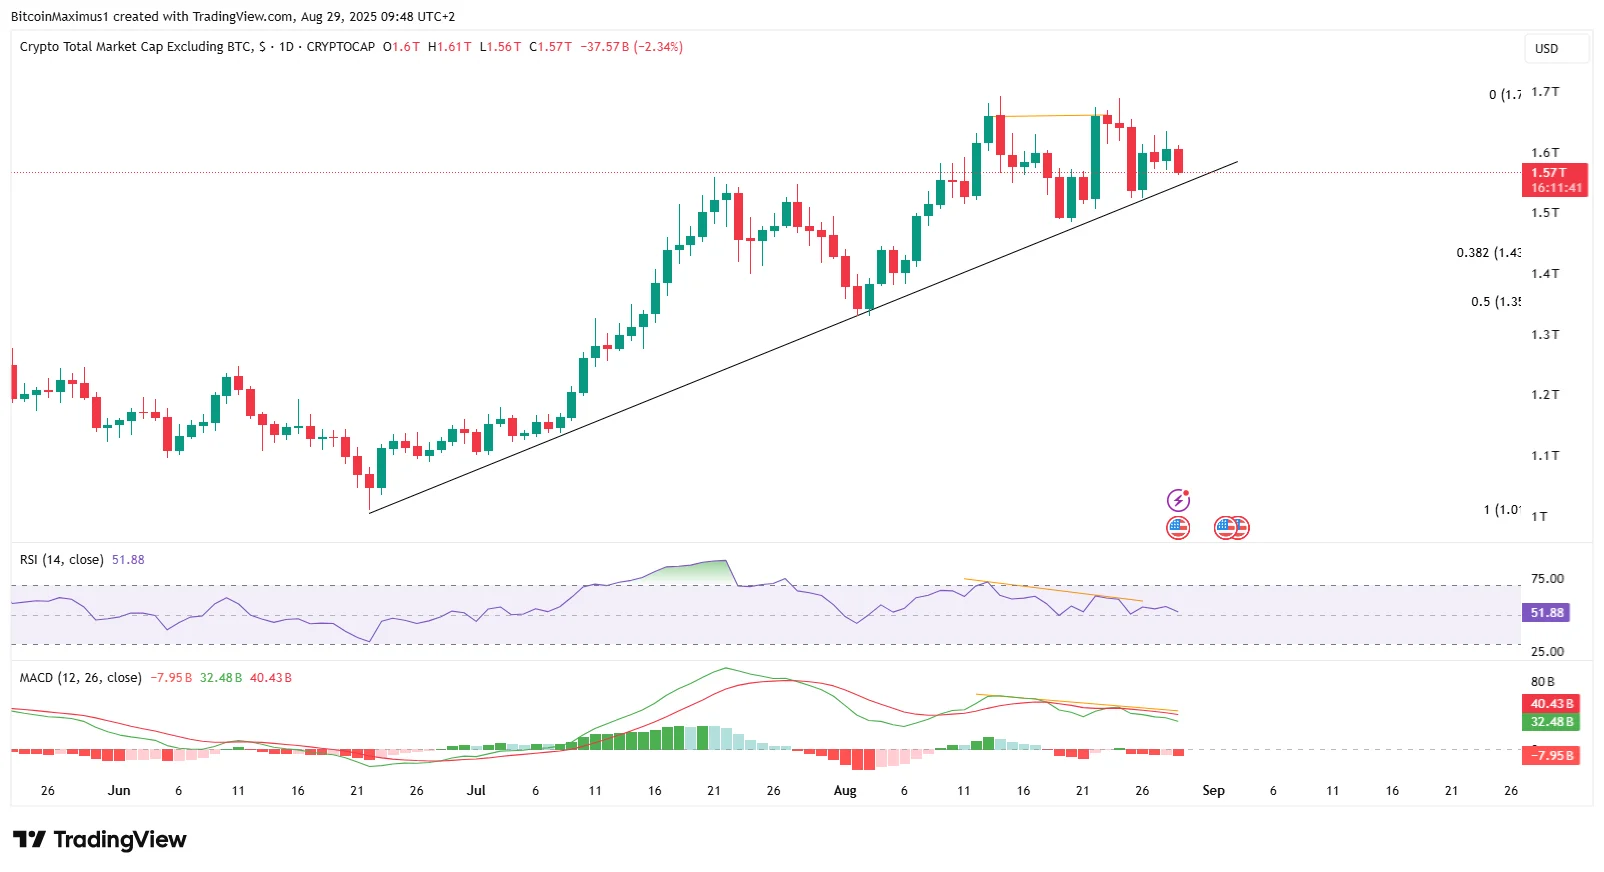
Once the support trend line breaks, the ALTCAP could fall to $1.43 trillion, and possibly $1.35 trillion, reaching the 0.382 and 0.5 Fibonacci retracement support levels.
Simultaneously, the RSI and MACD will likely decline below 50 and 0, confirming the bearish trends.
Ethereum Takes a Breather
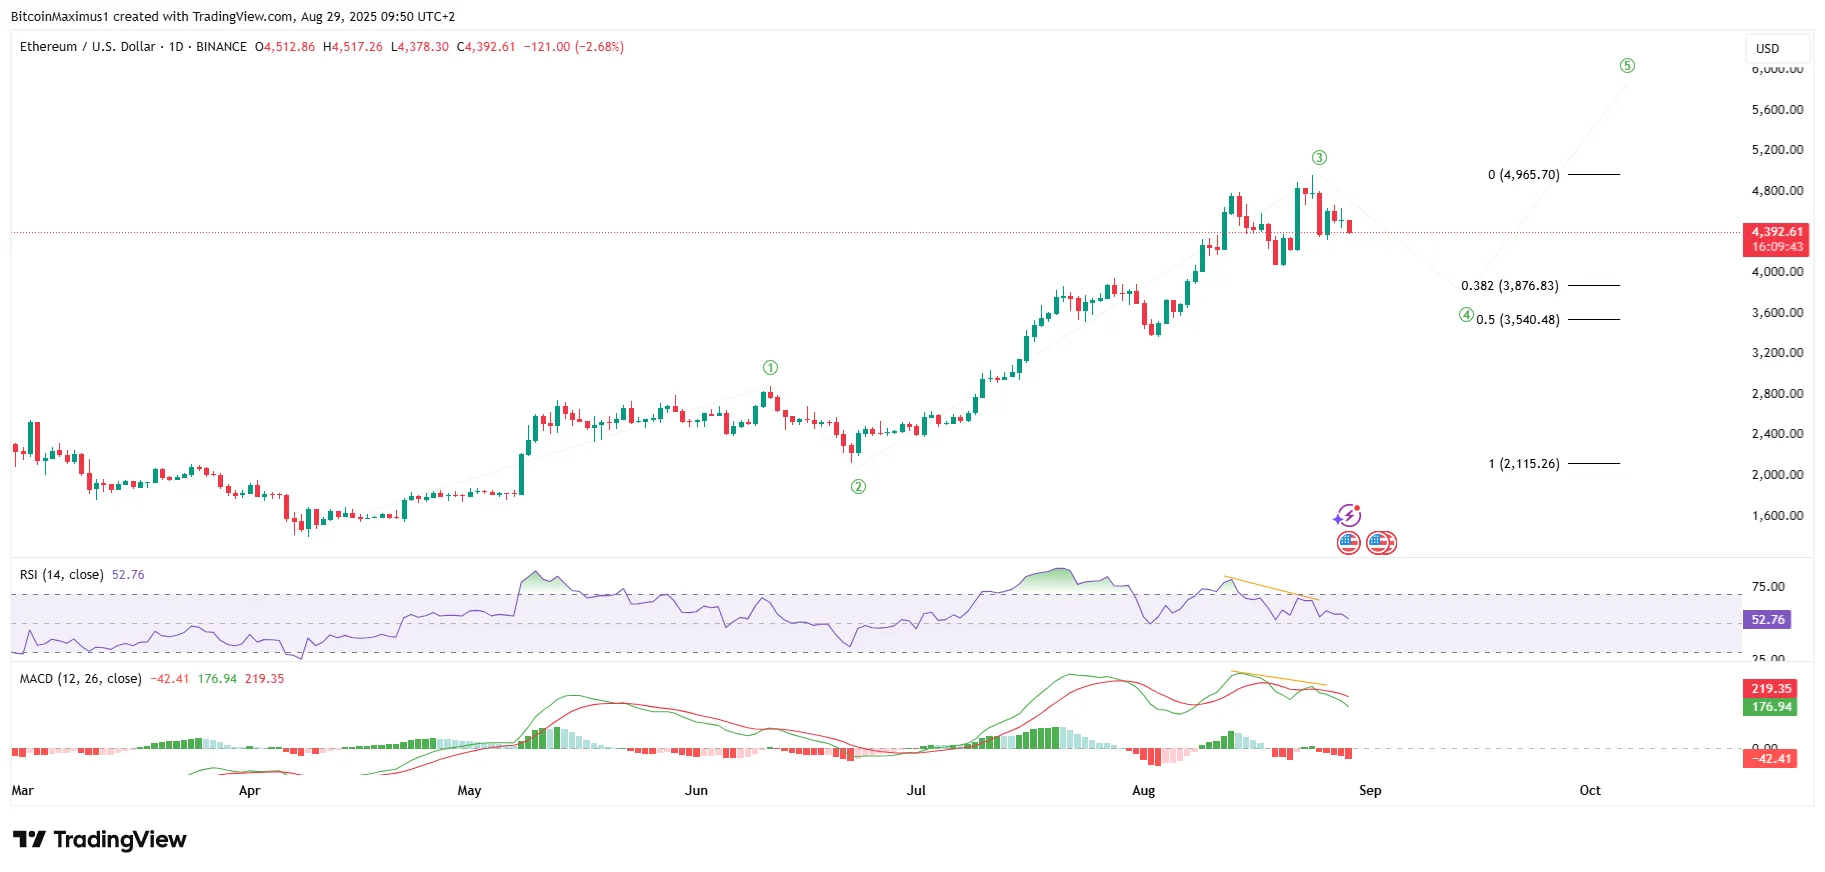
The Ethereum price movement, which has cooled off with a massive bearish engulfing candlestick, is the best illustration of why the crypto market is down.
After a brief bounce on Aug. 26, the price of Ethereum risks falling to new lows again today, dragging the market along with it.
Like the rest of the ALTCAP, Ethereum has created a double top pattern alongside bearish divergences.
Disclaimer:
The information provided in this article is for informational purposes only. It is not intended to be, nor should it be construed as, financial advice. We do not make any warranties regarding the completeness, reliability, or accuracy of this information. All investments involve risk, and past performance does not guarantee future results. We recommend consulting a financial advisor before making any investment decisions.
Valdrin Tahiri is a cryptocurrency analyst and reporter at CCN, specializing in technical analysis with a focus on Elliott Wave theory, on-chain metrics, and fundamental research. He brings over seven years of experience in the crypto space as both a trader and writer.
He discovered cryptocurrencies in 2017 while earning his MSc in Financial Markets at the Barcelona School of Economics, which sparked a deep interest in blockchain and market dynamics. Since then, he’s contributed to top crypto outlets like BeInCrypto and CoinGape.
Valdrin also served as Community Manager of BeInCrypto’s Telegram group for three years, helping grow it into one of the largest crypto communities worldwide. His expertise in market structure and price patterns allows him to break down complex trends into clear, actionable insights.
He’s published thousands of articles covering altcoins, Bitcoin cycles, and macro trends.