To power this move, the agency tapped Chainlink (LINK) and Pyth Network (PYTH), two of the leading decentralized oracle providers.
The news immediately sent both tokens higher, but while LINK’s rally quickly cooled, PYTH managed to hold its gains—helped in part by its smaller market cap and stronger sensitivity to bullish headlines.
Its ties to the Solana ecosystem, where SOL itself has shown resilience, may have also fueled the momentum.
With that backdrop, let’s turn to the charts and see where PYTH could be headed next.
Pyth Network Price Surges
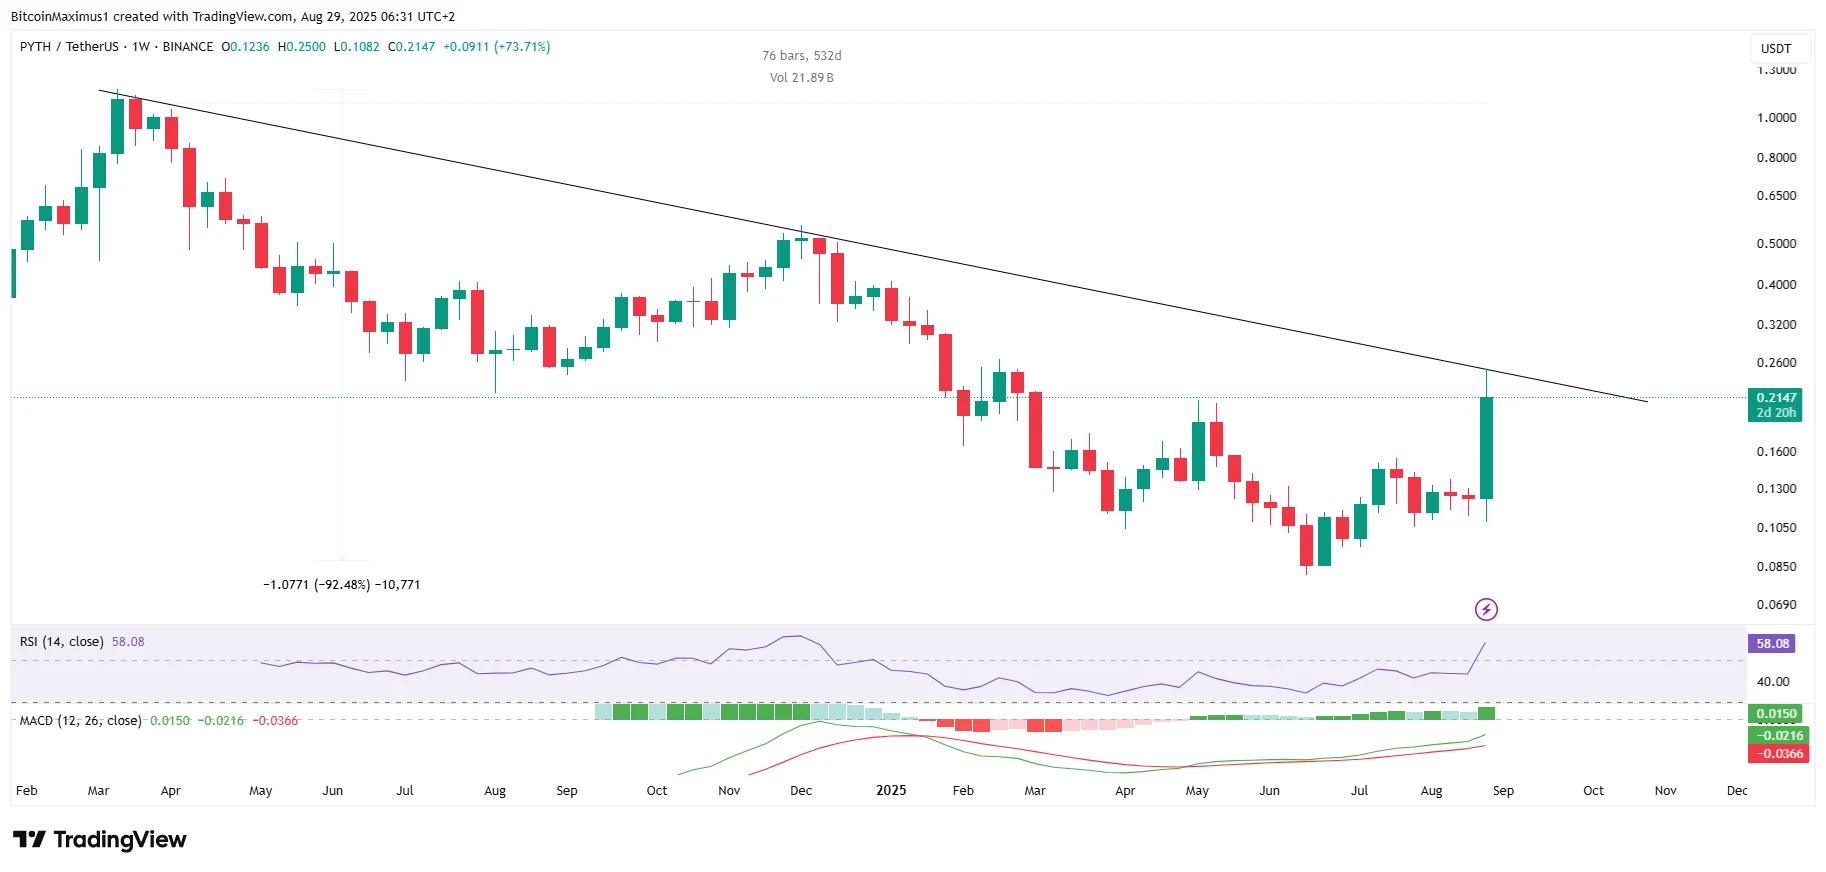
PYTH saw a sharp rally after its launch, briefly climbing above $1 in March 2024.
However, the momentum quickly evaporated, setting off a brutal 530-day downtrend that continues to weigh on the token.
Get These Top Crypto Casino Offers Now!
Sponsored
Disclosure
We sometimes use affiliate links in our content, when clicking on those we might receive a commission at no extra cost to you. By using this website you agree to our terms and conditions and privacy policy.
Momentum indicators support this scenario. The Relative Strength Index (RSI) crossed 50 while the Moving Average Convergence/Divergence (MACD) is nearly positive.
While these are both bullish signs, it is worth mentioning that the same thing happened at the previous touch of the resistance in December 2024 and did not lead to a breakout.
So, the long-term PYTH analysis does not confirm if the trend is bullish or bearish.
What’s Next for PYTH?
The short-term 4-hour chart provides more clarity, suggesting another upward movement will eventually occur.
According to the wave count, PYTH is in wave four of a five-wave upward movement that started on Aug. 2.
Wave three is usually the sharpest, and became even steeper after the positive news caused the price to rally.
The Pyth Network price is attempting to regain its footing today, spurred by the team’s post that the GDP data is already live.
However, PYTH is likely in wave four, which is corrective. Hence, it could touch the 0.382 Fibonacci retracement support level at $0.195 before rallying again.
If the move goes as predicted, the PYTH price will break out from its long-term diagonal resistance, and then return to validate it as support.
Final Thoughts
Pyth Network’s reaction to the positive U.S. Commerce Department news shows that smaller-cap cryptos can sustain momentum better than larger rivals like Chainlink.
While the long-term resistance remains a hurdle, bullish momentum indicators and the wave count suggest that PYTH may soon attempt a breakout.
If successful, PYTH could confirm a trend reversal and pave the way toward higher price targets in the coming months.
Disclaimer:
The information provided in this article is for informational purposes only. It is not intended to be, nor should it be construed as, financial advice. We do not make any warranties regarding the completeness, reliability, or accuracy of this information. All investments involve risk, and past performance does not guarantee future results. We recommend consulting a financial advisor before making any investment decisions.
Valdrin Tahiri is a cryptocurrency analyst and reporter at CCN, specializing in technical analysis with a focus on Elliott Wave theory, on-chain metrics, and fundamental research. He brings over seven years of experience in the crypto space as both a trader and writer.
He discovered cryptocurrencies in 2017 while earning his MSc in Financial Markets at the Barcelona School of Economics, which sparked a deep interest in blockchain and market dynamics. Since then, he’s contributed to top crypto outlets like BeInCrypto and CoinGape.
Valdrin also served as Community Manager of BeInCrypto’s Telegram group for three years, helping grow it into one of the largest crypto communities worldwide. His expertise in market structure and price patterns allows him to break down complex trends into clear, actionable insights.
He’s published thousands of articles covering altcoins, Bitcoin cycles, and macro trends.