The ATOM price has created a double bottom pattern between September 2024 and March 2025.
The double bottom is a bullish pattern, leading to bullish trend reversals most of the time.
ATOM created it at the critical level of $4, a breakdown below which could take the price to lows not seen since 2020.
Furthermore, the second bottom nearly created a bullish engulfing candlestick (green icon), though ATOM barely failed to close above the previous week’s high.
Technical indicators are bullish, supporting the possibility of a trend reversal.
The Relative Strength Index (RSI) and Moving Average Convergence/Divergence (MACD) generated bullish divergences (orange) alongside the pattern.
These make it more likely that the double bottom will materialize, taking the ATOM price toward the $6.50-$8 resistance.
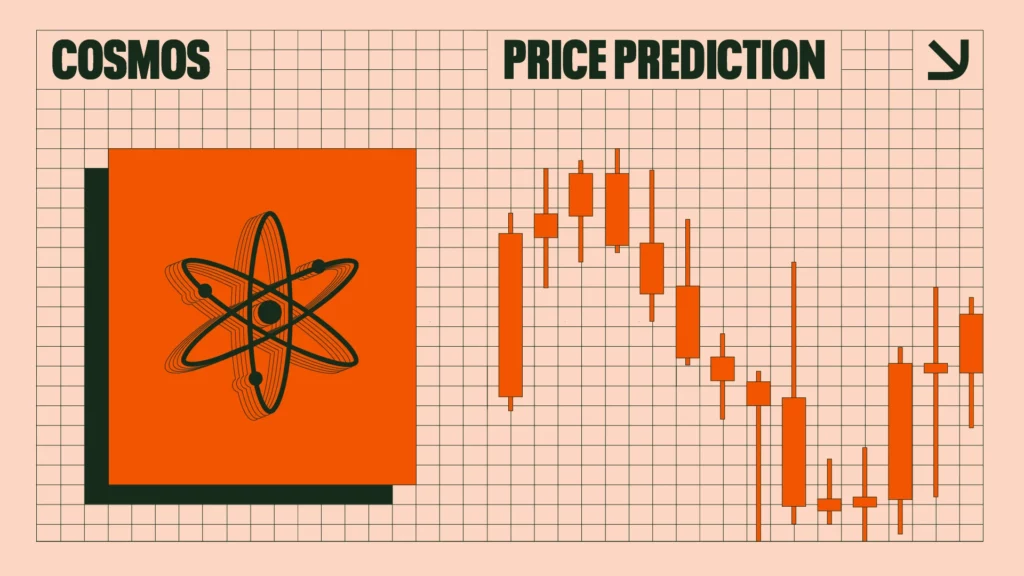
ATOM Reclaims Support
ATOM’s daily time frame gives a positive outlook. Unlike the rest of the crypto market, ATOM created a bullish, engulfing candlestick on April 3 (green icon), reclaiming the $4.30 support area.
With the reclaim, the price confirmed that the March breakdown was a deviation, not a legitimate downward movement.
Moreover, ATOM may have created an inverse head and shoulders pattern, where the bounce forms the right shoulders.
This bullish pattern often leads to trend reversals like the double bottom. Technical indicators give mixed readings. The RSI is 50, while the MACD is 0.
However, the price action in both time frames is sufficient for a bullish ATOM prediction.
If ATOM breaks out from the pattern’s neckline at $5, it could increase to the next horizontal resistance and $6.30, close to the lower limit of the long-term resistance.
ATOM Breakout Incoming
The Cosmos price defied the crypto market yesterday after eToro announced it would add the coin to its staking options.
ATOM has created bullish patterns in the long and short term. A breakout above $5 will confirm the trend reversal.
If one happens, the first resistance will be $6.30, followed by resistances at $6.50-$8.
Disclaimer:
The information provided in this article is for informational purposes only. It is not intended to be, nor should it be construed as, financial advice. We do not make any warranties regarding the completeness, reliability, or accuracy of this information. All investments involve risk, and past performance does not guarantee future results. We recommend consulting a financial advisor before making any investment decisions.
Valdrin Tahiri is a cryptocurrency analyst and reporter at CCN, specializing in technical analysis with a focus on Elliott Wave theory, on-chain metrics, and fundamental research. He brings over seven years of experience in the crypto space as both a trader and writer.
He discovered cryptocurrencies in 2017 while earning his MSc in Financial Markets at the Barcelona School of Economics, which sparked a deep interest in blockchain and market dynamics. Since then, he’s contributed to top crypto outlets like BeInCrypto and CoinGape.
Valdrin also served as Community Manager of BeInCrypto’s Telegram group for three years, helping grow it into one of the largest crypto communities worldwide. His expertise in market structure and price patterns allows him to break down complex trends into clear, actionable insights.
He’s published thousands of articles covering altcoins, Bitcoin cycles, and macro trends.