Celestia’s price is forecasted to reach as high as $6.24 by the end of 2025
The price predictions suggest a potential TIA correction by the end of 2026.
TIA has risen 23% from its all-time low and could rise higher in the short term.
Contrary to its performance some weeks back, Celestia (TIA) has seen a notable price increase today. Yet, the altcoin is still far from closing in on its all-time high.
Despite that, it appears that TIA has started its slow recovery, which could mean it will end the year at a higher value.
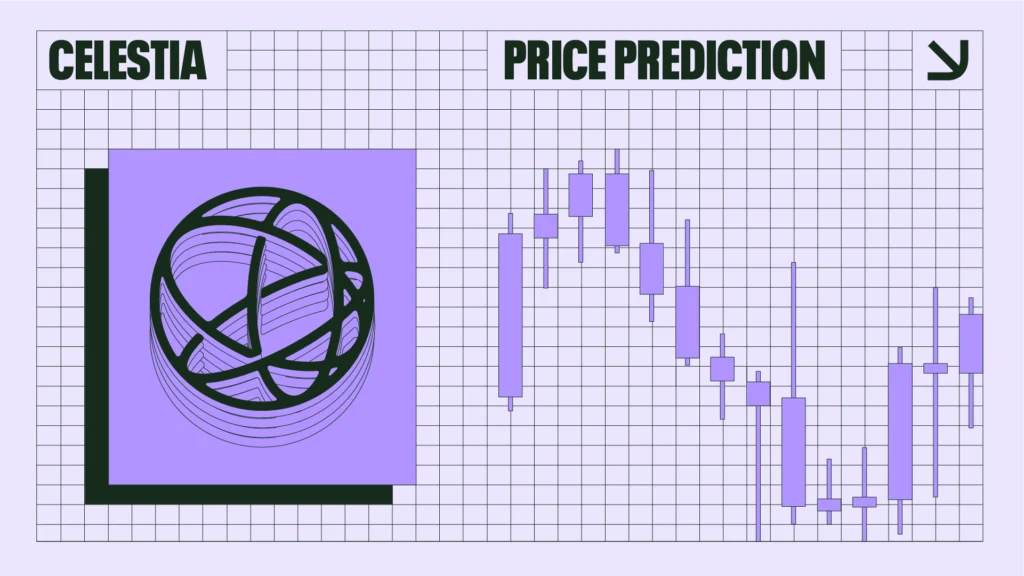
In this piece, CCN analyzes the potential Celestia price prediction from 2025 to 2030.
Celestia Price Prediction
Let’s look at the TIA price predictions made by CCN on July 5, 2025. This analysis considers the technical outlook, fundamentals, and expected macro events to determine the forecasts for 2025, 2026, and 2030.
However, note that some predictions might be altered if the broader market changes and volatility spikes.
Minimum TIA Price Prediction
Average TIA Price Prediction
Maximum TIA Price Prediction
2025
$0.95
$2.43
$6.24
2026
$0.47
$0.74
$1.20
2030
$3.40
$7.93
$15.89
Celestia Price Prediction for 2025
Before this year ends, TIA might recover from its all-time low, especially around the fourth quarter. By that time, the Federal Reserve may have cut interest rates, which could drive higher demand for the altcoins. The Celestia price prediction could see it rise to $6.24.
At the minimum, TIA’s price might decline to $0.95, while the average price prediction could be $2.43.
Try Our Recommended Crypto Exchanges
Sponsored
Disclosure
We sometimes use affiliate links in our content, when clicking on those we might receive a commission at no extra cost to you. By using this website you agree to our terms and conditions and privacy policy.
2026 might not be as bullish for TIA as the cryptocurrency could trade between $0.47 and $1.20
Celestia Price Prediction for 2030
In 2030, TIA’s price might attempt to reach its all-time high. However, that might not happen, but the cryptocurrency might get close to it and trade at $15.89.
Should the market condition be bearish, Celestia’s price might drop to $3.40.
TIA Price Analysis
On the weekly chart, Celestia’s price has formed lower highs and lower lows, turning this into a falling wedge. Despite the bullish pattern formed, the Moving Average Convergence Divergence (MACD) is at the zero line, indicating a stable momentum.
For now, TIA’s price might keep trading sideways. However, in the long run, it might break above the upper trendline and possibly break the resistance at $3.15 before the year ends.
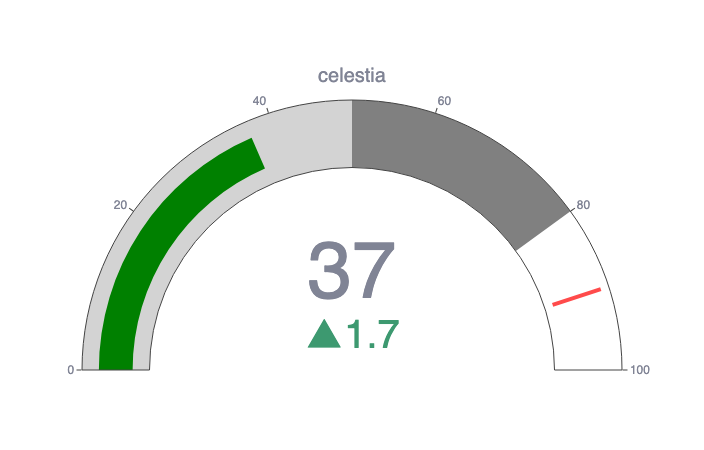
The CCN Strength Index combines an array of advanced market signals to measure the strength of individual cryptocurrencies over the last 30 days.
Every day, it assigns a strength score, ranging from 0 to 100, to the top 500 assets by market capitalization on CoinMarketCap, focusing on both trend direction and the intensity of price movements.
0 to 24: Assets exhibit significant weakness, showing signs of sustained downtrend behavior.
25 to 35: The price tends to move within stable bounds with minimal volatility.
36 to 49: Assets begin a stable uptrend without strong surges.
50 to 59: Consistent growth with moderate price advances, building momentum.
60+: Sharp price movements and high demand indicate more substantial volatility and trend shifts.
The index dynamically adapts to rapid changes. For example, an asset experiencing a 100% increase within a short timeframe would see a sharp jump in its score to reflect the intensity of the rise.
However, should that asset stabilize at this new price level, the score will gradually taper down and align with the dampened momentum as the movement normalizes. The same principle applies to rapid declines: a sudden drop will spike the score downward, but the score will slowly adjust back up as volatility decreases.
We looked at the TIA price history and found the times when the price was at its lowest across certain days, months, and quarters in the year, indicating the best times to buy Celestia.
Day of the Week
Saturday
Week
47
Month
November
Quarter
Fourth
Celestia Price History
Time period
Celestia price
Last week (June 30, 2025)
$1.40
Previous month (June 7, 2024)
$1.95
Three months ago (April 7, 2025)
$2.47
Previous year (July 7, 2024)
$5.60
Launch price (Oct. 31, 2023)
$2.03
All-time high (Feb. 10, 2024)
$20.85
All-time low (June 22, 2025)
$1.32
Celestia Supply and Distribution
Supply and distribution
Figures
Total supply
1,130,277,698
Circulating supply as of Jan. 23, 2024
700,217,947(68.32% of total supply)
From the Celestia Whitepaper
In its technical documentation or whitepaper, Celestia says its LazyLedger ledger is designed to make things quicker.
It says: “As the core function of the consensus system of a distributed ledger is to order transactions and ensure their availability, consensus participants do not necessarily need to be concerned with the contents of those transactions. This reduces the problem of block verification to data availability verification, which users can achieve probabilistically with sub-linear complexity without downloading the whole block. The amount of resources necessary to reach a consensus can thus be lower. This is because transaction validity rules can be decoupled from consensus rules.”
What Is Celestia?
The Celestia platform helps people build their blockchains. It does so by using a modular approach to blockchain creation. In other words, people can create the parts of the blockchain they need rather than having one monolithic blockchain. Different blockchains created with Celestia perform separate functions, which theoretically means they can carry out their tasks quickly.
It uses a program called LazyLedger to help it do this.
Celestia is based on the Cosmos (ATOM) blockchain and is powered by the TIA token.
How Celestia Works
Celestia’s chains are called sovereign roll-ups. They “are convenient to launch like layer 2s with the added sovereignty that layer 1s enjoy.”
The TIA token pays for transactions on the network, and holders have the right to vote on changes to Celestia. People can also buy, sell, and trade it on exchanges.
Because Celestia is currently based on the Cosmos blockchain, it is a token rather than a coin. You might see references to things like a Celestia coin price prediction, but technically speaking, these are wrong.
Is Celestia a Good Investment?
It is hard to say. The idea behind Celestia is interesting, and it has won some influential support in the run-up to its launch. However, the way that Celestia releases TIA regularly could cause the token to underperform compared with the overall crypto market since its October 2023 launch.
We will have to see where the predicted upturn will take place.
As always with crypto, you should research before deciding whether or not to invest in TIA.
Will Celestia go up or down?
No one can tell right now. While the Celestia crypto price predictions are primarily optimistic, price predictions have a well-earned reputation for being wrong. Keep in mind that prices can and do go down and up.
Should I invest in Celestia?
Before you decide whether or not to invest in Celestia, you will have to do your research, not only on TIA but on other related coins and tokens such as Optimism (OP). Either way, you must also ensure you never invest more money than you can afford to lose.
As of July 7, 2025, about 700.21 million TIA were in circulation out of a total supply of just over one billion.
Will Celestia reach $100?
It could do, but not for a while. Price predictions based on technical analysis don’t expect it to reach a triple-figure valuation before at least the 2030s.
Keep in mind that TIA has never traded at $100.
What is Celestia used for?
TIA token holders can vote on changes to the Celestia network. People can also buy, sell, and trade it on exchanges.
Disclaimer:
The information provided in this article is for informational purposes only. It is not intended to be, nor should it be construed as, financial advice. We do not make any warranties regarding the completeness, reliability, or accuracy of this information. All investments involve risk, and past performance does not guarantee future results. We recommend consulting a financial advisor before making any investment decisions.
Victor Olanrewaju is a crypto analyst and reporter at CCN with deep roots in on-chain research and technical analysis. His crypto journey began in 2017, but it was the 2020 Uniswap airdrop that sparked a full-time pivot into the space.
With a foundation in copywriting, Victor honed his craft creating high-converting content for leading crypto brokers — most notably an XRP price prediction that ranked #1 on Google during the 2021 bull run.
He later joined AMBCrypto in 2022, where he combined storytelling with technical and on-chain analysis to cover key market narratives.
In 2024, he expanded his expertise at BeInCrypto, collaborating with analysts and using tools like Glassnode, Santiment, and IntoTheBlock to break down Bitcoin and altcoin trends.
At CCN, Victor covers the top cryptocurrencies, memecoins, macro shifts, blending real-time insights with deep-dive metrics.
He holds a Bachelor’s degree in Physics from the University of Ibadan, equipping him to simplify complex data for a wide audience. Follow his work or connect on LinkedIn or X.