BTC remains strong, with on-chain signals pointing to a rebound | Credit: Derek Fenech
Share
Key Takeaways
Bitcoin’s MVRV bands indicate that the coin remains in a mid-cycle growth phase.
$3.2 billion stablecoin inflows hint at rising buying power on exchanges.
Triple-bottom is near $108,703, which signals accumulation and rebound.
Bitcoin (BTC)’s price faced another setback today, as it slid below $112,000. Earlier in the week, the coin retested the $115,000 resistance after a weekend marred by billion-dollar liquidations.
That recovery reignited confidence in the market, suggesting that the wipeout was a necessary cleansing. Hence, Bitcoin’s price is expected to reach new highs.
While that has not happened, this analysis reveals why today’s recent decline might not last. Instead, BTC might head toward a higher value.
Bitcoin Remains Far From Overheated
To begin with, CCN analyzed Bitcoin’s Market Value to Realized Value (MVRV) pricing bands. This is a critical on-chain metric for assessing the market’s current position in the broader cycle.
These bands help identify price zones where Bitcoin historically experiences holders’ behavior, either through mass profit-taking when unrealized gains are high or panic selling when unrealized losses dominate.
Get These Top Crypto Casino Offers Now!
Sponsored
Disclosure
We sometimes use affiliate links in our content, when clicking on those we might receive a commission at no extra cost to you. By using this website you agree to our terms and conditions and privacy policy.
At press time, the 2.4x Realized Price (RP) — a level historically aligned with major cycle tops — sits around $131,933.
Meanwhile, Bitcoin’s current Realized Price is approximately $54,972, indicating that the market is trading well below the overheated zone.
This wide gap between the MVRV multiple and Bitcoin’s spot price suggests that BTC remains in a mid-cycle growth phase, rather than an overheated blow-off stage.
In past cycles, such conditions have preceded extended bullish momentum, giving Bitcoin’s price room to rally.
Therefore, as it stands, Bitcoin’s price looks ready to hold above the critical $100,000 threshold. For some time, this level has evolved from a resistance zone into a potential base of support.
If this structure holds, BTC could continue climbing while remaining within the current MVRV band range, signaling that the market still has ample upside potential before hitting a possible cycle top.
Fresh Capital Enters Exchanges
Adding to this bullish outlook, on-chain data shows a rise in stablecoin inflows.
As of this writing, approximately $3.2 billion worth of USDT and USDC have been transferred to exchanges since the recent market correction — a strong indication of fresh buying power.
Historically, this behavior precedes accumulation phases, as traders position themselves to buy the dip ahead of a broader recovery.
From the look of things, market participants seem confident that the upcoming Consumer Price Index (CPI) report will show cooling inflation, potentially prompting a dovish response from policymakers.
If that turns out to be the case, liquidity could increase, risk appetite may strengthen, and Bitcoin’s price might resume its rally, targeting new highs before the end of the year.
BTC Price Analysis: Higher
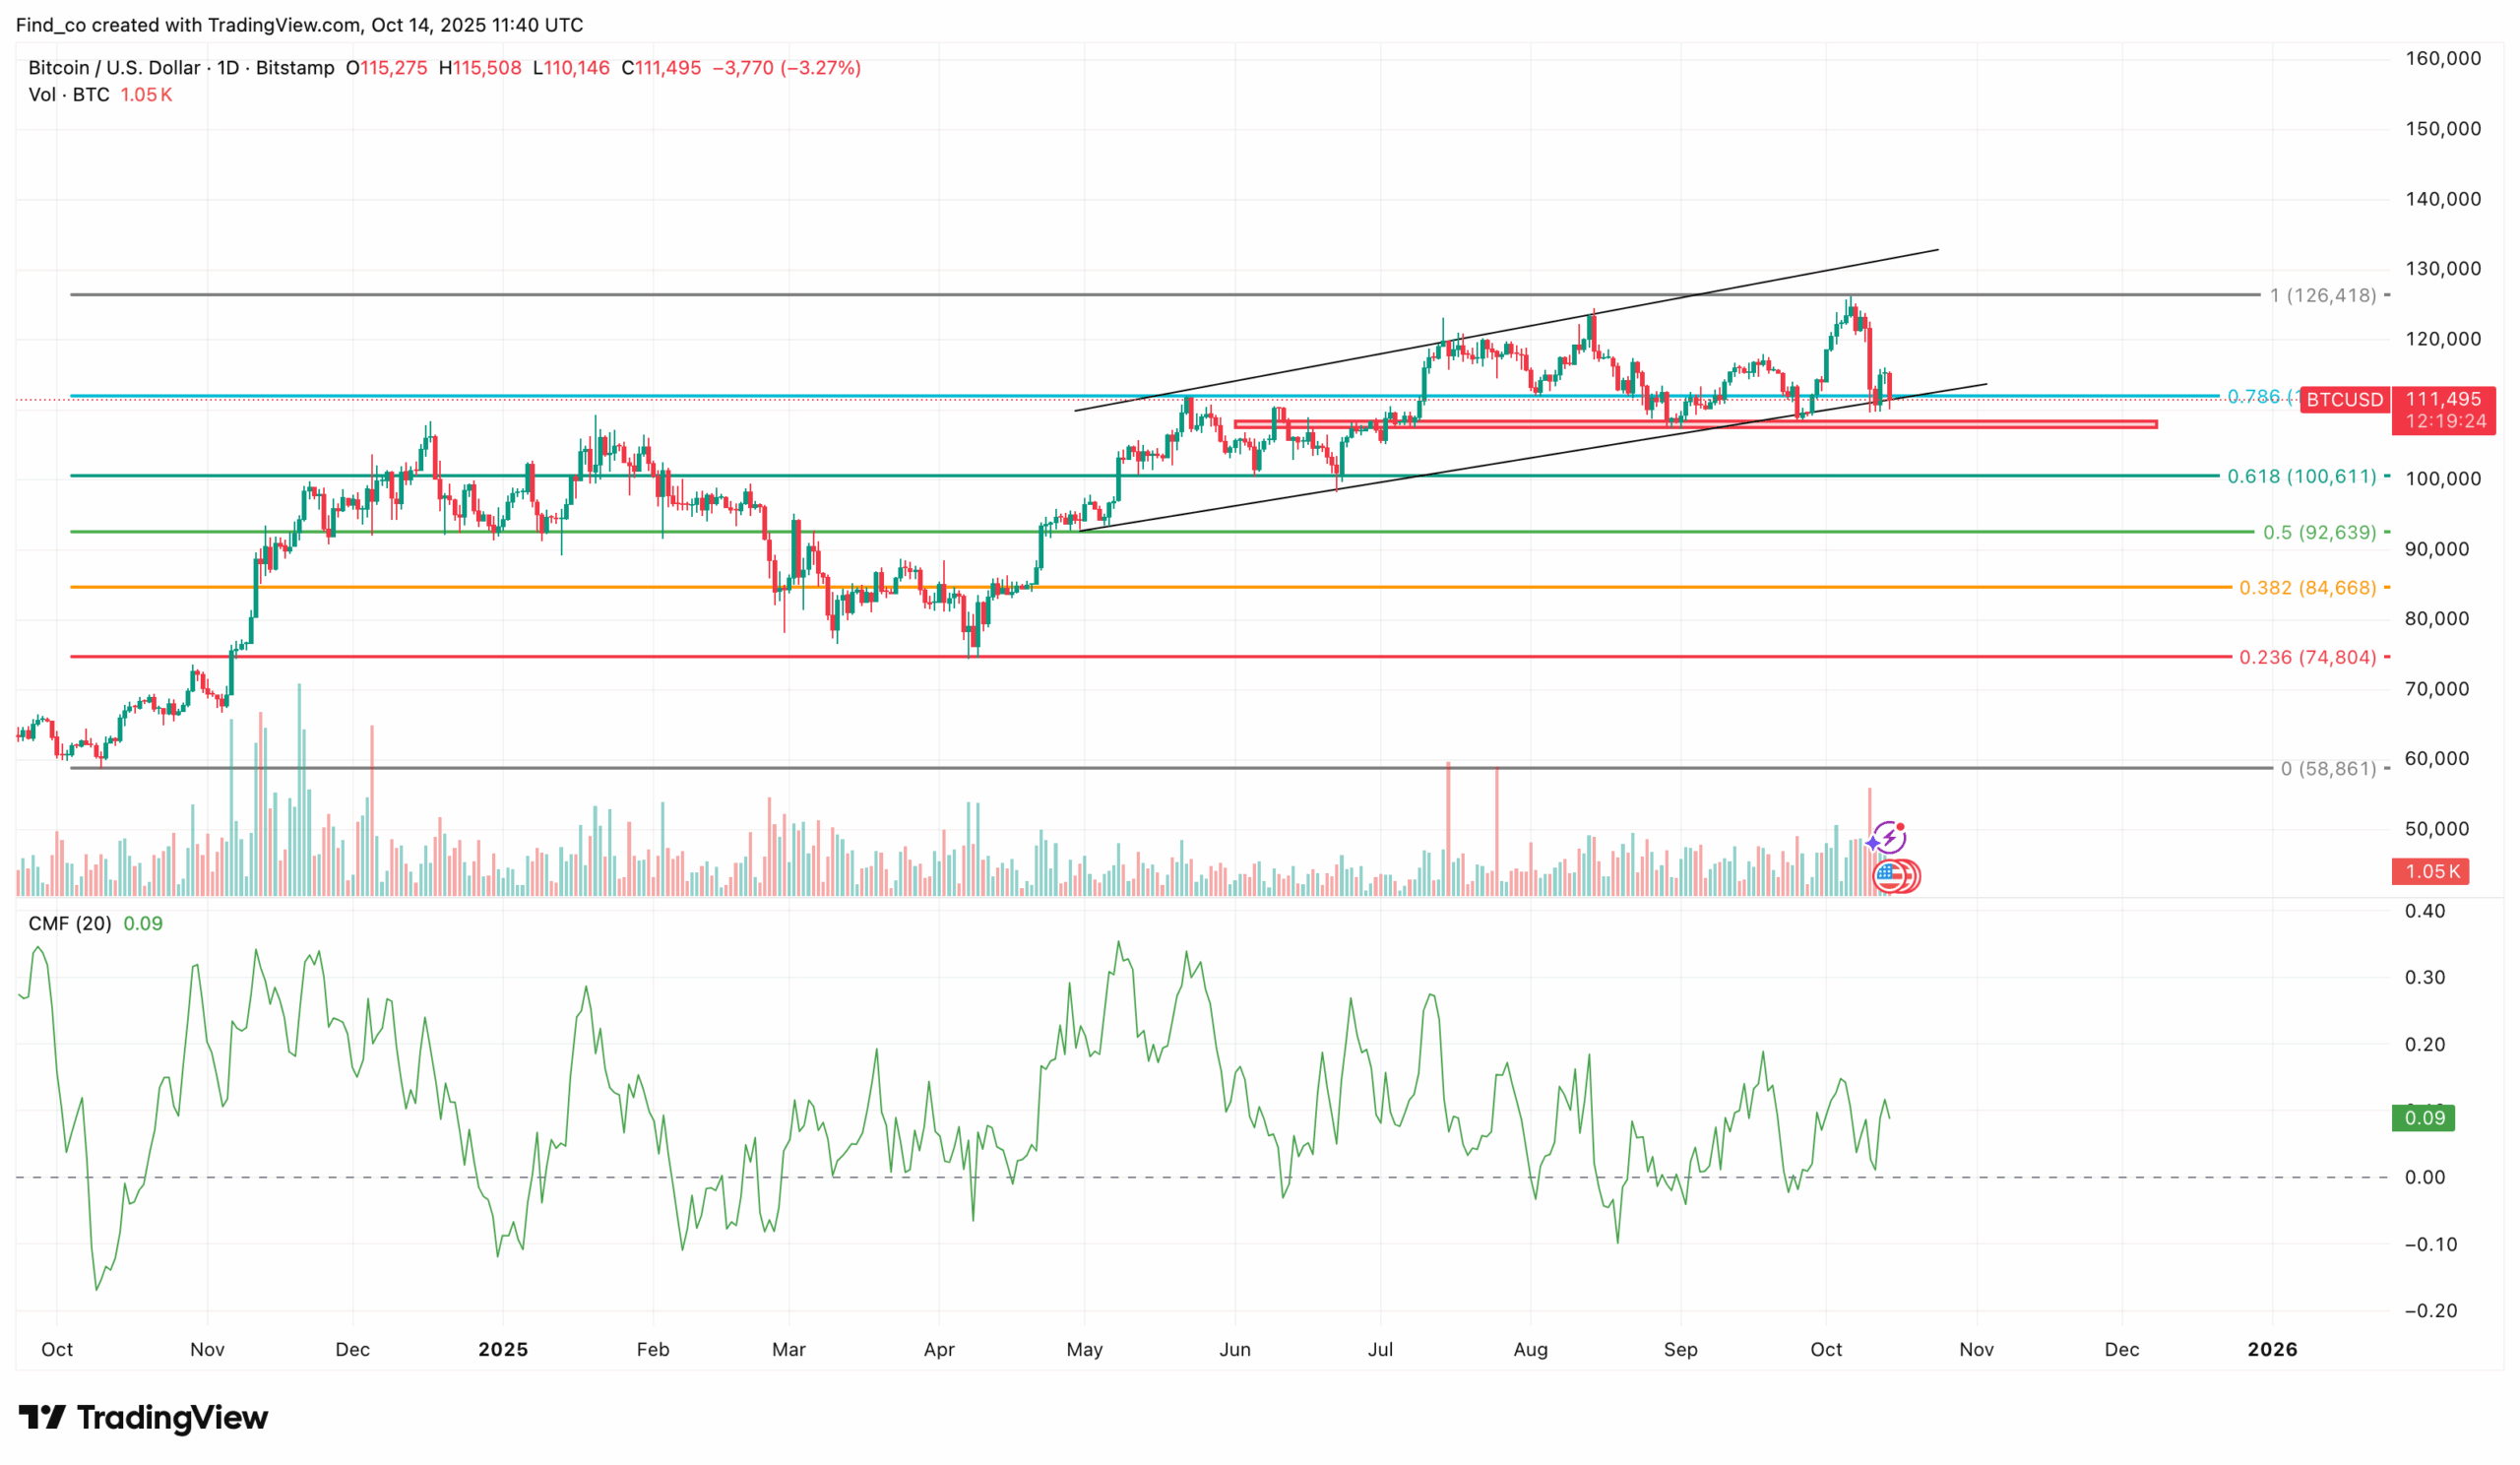
From a technical standpoint, Bitcoin’s price action is flashing signs of strength. The cryptocurrency is approaching the $108,703 zone — a key level where a triple-bottom pattern has formed.
This formation typically signals accumulation and a potential trend reversal, as buyers consistently defend the same support level, absorbing sell pressure each time.
A closer look at the daily chart reinforces this bullish setup. The Chaikin Money Flow (CMF) has remained firmly above the zero signal line, indicating that capital inflows continue to dominate despite recent volatility.
At the same time, BTC continues to trade within an ascending channel, indicating that the broader uptrend structure remains intact. As long as Bitcoin remains within this pattern, the path of least resistance appears to be upward.
If buying pressure intensifies, the BTC price could rebound toward $126,418. A breakout above that zone could open the door for a rally toward $130,000, marking a potential new all-time high.
Disclaimer:
The information provided in this article is for informational purposes only. It is not intended to be, nor should it be construed as, financial advice. We do not make any warranties regarding the completeness, reliability, or accuracy of this information. All investments involve risk, and past performance does not guarantee future results. We recommend consulting a financial advisor before making any investment decisions.
Victor Olanrewaju is a crypto analyst and reporter at CCN with deep roots in on-chain research and technical analysis. His crypto journey began in 2017, but it was the 2020 Uniswap airdrop that sparked a full-time pivot into the space.
With a foundation in copywriting, Victor honed his craft creating high-converting content for leading crypto brokers — most notably an XRP price prediction that ranked #1 on Google during the 2021 bull run.
He later joined AMBCrypto in 2022, where he combined storytelling with technical and on-chain analysis to cover key market narratives.
In 2024, he expanded his expertise at BeInCrypto, collaborating with analysts and using tools like Glassnode, Santiment, and IntoTheBlock to break down Bitcoin and altcoin trends.
At CCN, Victor covers the top cryptocurrencies, memecoins, macro shifts, blending real-time insights with deep-dive metrics.
He holds a Bachelor’s degree in Physics from the University of Ibadan, equipping him to simplify complex data for a wide audience. Follow his work or connect on LinkedIn or X.