Bitcoin (BTC) experienced a significant decline last week before recovering over the weekend.
Bitcoin closed a bearish candlestick in August, but September has been bullish.
Has Bitcoin finished its correction, or will it decline again this week?
The Bitcoin (BTC) price fell to $108,620 last week but rebounded, ending the week on a positive note and closing above $112,000.
Bitcoin’s short-term increase is a positive sign, ideally setting up “Uptober”.
If the Bitcoin price breaks out above $118,000, it will confirm the bullish prediction and lead to a new all-time high.
Bearish Divergences Emerge
Since April, Bitcoin has formed four consecutive bullish monthly candlesticks, reaching a new all-time high price of $124,474.
August broke the trend, as Bitcoin created a bearish shooting star candlestick (red icon).
Get These Top Crypto Casino Offers Now!
Sponsored
Disclosure
We sometimes use affiliate links in our content, when clicking on those we might receive a commission at no extra cost to you. By using this website you agree to our terms and conditions and privacy policy.
Momentum indicators confirm this weakness. The Relative Strength Index (RSI) is at its third bearish divergence peak, while the Moving Average Convergence/Divergence (MACD) shows momentum is falling.
Together, these signs suggest the current Bitcoin price is in the final leg of its bullish cycle.
The wave count confirms this, as it shows that the Bitcoin price is in the fifth and final wave of its upward movement (green) and is likely in its fifth sub-wave, which has created an ending diagonal.
However, the wave count suggests that at least one more upward movement remains before the Bitcoin cycle concludes, potentially setting up a final October rally.
Let’s look at a shorter time frame to determine how that will happen.
Why is Bitcoin Going Up?
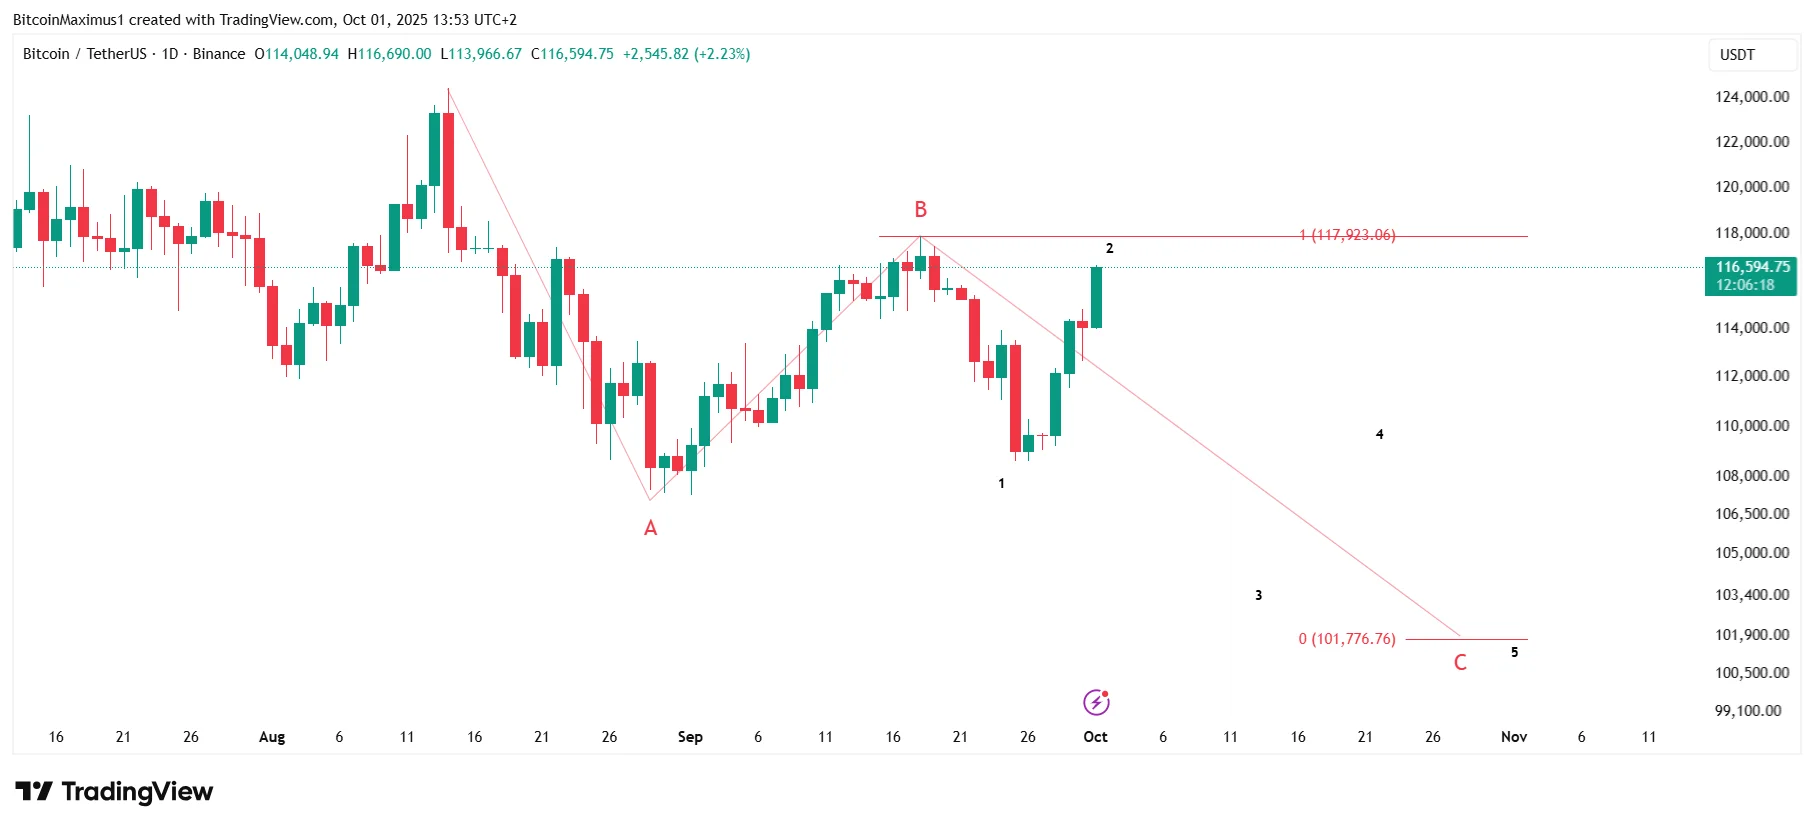
The daily time frame chart and wave count indicate that Bitcoin’s October movement could unfold in two ways.
The bearish scenario suggests that Bitcoin is in wave C of an A-B-C correction (red), which will result in a low of $101,600, giving waves A and C the same length.
In this count, the BTC price is completing wave two of a five-wave downward movement (black), so a significant decline will follow in the next few days.
After the correction ends, the Bitcoin price could surge to a new all-time high, as outlined by the weekly count.
The count is nearly invalidated, and will be with a movement above $117,900 (red line). Since Wave Two does not usually retrace as much, this count is unlikely to play out.
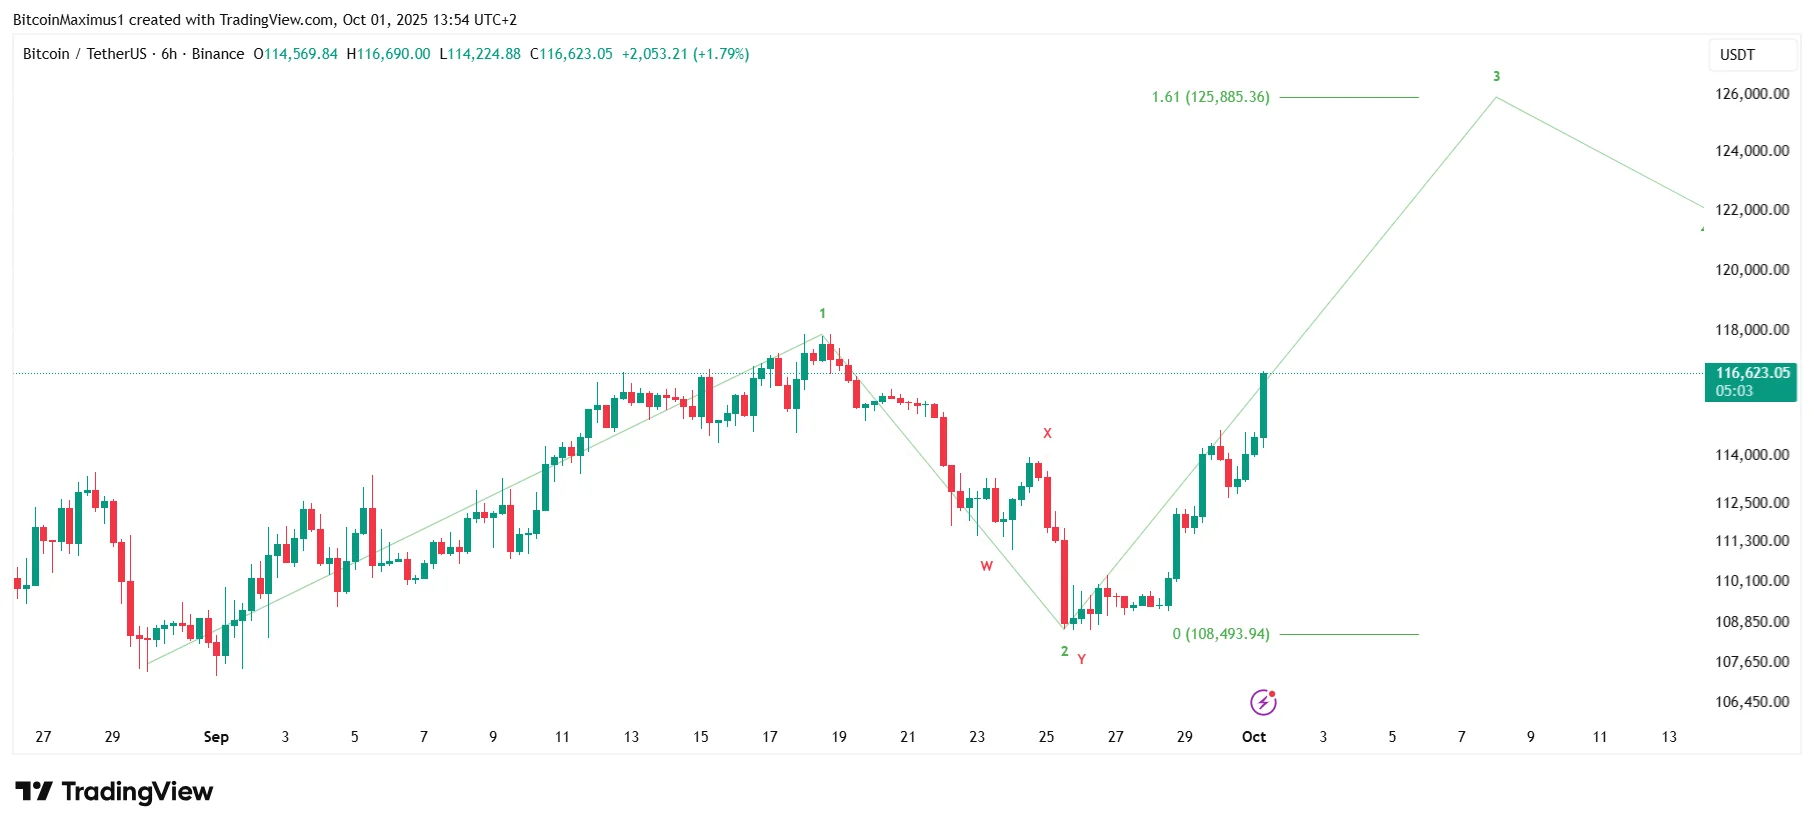
The alternative count is bullish. According to it, Bitcoin has completed wave two of a five-wave upward movement, and is now moving toward new highs.
Bitcoin’s price has already begun its upward movement today if this count plays out. A new all-time high in October is likely.
Disclaimer:
The information provided in this article is for informational purposes only. It is not intended to be, nor should it be construed as, financial advice. We do not make any warranties regarding the completeness, reliability, or accuracy of this information. All investments involve risk, and past performance does not guarantee future results. We recommend consulting a financial advisor before making any investment decisions.
Valdrin Tahiri is a cryptocurrency analyst and reporter at CCN, specializing in technical analysis with a focus on Elliott Wave theory, on-chain metrics, and fundamental research. He brings over seven years of experience in the crypto space as both a trader and writer.
He discovered cryptocurrencies in 2017 while earning his MSc in Financial Markets at the Barcelona School of Economics, which sparked a deep interest in blockchain and market dynamics. Since then, he’s contributed to top crypto outlets like BeInCrypto and CoinGape.
Valdrin also served as Community Manager of BeInCrypto’s Telegram group for three years, helping grow it into one of the largest crypto communities worldwide. His expertise in market structure and price patterns allows him to break down complex trends into clear, actionable insights.
He’s published thousands of articles covering altcoins, Bitcoin cycles, and macro trends.