Meet the Top 101 in Crypto

Dogecoin’s (DOGE) 60% Price Flash Crash Puts 2-Year Support at Risk

Published 14 October 2025
Valdrin Tahiri
Authors
Edited by Ryan James

Key Takeaways

  • Dogecoin (DOGE) risks breaking down from an ascending support trend line.
  • Dogecoin has experienced a relief rally following its previous decline.
  • Can Dogecoin mount a bullish trend reversal, or will it continue falling?

Dogecoin’s price action is approaching a critical point as it retests its two-year diagonal support level.

After months of steady gains since October 2023, DOGE is finally at risk of breaking down.

A sharp dip below support, followed by a recovery, has raised questions about whether the bullish structure can withstand further pressure.

Dogecoin Prevents Breakdown

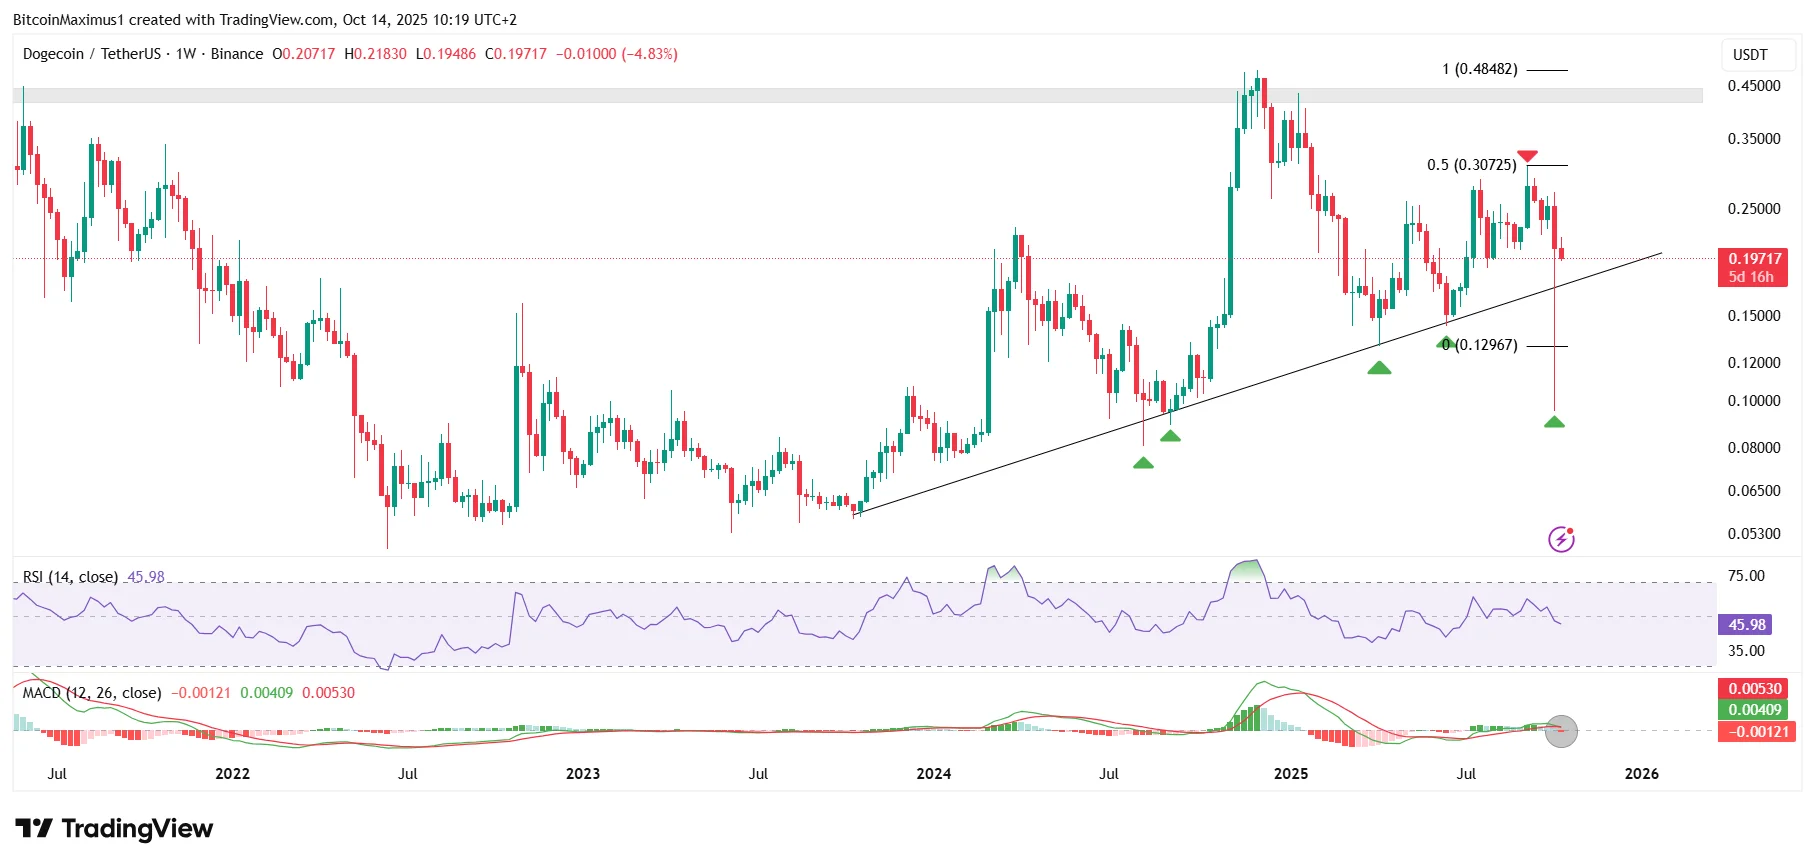
Dogecoin’s price has increased steadily alongside an ascending support trend line since October 2023.

DOGE has increased steadily alongside this support trend line, bouncing five times so far.

However, the final bounce was not the same as the previous one.

The Dogecoin price crashed well below the trend line (green icon) before bouncing and creating a long lower wick.

Get These Top Crypto Casino Offers Now!
Sponsored
Disclosure
Opened in 2023
Promotions
200% deposit bonus up to 20,000 USDT + up to 100 FS (promo code: CG100)
Coins
Tether Bitcoin Ethereum USD Coin TRON +7
Opened in 2022
Promotions
100% of the first bet amount back + Rakeback up to 30% + 100 Freespins
Coins
Bitcoin Ethereum Tether Dogecoin Litecoin +12
Opened in 2018
Promotions
500% Welcome Bonus up to $90,000 + 100 Free Spins
Coins
Bitcoin Ethereum Litecoin Tether Dogecoin +3
Show More

Even though Dogecoin technically prevented the breakdown, the price movement still raises bearish concerns.

The two main reasons are that such a significant decline below support is not typically a deviation, and that the deterioration ended once the 0.5 Fibonacci retracement resistance was rejected by the DOGE price (red icon).

Hence, it is possible that Dogecoin’s long-term bullish trend has ended, and a breakdown from the trend line would confirm this.

Dogecoin Price Movement
DOGE/USDT Weekly Chart | Credit: Valdrin Tahiri/TradingView

Momentum indicators back this reading. After multiple months of consolidation, the Relative Strength Index (RSI) is below 50, and the Moving Average Convergence/Divergence (MACD) has made a bearish cross.

As a result, Dogecoin’s price analysis is bearish, and an eventual breakdown is the most likely future movement.

Why is Dogecoin Going Down?

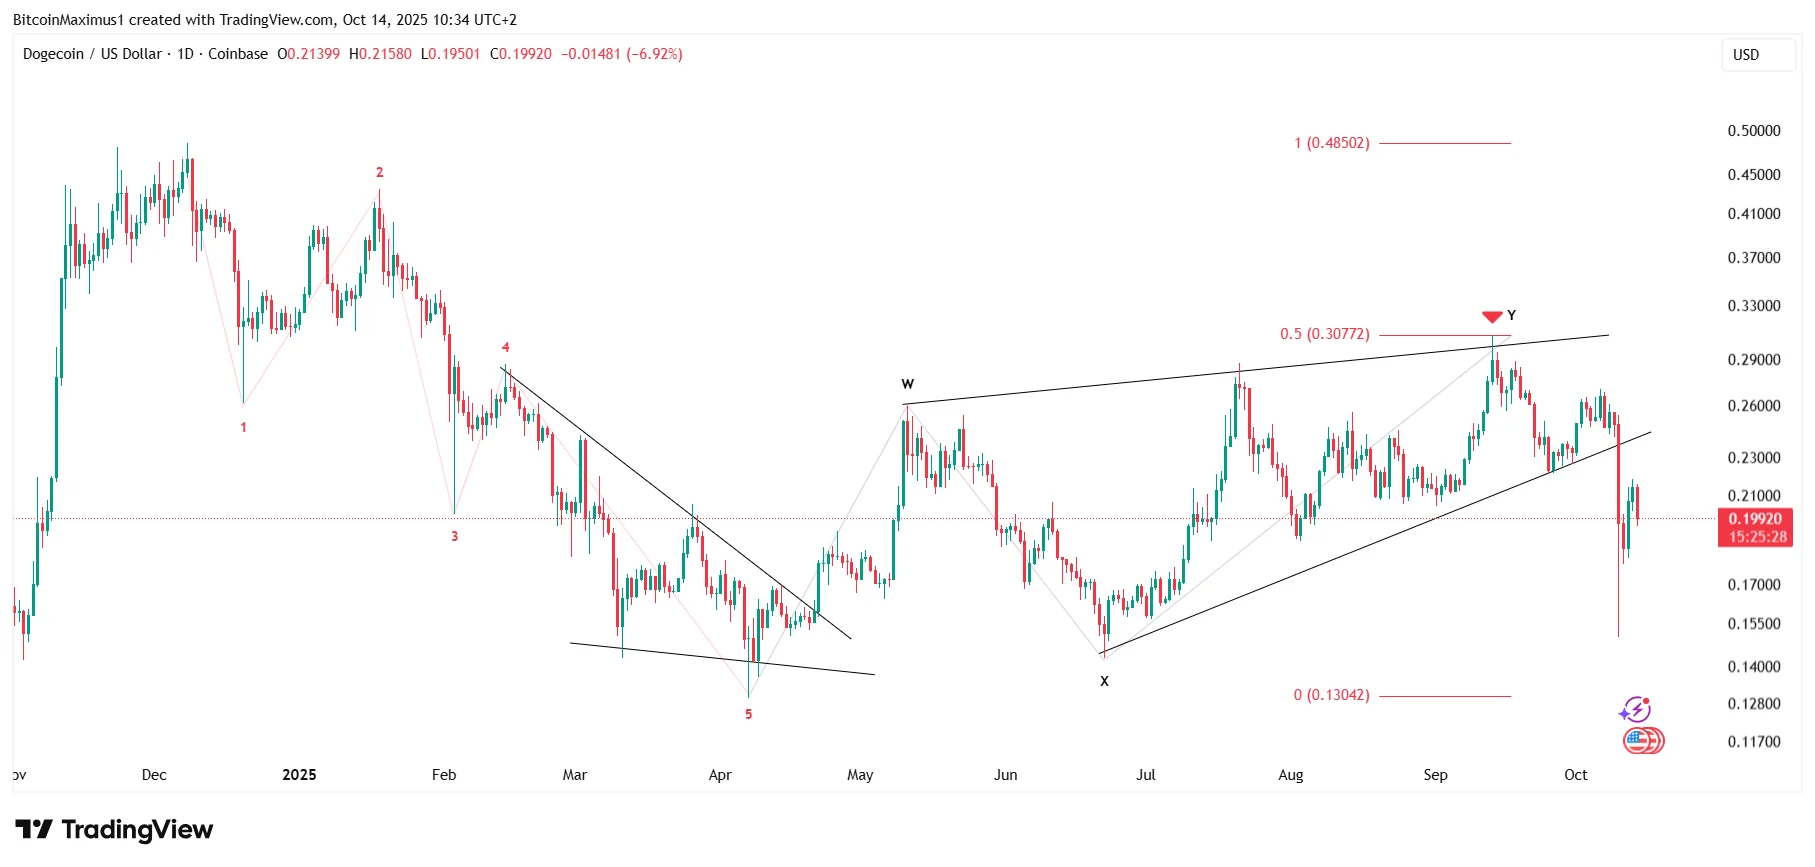
The short-term count corroborates the bearish trend in Dogecoin’s price movement.

The most likely count shows a completed five-wave downward movement (red) since December 2024.

In this context, the entire bounce that began in April is part of a relief rally in response to the decline.

Dogecoin Short-Term
DOGE/USDT Daily Chart | Credit: Valdrin Tahiri/TradingView

Since the rally ended in September, the Dogecoin price has resumed its bearish movement, dropping to new lows.

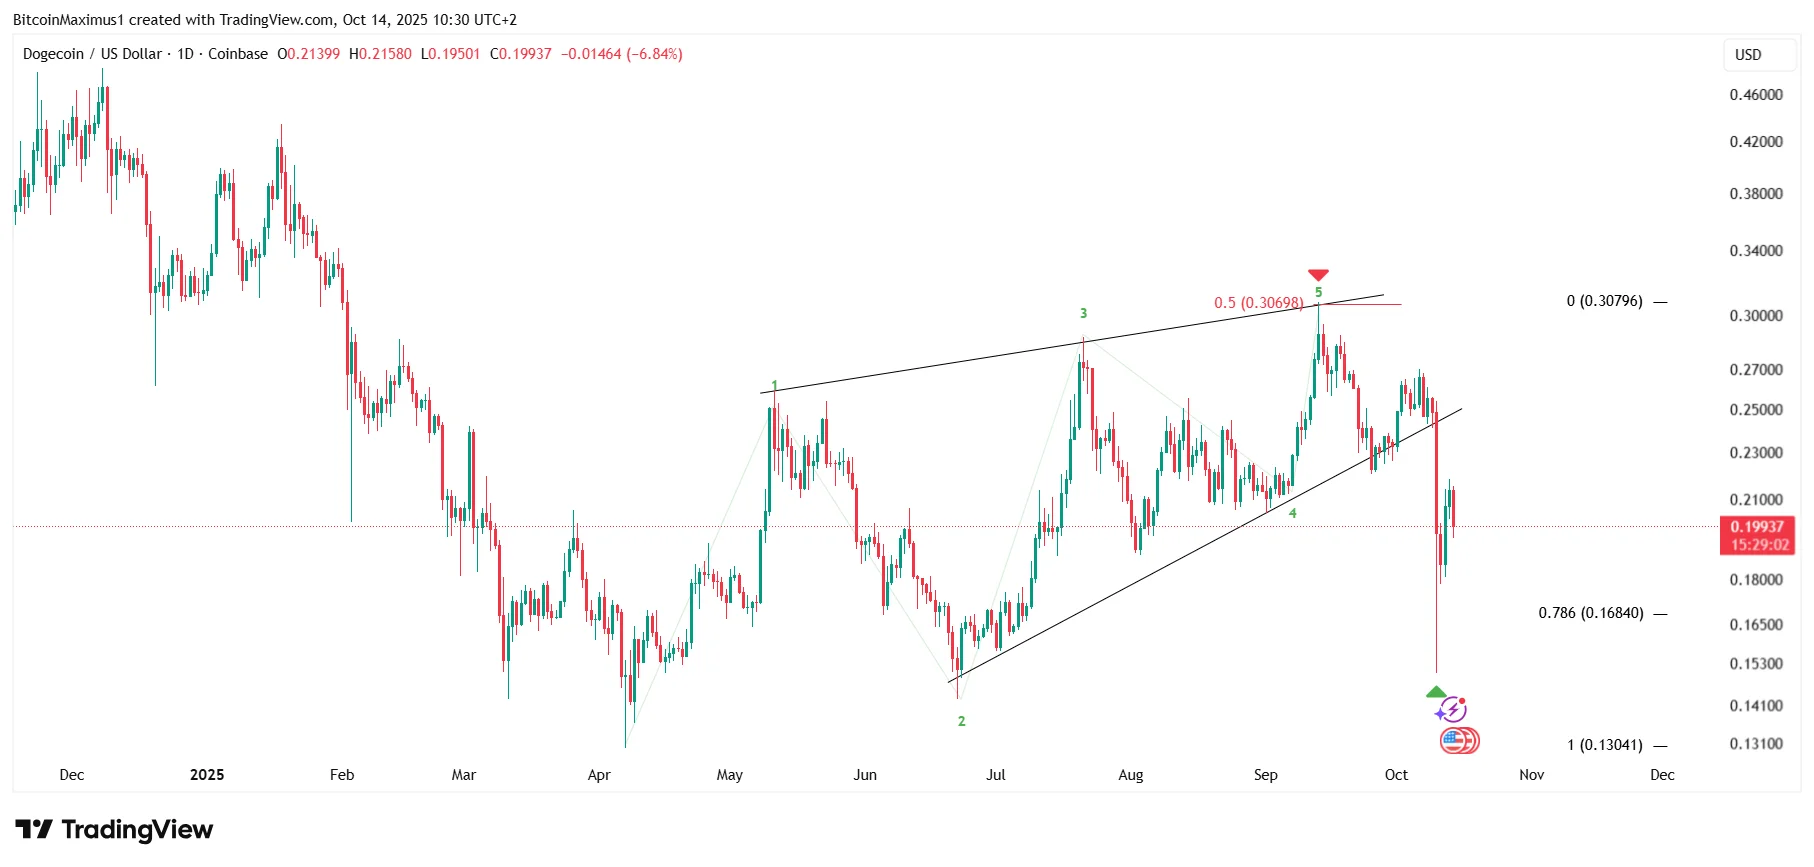
There is one alternative bullish count. In it, Dogecoin has completed a five-wave upward movement (green) contained inside an ascending wedge.

The wedge is part of a leading diagonal, so the ensuing decline is simply a correction that ended at the 0.786 Fibonacci retracement support level.

Dogecoin Bullish Count
DOGE/USDT Daily Chart | Credit: Valdrin Tahiri/TradingView

However, this count is less likely because it does not fit with the long-term movement. Additionally, it would mean that the Dogecoin price has two more bullish waves left, taking it well into 2026.

As a result, the most likely Dogecoin price prediction remains bearish, and a breakdown from the trendline is expected.

Final Thoughts

Dogecoin’s bounce is insufficient to erase the broader bearish signals forming on the charts.

Momentum indicators and repeated rejections at key resistance levels suggest that selling pressure is mounting.

While a bullish alternative exists, it appears less likely given the long-term structure.

If Dogecoin breaks down from its two-year support level, it could quickly plunge to new lows.

Disclaimer: The information provided in this article is for informational purposes only. It is not intended to be, nor should it be construed as, financial advice. We do not make any warranties regarding the completeness, reliability, or accuracy of this information. All investments involve risk, and past performance does not guarantee future results. We recommend consulting a financial advisor before making any investment decisions.
Valdrin Tahiri

Valdrin Tahiri is a cryptocurrency analyst and reporter at CCN, specializing in technical analysis with a focus on Elliott Wave theory, on-chain metrics, and fundamental research. He brings over seven years of experience in the crypto space as both a trader and writer.

He discovered cryptocurrencies in 2017 while earning his MSc in Financial Markets at the Barcelona School of Economics, which sparked a deep interest in blockchain and market dynamics. Since then, he’s contributed to top crypto outlets like BeInCrypto and CoinGape.

Valdrin also served as Community Manager of BeInCrypto’s Telegram group for three years, helping grow it into one of the largest crypto communities worldwide. His expertise in market structure and price patterns allows him to break down complex trends into clear, actionable insights.

He’s published thousands of articles covering altcoins, Bitcoin cycles, and macro trends.

Related

Survey Icon
Help us improve
1 of 4
Is this your first time here?
What brought you here today?
What are you most interested in?
Would you be interested in:
Thank you icon
Thank you for your feedback!
DMCA.com Protection Status