Solana struggles to sustain momentum | Credit: Hameem Sarwar
Share
Key Takeaways
SOL struggles to break below the $211 resistance, with sentiment turning bearish around $175.
MACD, MFI, and RSI show declining momentum and rising selling pressure.
SOL price may drop toward $156 or $133 unless bulls reclaim the 0.618 Fib level.
A few days ago, Solana (SOL) briefly flashed signs of renewed bullish momentum as buyers stepped back in and injected fresh confidence into the market.
However, that optimism has quickly faded. Solana’s price now struggles to sustain upward momentum, with cooling sentiment erasing the earlier bullish move.
The coin’s failure to break through the crucial resistance zone at $211 highlights weakening buying pressure and suggests that bulls may be losing control again.
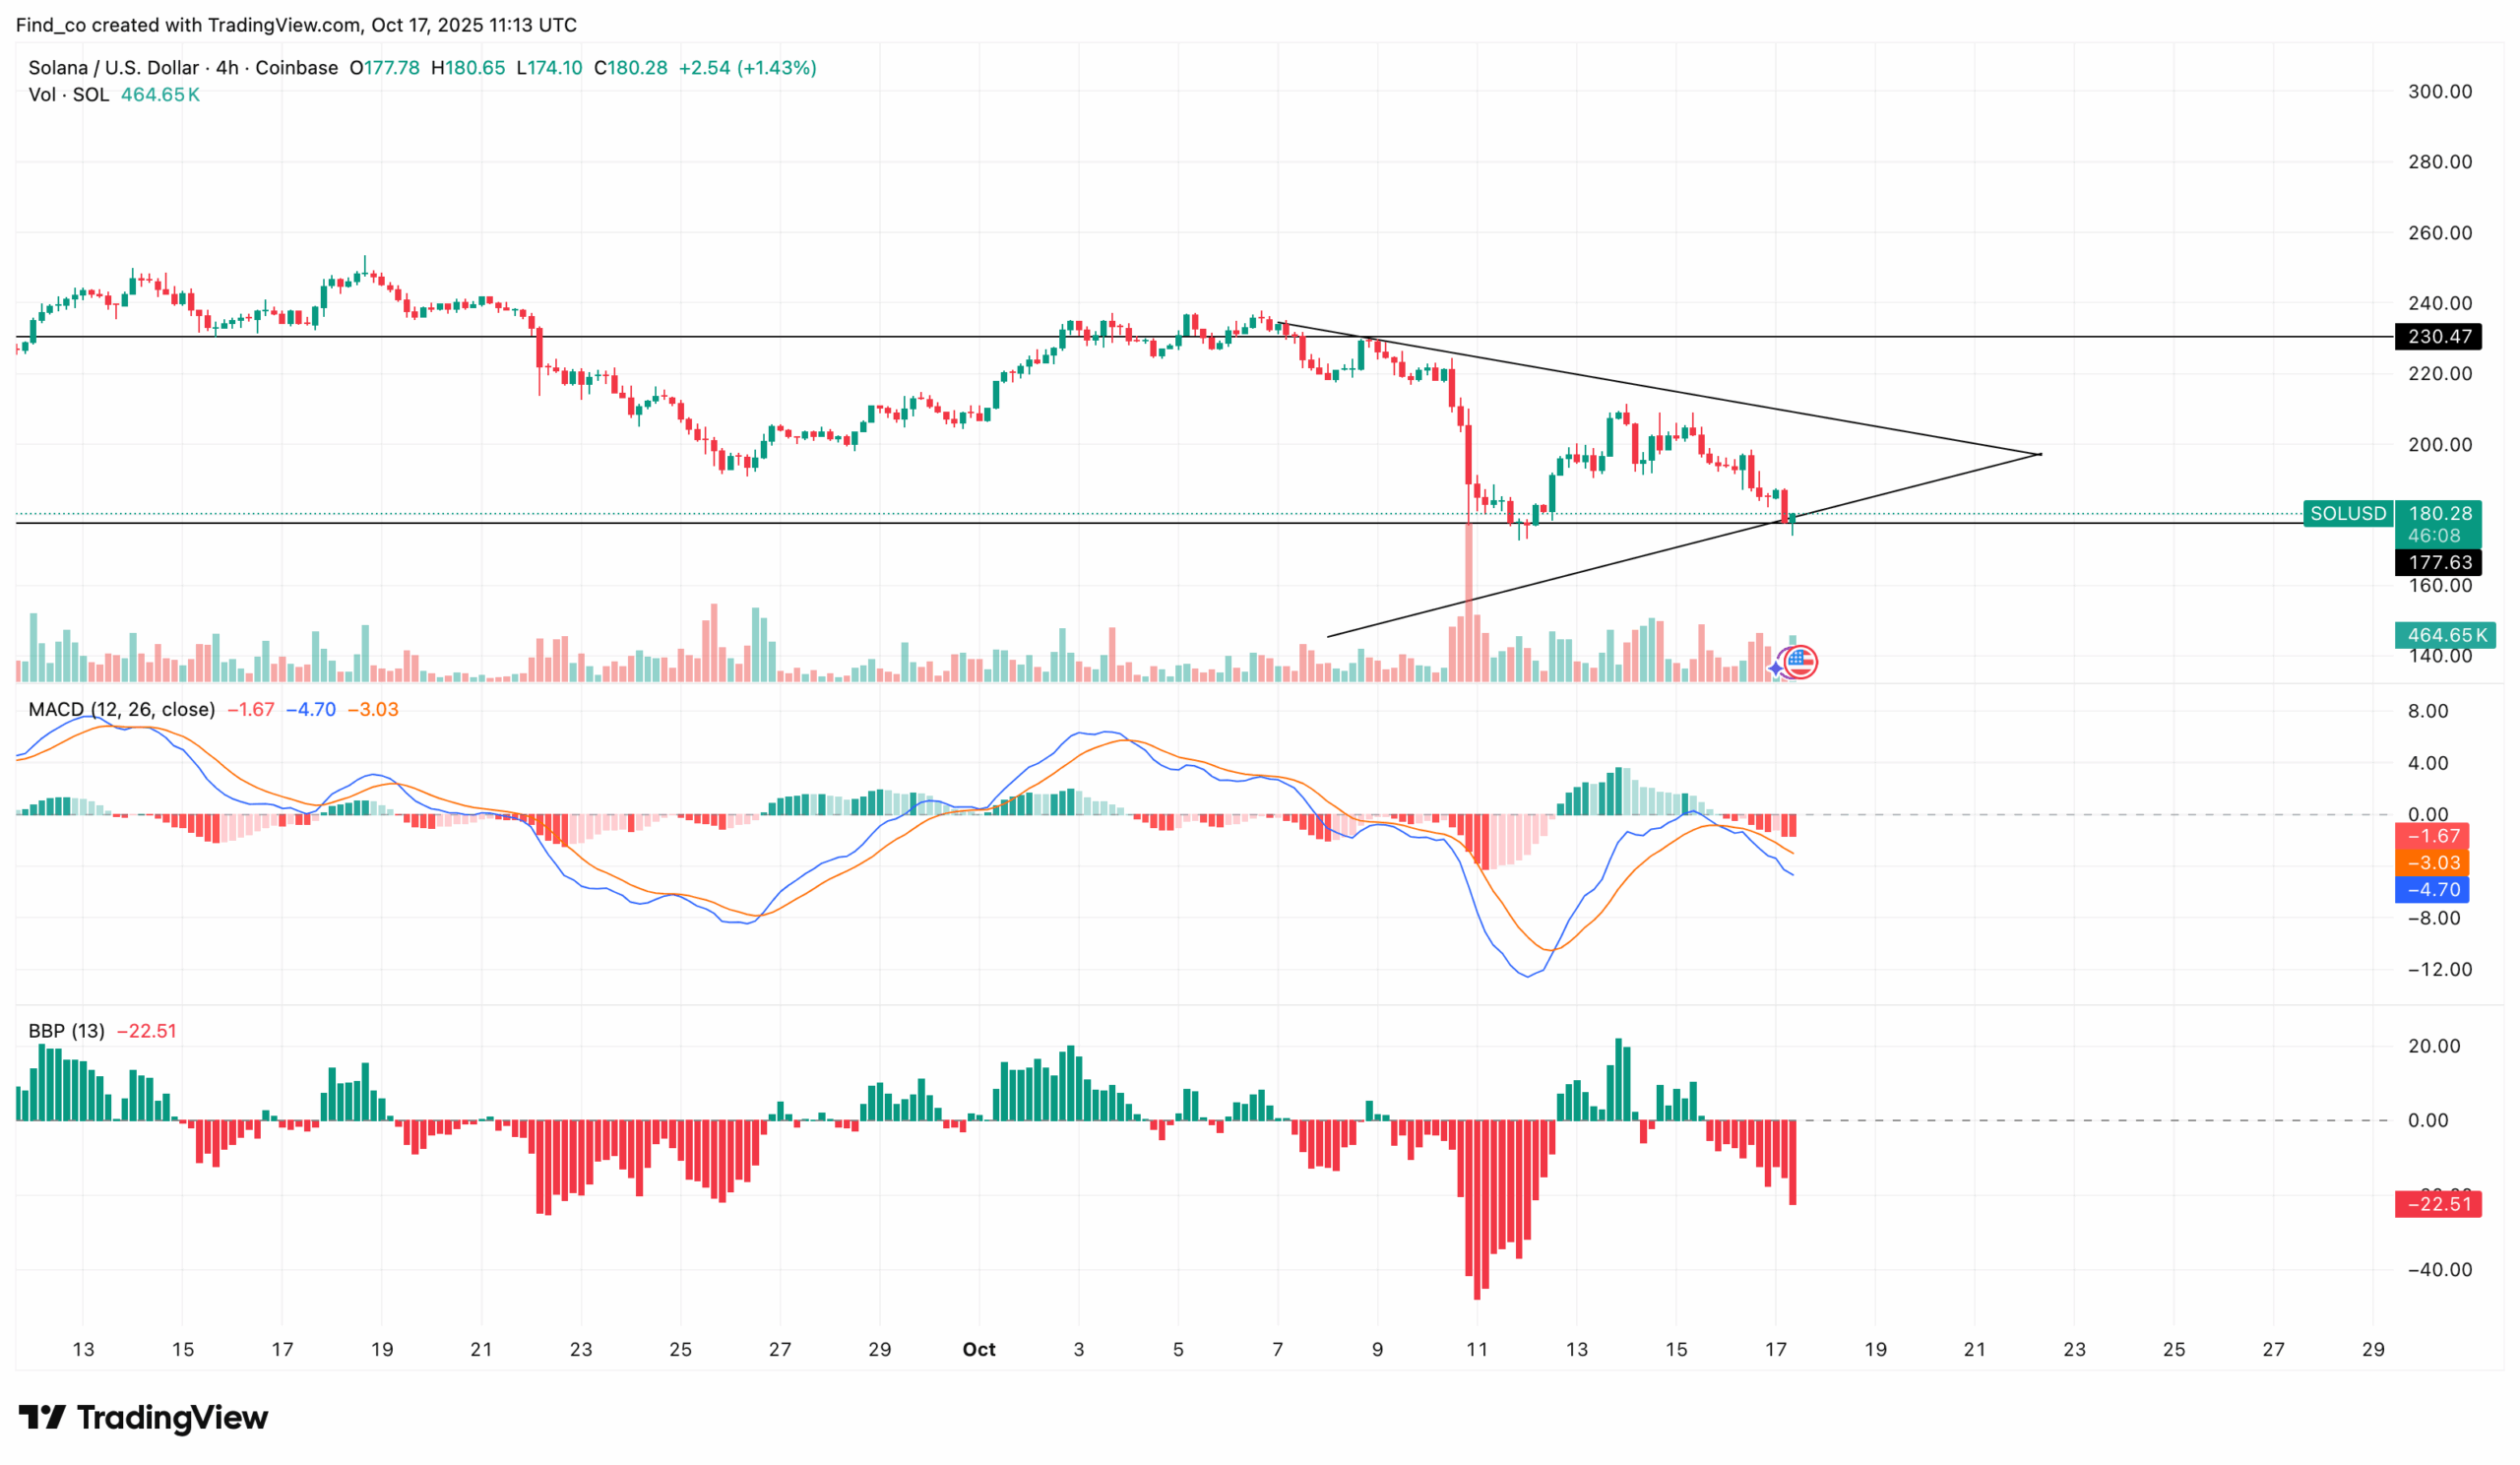
At press time, SOL trades at $174.91, edging closer to its immediate support level near $150.
Will bulls fight back, or is a deeper drop ahead? Let’s find out.
Solana’s Momentum Turns Bearish
On the 4-hour chart, Solana’s Moving Average Convergence Divergence (MACD) shows the EMA 26 (orange) crossing above the EMA 12 (blue), a classic bearish indicator that confirms weakening momentum.
Get These Top Crypto Casino Offers Now!
Sponsored
Disclosure
We sometimes use affiliate links in our content, when clicking on those we might receive a commission at no extra cost to you. By using this website you agree to our terms and conditions and privacy policy.
Shrinking histogram bars further support this signal, indicating reduced buying pressure and suggesting a possible continuation of the downtrend in the short term.
The Bull Bear Power (BBP) indicator paints a similar picture. Solana’s price currently trades in the negative region at -21.45, indicating dominant selling pressure.
Unless buying volume increases to counter the imbalance, the token could experience further retracement in the coming days.
The daily chart aligns with this outlook, reinforcing the broader bearish structure. SOL’s Money Flow Index (MFI) stands at 31.13 and continues to slide toward the oversold threshold of 20, signaling persistent selling pressure.
This steady decline reflects hesitation among buyers, allowing bears to maintain firm control over price action.
Likewise, the Relative Strength Index (RSI) hovers at 36.89, gradually approaching the oversold zone at 30.
Together, both indicators confirm weakening momentum and the growing dominance of sellers.
If this trend persists, SOL could extend its decline toward key support zones around $156, testing traders’ conviction at lower levels.
The Fibonacci retracement levels provide further insight into Solana’s next move.
SOL currently trades below the 0.618 Fib level and inches closer to the 0.382 Fib support at $156.36. A continued downside could drive the token toward the next primary Fib support level near $133.16.
Meanwhile, Ryan Lee, Chief Analyst at Bitget, believes Solana’s price might recover soon.
“Solana, by contrast, is showing stronger momentum, with prices targeting the $210 to $250 range. Growth in DeFi activity and rising optimism around a potential ETF approval continue to underpin its performance,” Lee stated.
Revisiting the technical setup, if Solana’s price manages to reclaim the 0.618 Fib level, it could signal a potential reversal.
A move above this zone might shift momentum back in favor of the bulls and open the path toward retesting the $220.58 resistance area.
Disclaimer:
The information provided in this article is for informational purposes only. It is not intended to be, nor should it be construed as, financial advice. We do not make any warranties regarding the completeness, reliability, or accuracy of this information. All investments involve risk, and past performance does not guarantee future results. We recommend consulting a financial advisor before making any investment decisions.
Victor Olanrewaju is a crypto analyst and reporter at CCN with deep roots in on-chain research and technical analysis. His crypto journey began in 2017, but it was the 2020 Uniswap airdrop that sparked a full-time pivot into the space.
With a foundation in copywriting, Victor honed his craft creating high-converting content for leading crypto brokers — most notably an XRP price prediction that ranked #1 on Google during the 2021 bull run.
He later joined AMBCrypto in 2022, where he combined storytelling with technical and on-chain analysis to cover key market narratives.
In 2024, he expanded his expertise at BeInCrypto, collaborating with analysts and using tools like Glassnode, Santiment, and IntoTheBlock to break down Bitcoin and altcoin trends.
At CCN, Victor covers the top cryptocurrencies, memecoins, macro shifts, blending real-time insights with deep-dive metrics.
He holds a Bachelor’s degree in Physics from the University of Ibadan, equipping him to simplify complex data for a wide audience. Follow his work or connect on LinkedIn or X.