7 Bitcoin Price Warnings You Can’t Afford to Ignore (Hint: It’s Not Just Charts)
Share
Key Takeaways
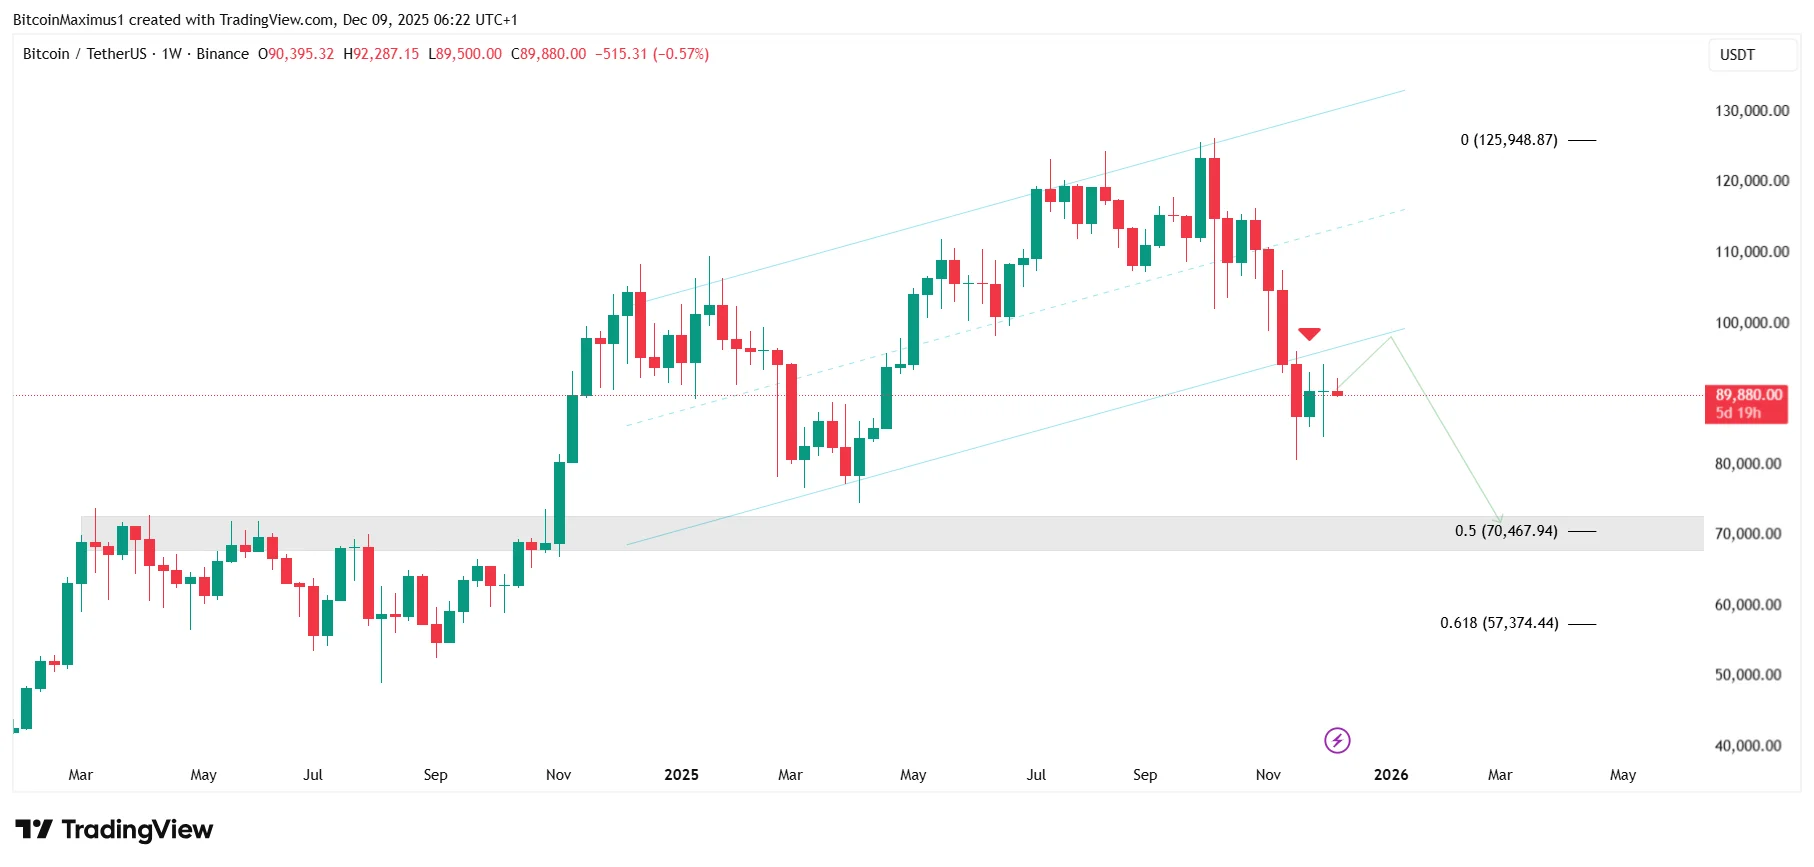
Bitcoin (BTC) trades inside long- and short-term parallel channel patterns.
The Bitcoin price initiated its previous bear market after breaking down from a similar channel.
Will history repeat, and if so, has Bitcoin already started its bear market?
Bitcoin (BTC) is sending a clear and alarming signal to the crypto markets.
After months of trading within a significant long-term parallel channel, the price has broken down decisively, a move that analysts confirm as the start of a major bear market.
Chart patterns and technical indicators are mirroring the conditions seen at the beginning of the 2021 crash, fueling fears that the bull run of 2024-2025 is over.
With another potential breakdown on the horizon, traders are left wondering: Why is Bitcoin going down, and how long will this decline continue?
Bitcoin’s Bear Market Begins
The weekly Bitcoin chart indicates that the price has broken down from a long-term parallel channel.
This channel has been in existence since January 2025.
The breakdown decisively signals that the Bitcoin bear market has begun.
Get These Top Crypto Casino Offers Now!
Sponsored
Disclosure
We sometimes use affiliate links in our content, when clicking on those we might receive a commission at no extra cost to you. By using this website you agree to our terms and conditions and privacy policy.
Leshka tweeted a very similar pattern, noting a double top in both cycles.
If his pattern gets followed, the Bitcoin price is completing its final bull trap before crashing below $50,000.
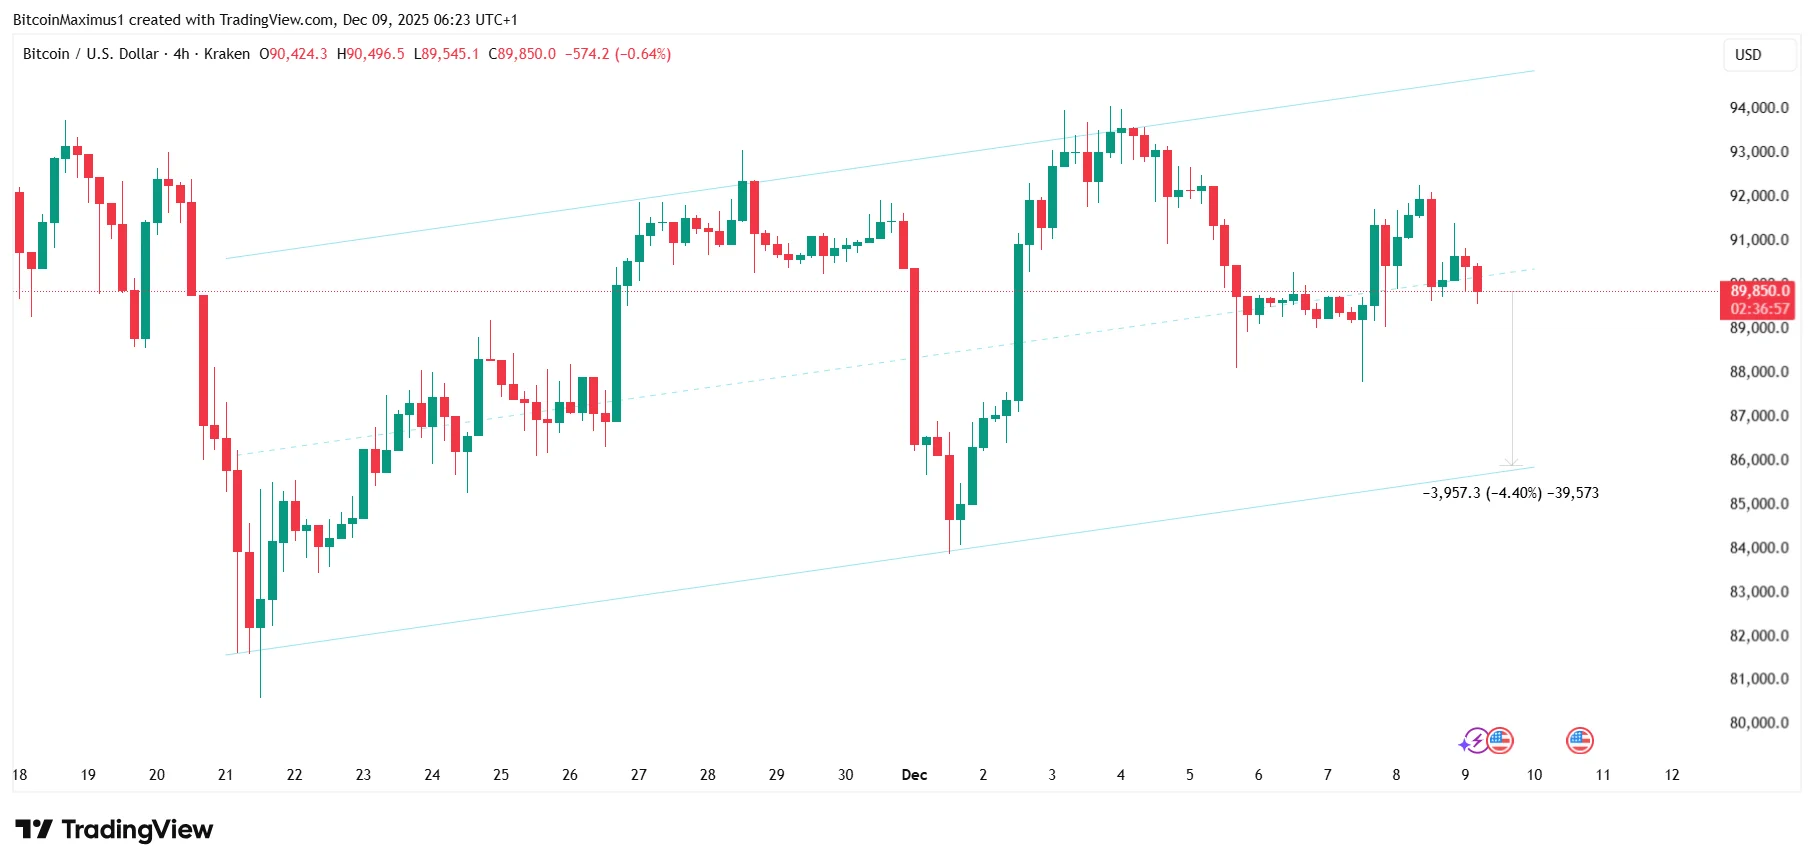
Adding to the long-term concerns, well-known analyst Vivek Sen believes that the entire short-term price movement is a result of market manipulation.
“Earlier today, Bitcoin jumped $2,500 from $89,800 to $92,200 and liquidated $70 million worth of long positions. And then it dumped $2,200, now from $92,200 to $89,600 again, and liquidated $61 million worth of shorts,” he stated.
Sentiment on X is clearly bearish, and claims of market manipulation dominate the timeline.
Therefore, the risk of a downside is initially 4.40%, which would take the Bitcoin price to $86,000.
However, once a breakdown occurs, the floodgates could open to much lower prices.
Hence, all eyes are on the channel’s midline and afterward, its support trend line.
Critical Test Ahead
The technical analysis is now overwhelming: Bitcoin is firmly in a bearish trend.
The critical break of the long-term channel, combined with negative momentum indicators and striking historical parallels to the 2021 market top, suggests that the path of least resistance is down.
While a temporary bounce is possible, traders are intensely focused on the next major support zone at $70,500.
Unless Bitcoin manages an immediate and powerful reversal to reclaim the broken channel, extreme caution is warranted.
Disclaimer:
The information provided in this article is for informational purposes only. It is not intended to be, nor should it be construed as, financial advice. We do not make any warranties regarding the completeness, reliability, or accuracy of this information. All investments involve risk, and past performance does not guarantee future results. We recommend consulting a financial advisor before making any investment decisions.
Valdrin Tahiri is a cryptocurrency analyst and reporter at CCN, specializing in technical analysis with a focus on Elliott Wave theory, on-chain metrics, and fundamental research. He brings over seven years of experience in the crypto space as both a trader and writer.
He discovered cryptocurrencies in 2017 while earning his MSc in Financial Markets at the Barcelona School of Economics, which sparked a deep interest in blockchain and market dynamics. Since then, he’s contributed to top crypto outlets like BeInCrypto and CoinGape.
Valdrin also served as Community Manager of BeInCrypto’s Telegram group for three years, helping grow it into one of the largest crypto communities worldwide. His expertise in market structure and price patterns allows him to break down complex trends into clear, actionable insights.
He’s published thousands of articles covering altcoins, Bitcoin cycles, and macro trends.