Crypto rotation in play: BTC.D dips, TOTAL2 breaks out, and ETH surges. Altcoin season incoming? | Credit: Veronica Cestari
Share
Key Takeaways
Bitcoin dominance has dropped from 65.85% to 62.69%, breaking down from a rising wedge.
TOTAL2 broke out of a bullish cup-and-handle pattern, with the ADX confirming trend strength.
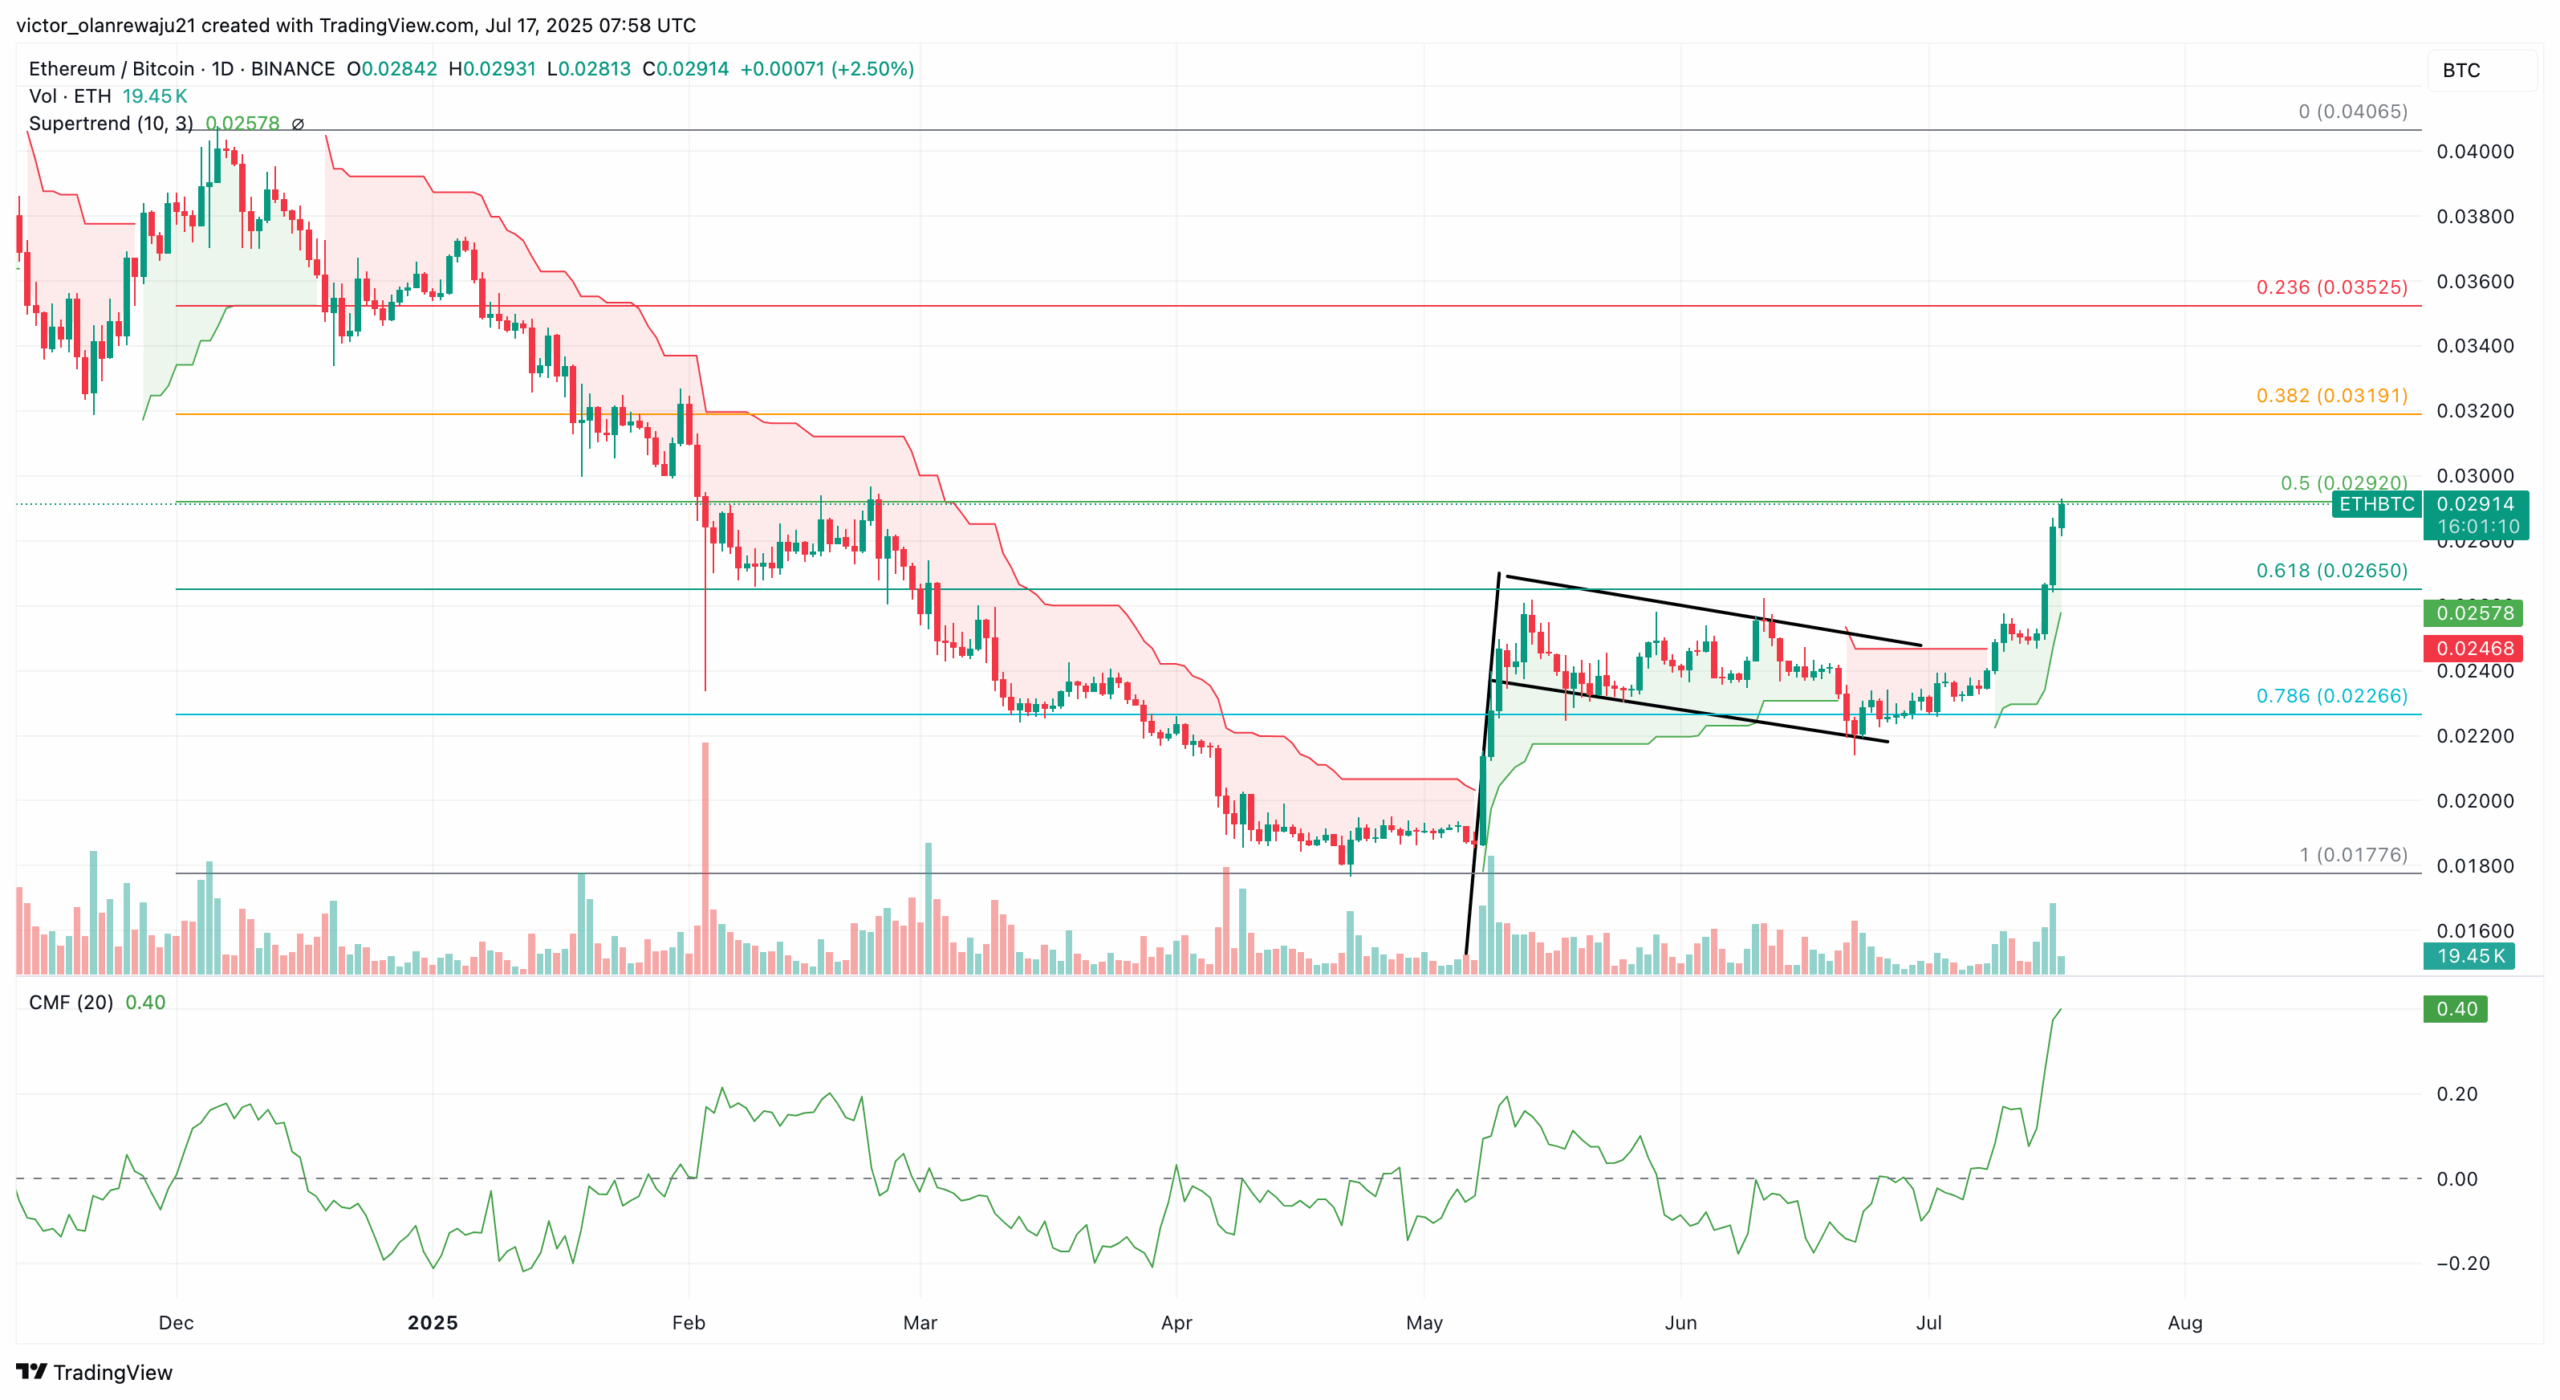
The ETH/BTC chart shows a bull flag breakout, with CMF signaling intense buying pressure.
Bitcoin’s (BTC) grip on the crypto market is slipping, and altcoin season may finally be coming. This comes after Bitcoin’s price hit a new all-time high of $123,091 in July.
Today, BTC slipped to $118,000, while several altcoins extended their recent rallies. A key driver behind this divergence is Ethereum (ETH), a cryptocurrency that has long trailed Bitcoin in performance.
But this week, that narrative has shifted. ETH recently broke above $3,400 and is now outpacing BTC’s momentum. Here’s what this trend means for Ethereum’s price — and what it could signal for the broader altcoin market.
Bitcoin Dominance Declines
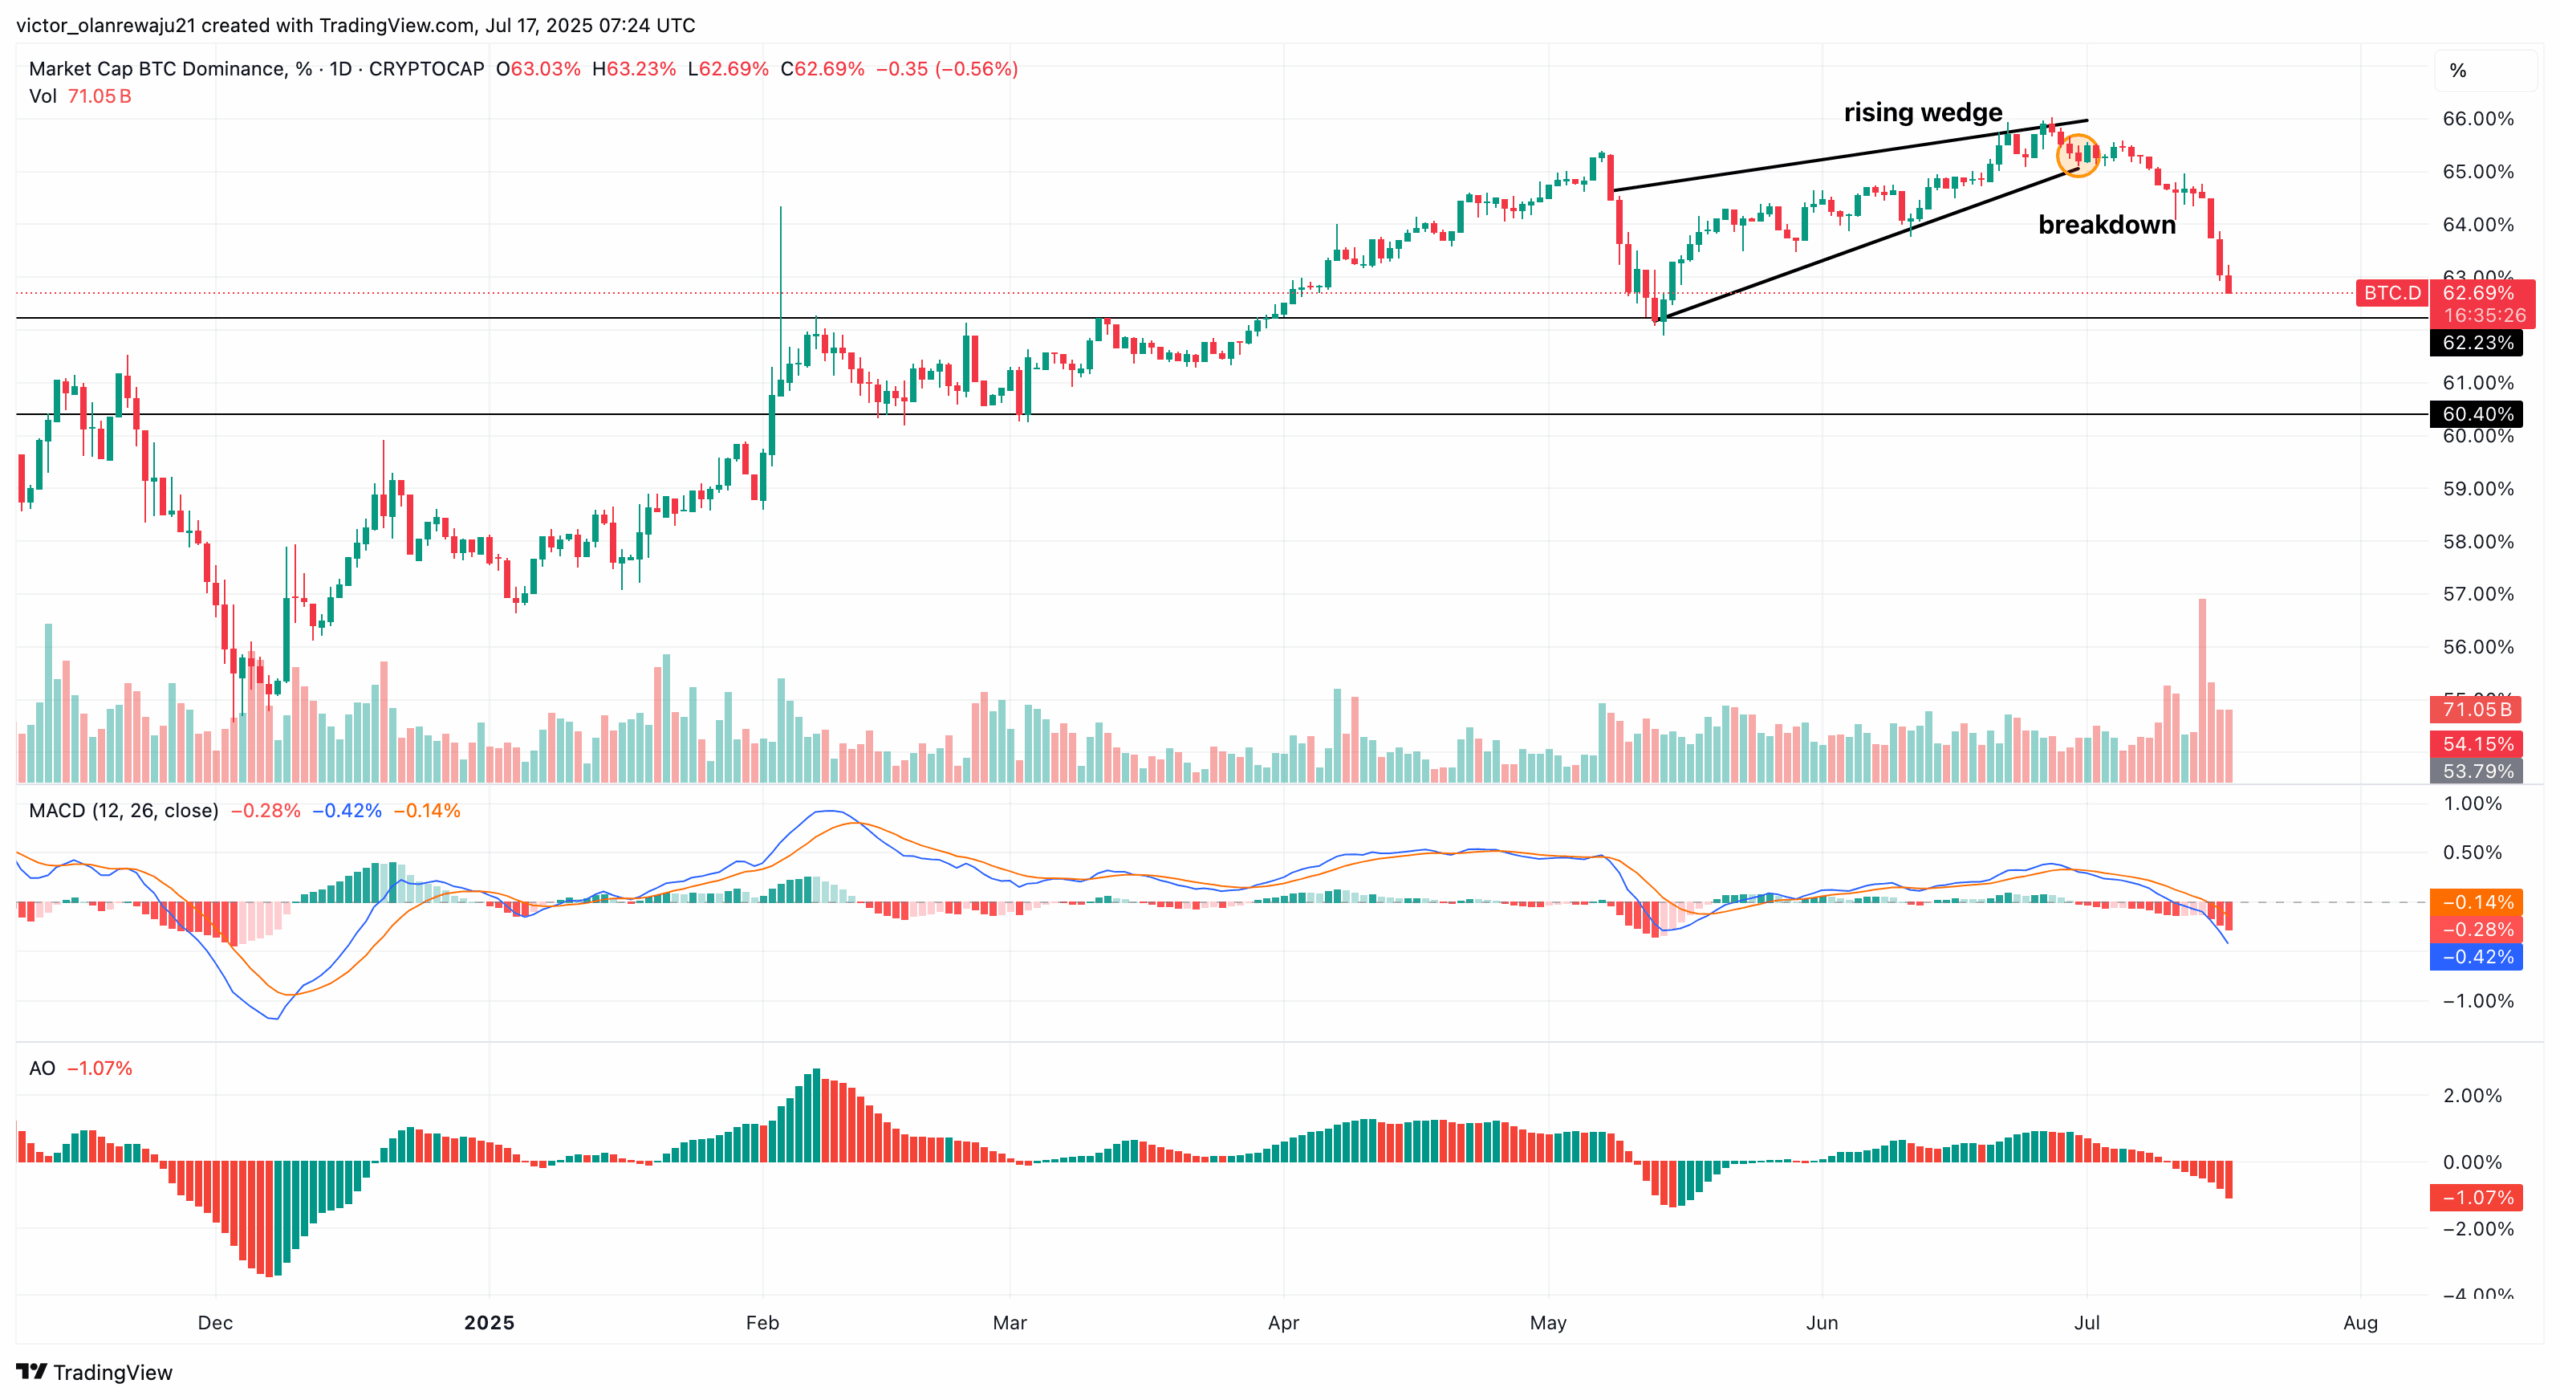
Bitcoin dominance (BTC.D) has to drop to confirmcoin season narrative the growing alt. According to the daily chart, BTC.D hit 65.85% during the last days of June.
The rise to this level led to the formation of a rising wedge, which is formed when price action is contained within two upward-sloping, converging trendlines.
In this case, both the support (lower) and resistance (upper) lines are rising. However, the support line is steeper, indicating that higher lows are forming faster than higher highs.
Try Our Recommended Crypto Exchanges
Sponsored
Disclosure
We sometimes use affiliate links in our content, when clicking on those we might receive a commission at no extra cost to you. By using this website you agree to our terms and conditions and privacy policy.
Despite the uptrend, the rising wedge is a bearish pattern, which indicates weakening momentum and a potential reversal to the downside. True to its form, Bitcoin dominance has fallen below the upper trendline of the wedge and hit 62.69%.
Alongside this, the Moving Average Convergence Divergence (MACD) has dropped to the negative region. It is the same as the Awesome Oscillator (AO).
This drop in the AO and MACD indicates bearish momentum. If sustained, BTC.D risks dropping below the underlying support to 60.37%.
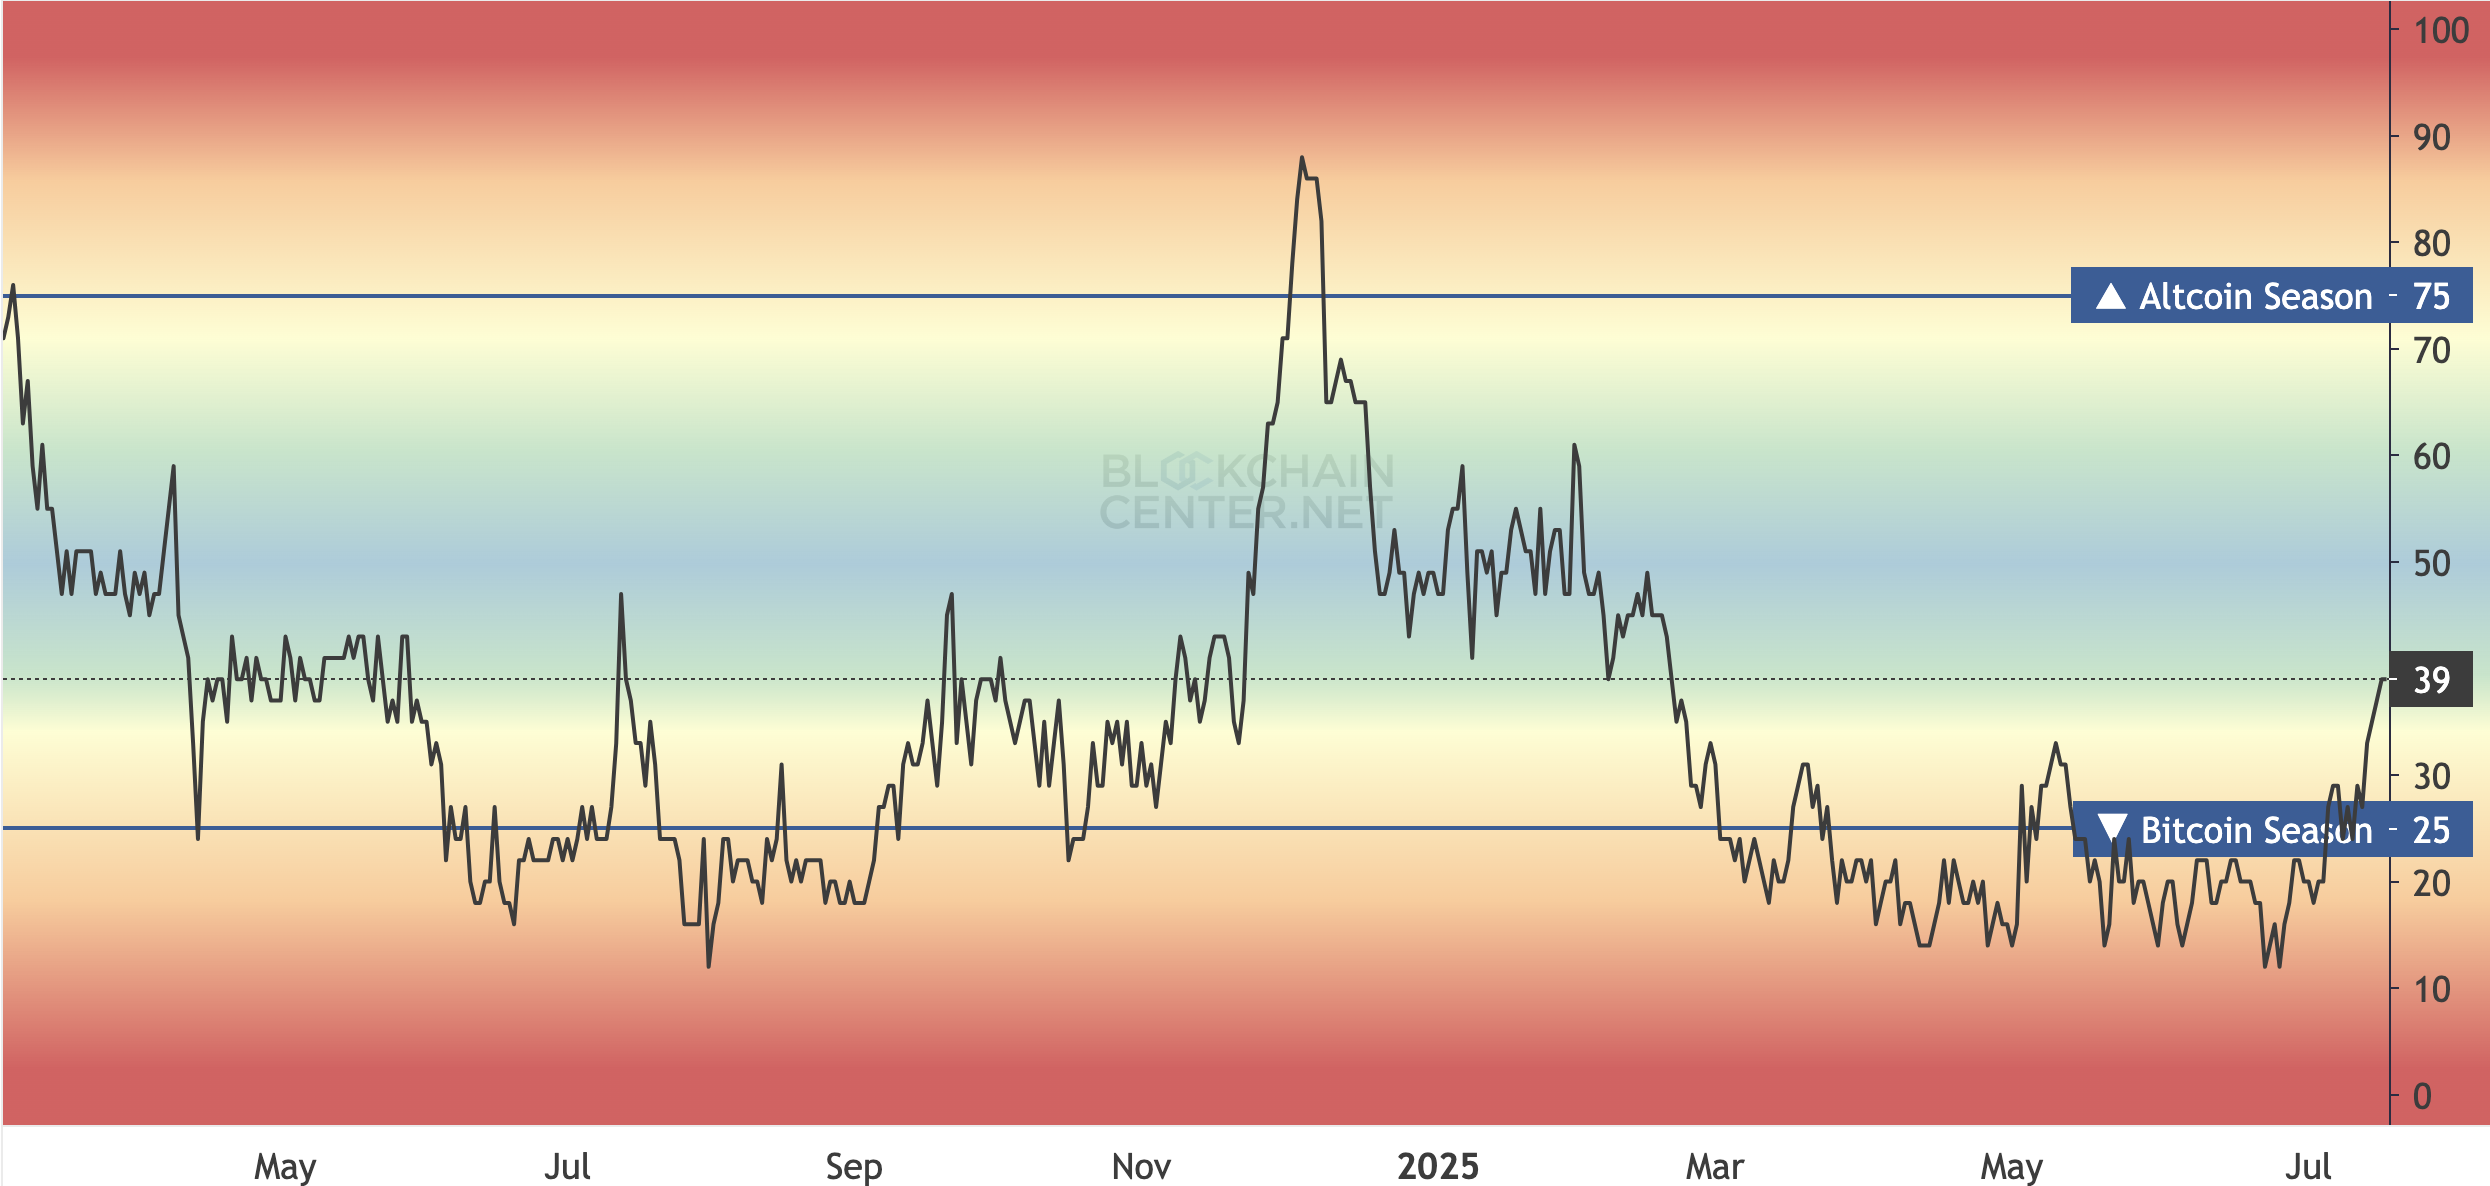
Once achieved, this could lead to a full altcoin season, a phase in which at least 75% of the top 50 cryptocurrencies outperform Bitcoin. The Altcoin Season Index supports this possibility.
This index ranges from 0 to 100 and must hit at least 75 to officially confirm altcoin season. As of now, it has surged to 39, the highest reading since February.
Back in February, the index stalled at 45, invalidating the altcoin season thesis. But this time might be different.
Over the past 90 days, several altcoins — including Sei (SEI), Stellar (XLM), Bonk (BONK), XRP, and others — have already outperformed Bitcoin.
If this trend holds, in the coming months, even more altcoins could take the lead, setting the stage for a sustained altcoin season.
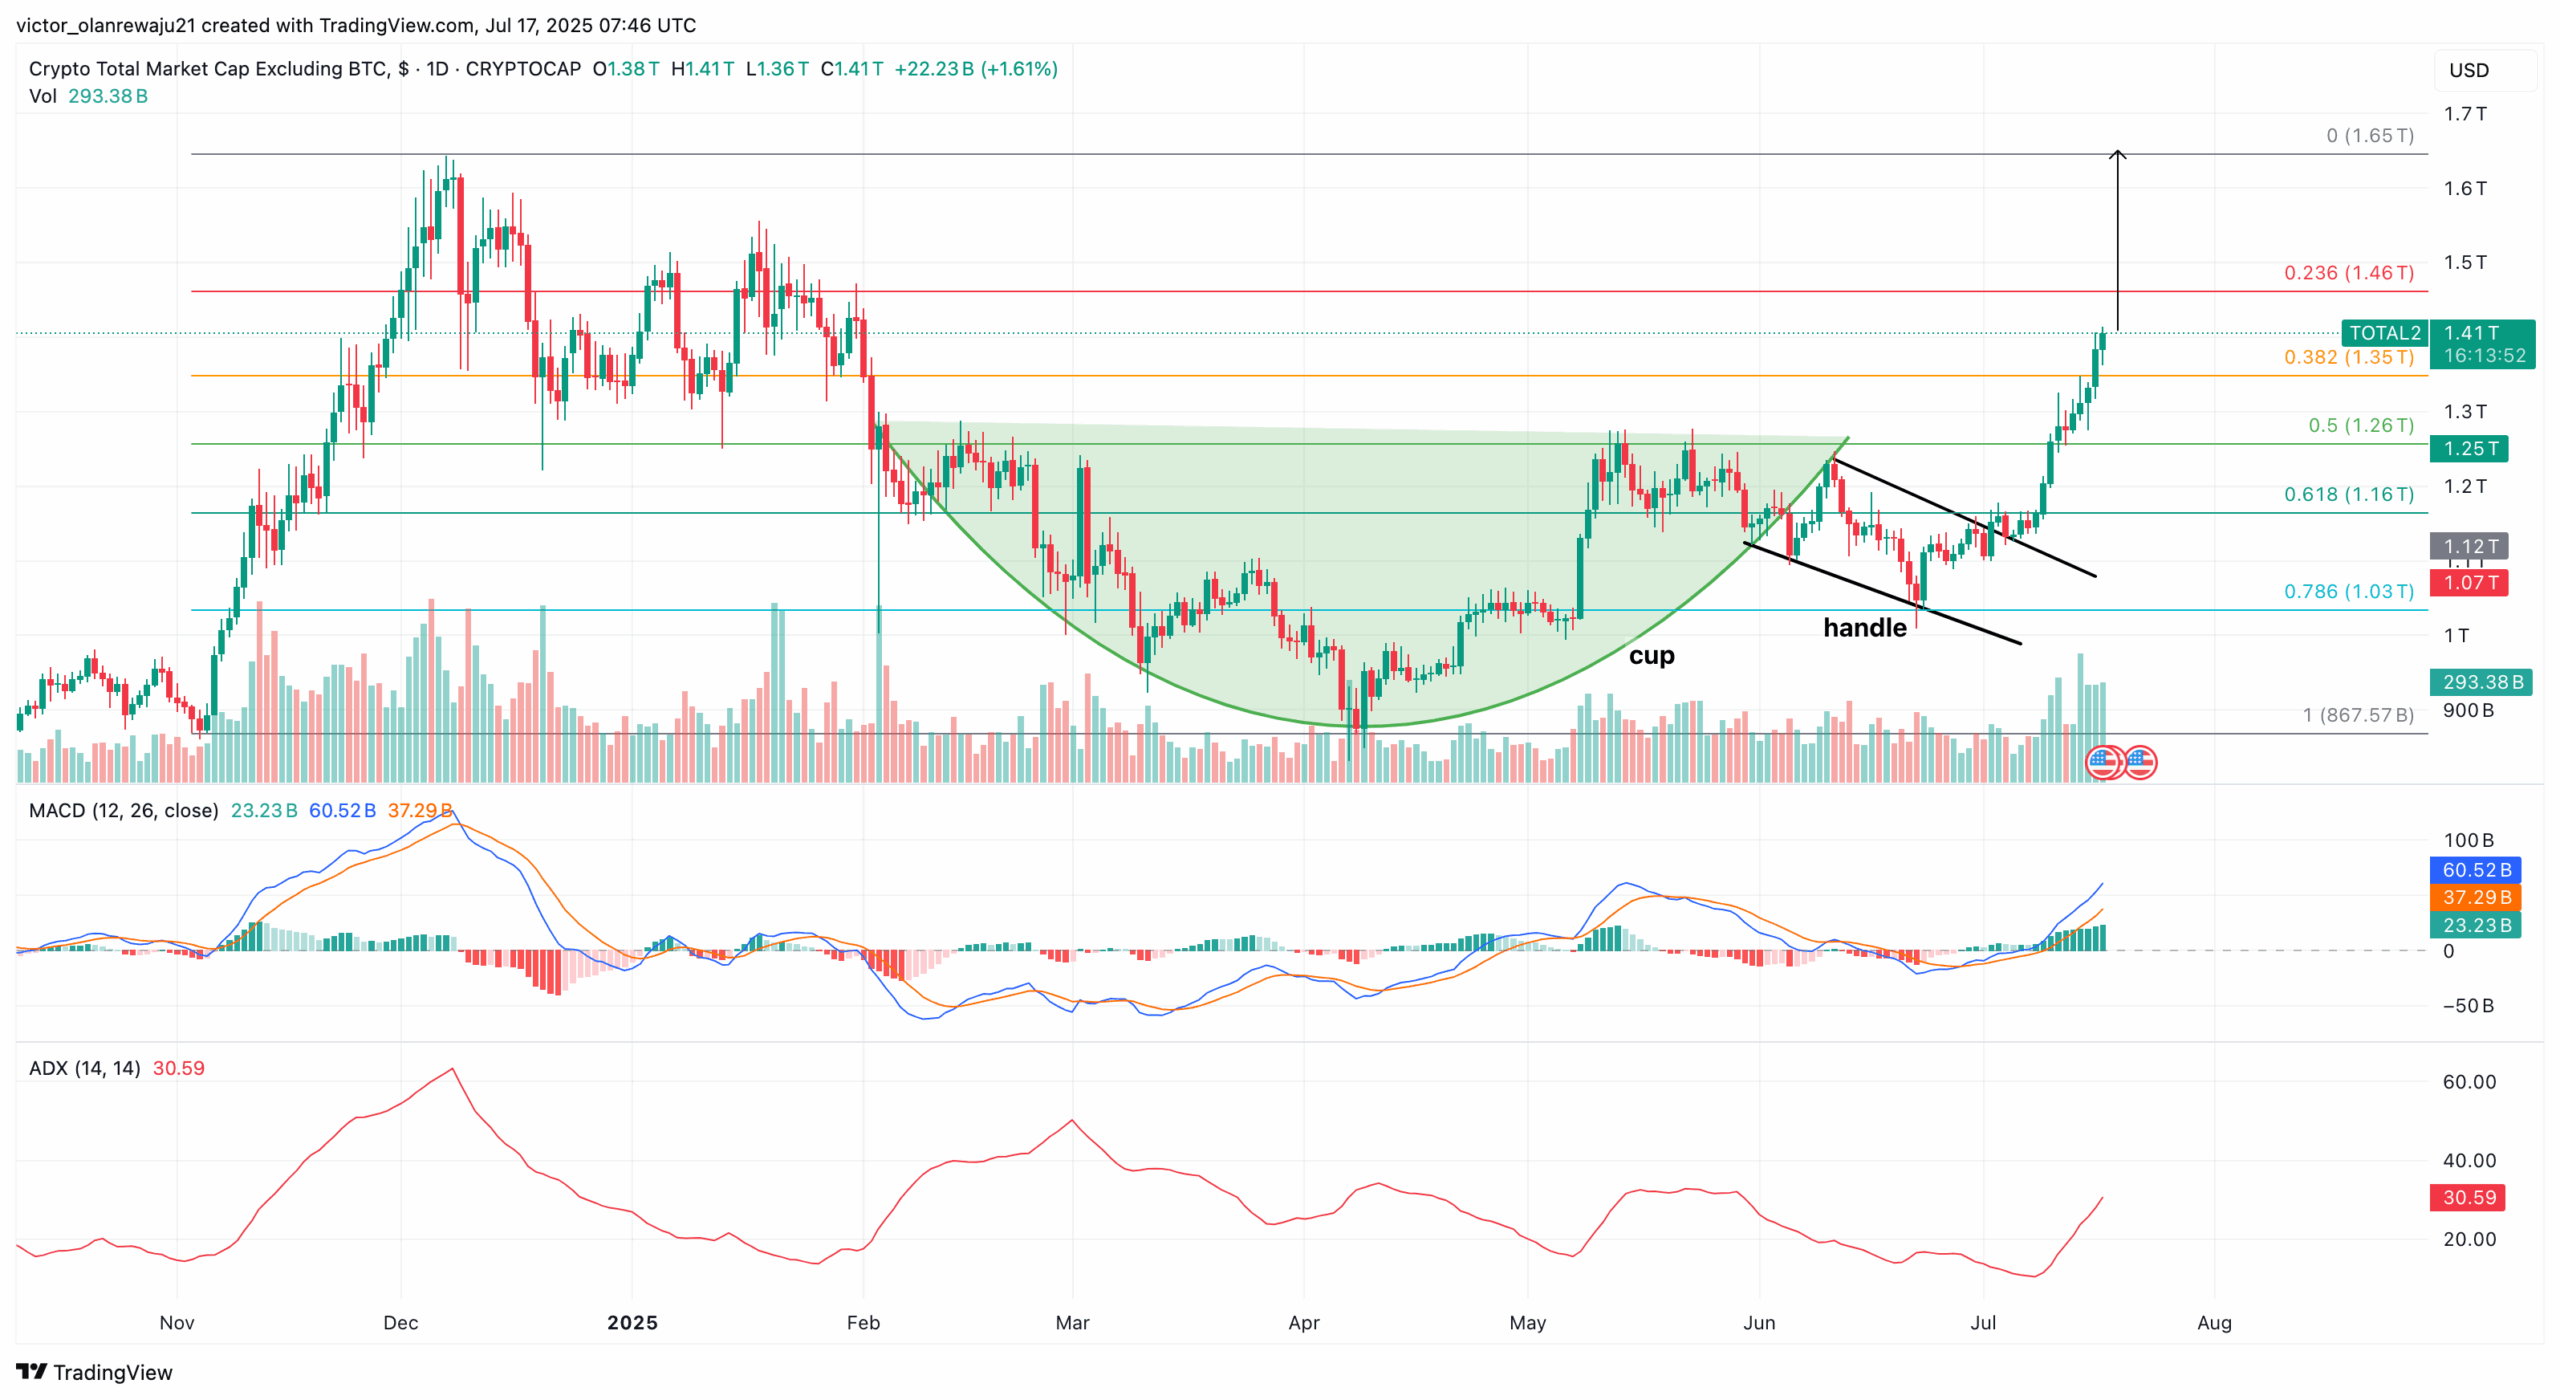
Moreover, unlike the BTC.D, the TOTAL2 chart — which tracks the market cap of the top 100 altcoins excluding Bitcoin — has flashed a bullish crossover. This signal suggests that altcoin prices could continue to climb in the weeks ahead.
Adding to the optimism, TOTAL2 broke out of a classic cup-and-handle pattern on the daily chart.
This formation is a bullish continuation pattern that signals the end of a consolidation phase and the start of a fresh rally. It begins with a rounded “cup” — shaped by a gradual decline and recovery — followed by a smaller, downward-sloping “handle,” representing a brief pullback before the breakout.
With the breakout confirmed, the next move could see the altcoin market cap soar from $1.41 trillion to $1.65 trillion. Like the bullish pattern, the Average Directional Index (ADX) has risen to 30.59, indicating that the uptrend is strong and could keep going higher.
Veteran analyst Peter Brandt also agreed, revealing on X that altcoin season might have begun in full force. Crypto analyst Michaël van de Poppe, like Brandt, agrees that altcoins will continue to trade higher.
“A potential bullish divergence on Altcoins. The good part: – It’s just a small start, there’s so much more upside to come,” van de Poppe stated.
Besides this, the analyst also mentioned that the recent Ethereum price rally, if sustained, might continue to attract capital and other altcoins.
Trend Tilts in ETH’s Favor
Technically, CCN examined the ETH/BTC chart. We observed that the pair has broken out of a bull flag.
This indicates that ETH’s price is on the front foot compared to BTC. Further, the Chaikin Money Flow (CMF) is far above the zero signal line, indicating increasing buying pressure for Ethereum over Bitcoin.
To support this, the green line of the Supertrend is below the pair, suggesting strong support for the uptrend. If sustained, the ETH/BTC pair might break above the 0.382 Fibonacci level and reach 0.035.
Disclaimer:
The information provided in this article is for informational purposes only. It is not intended to be, nor should it be construed as, financial advice. We do not make any warranties regarding the completeness, reliability, or accuracy of this information. All investments involve risk, and past performance does not guarantee future results. We recommend consulting a financial advisor before making any investment decisions.
Victor Olanrewaju is a crypto analyst and reporter at CCN with deep roots in on-chain research and technical analysis. His crypto journey began in 2017, but it was the 2020 Uniswap airdrop that sparked a full-time pivot into the space.
With a foundation in copywriting, Victor honed his craft creating high-converting content for leading crypto brokers — most notably an XRP price prediction that ranked #1 on Google during the 2021 bull run.
He later joined AMBCrypto in 2022, where he combined storytelling with technical and on-chain analysis to cover key market narratives.
In 2024, he expanded his expertise at BeInCrypto, collaborating with analysts and using tools like Glassnode, Santiment, and IntoTheBlock to break down Bitcoin and altcoin trends.
At CCN, Victor covers the top cryptocurrencies, memecoins, macro shifts, blending real-time insights with deep-dive metrics.
He holds a Bachelor’s degree in Physics from the University of Ibadan, equipping him to simplify complex data for a wide audience. Follow his work or connect on LinkedIn or X.