ALGO's breakout potential grows as it hovers near the 20 EMA | Credit: Hameem Sarwar
Share
Key Takeaways
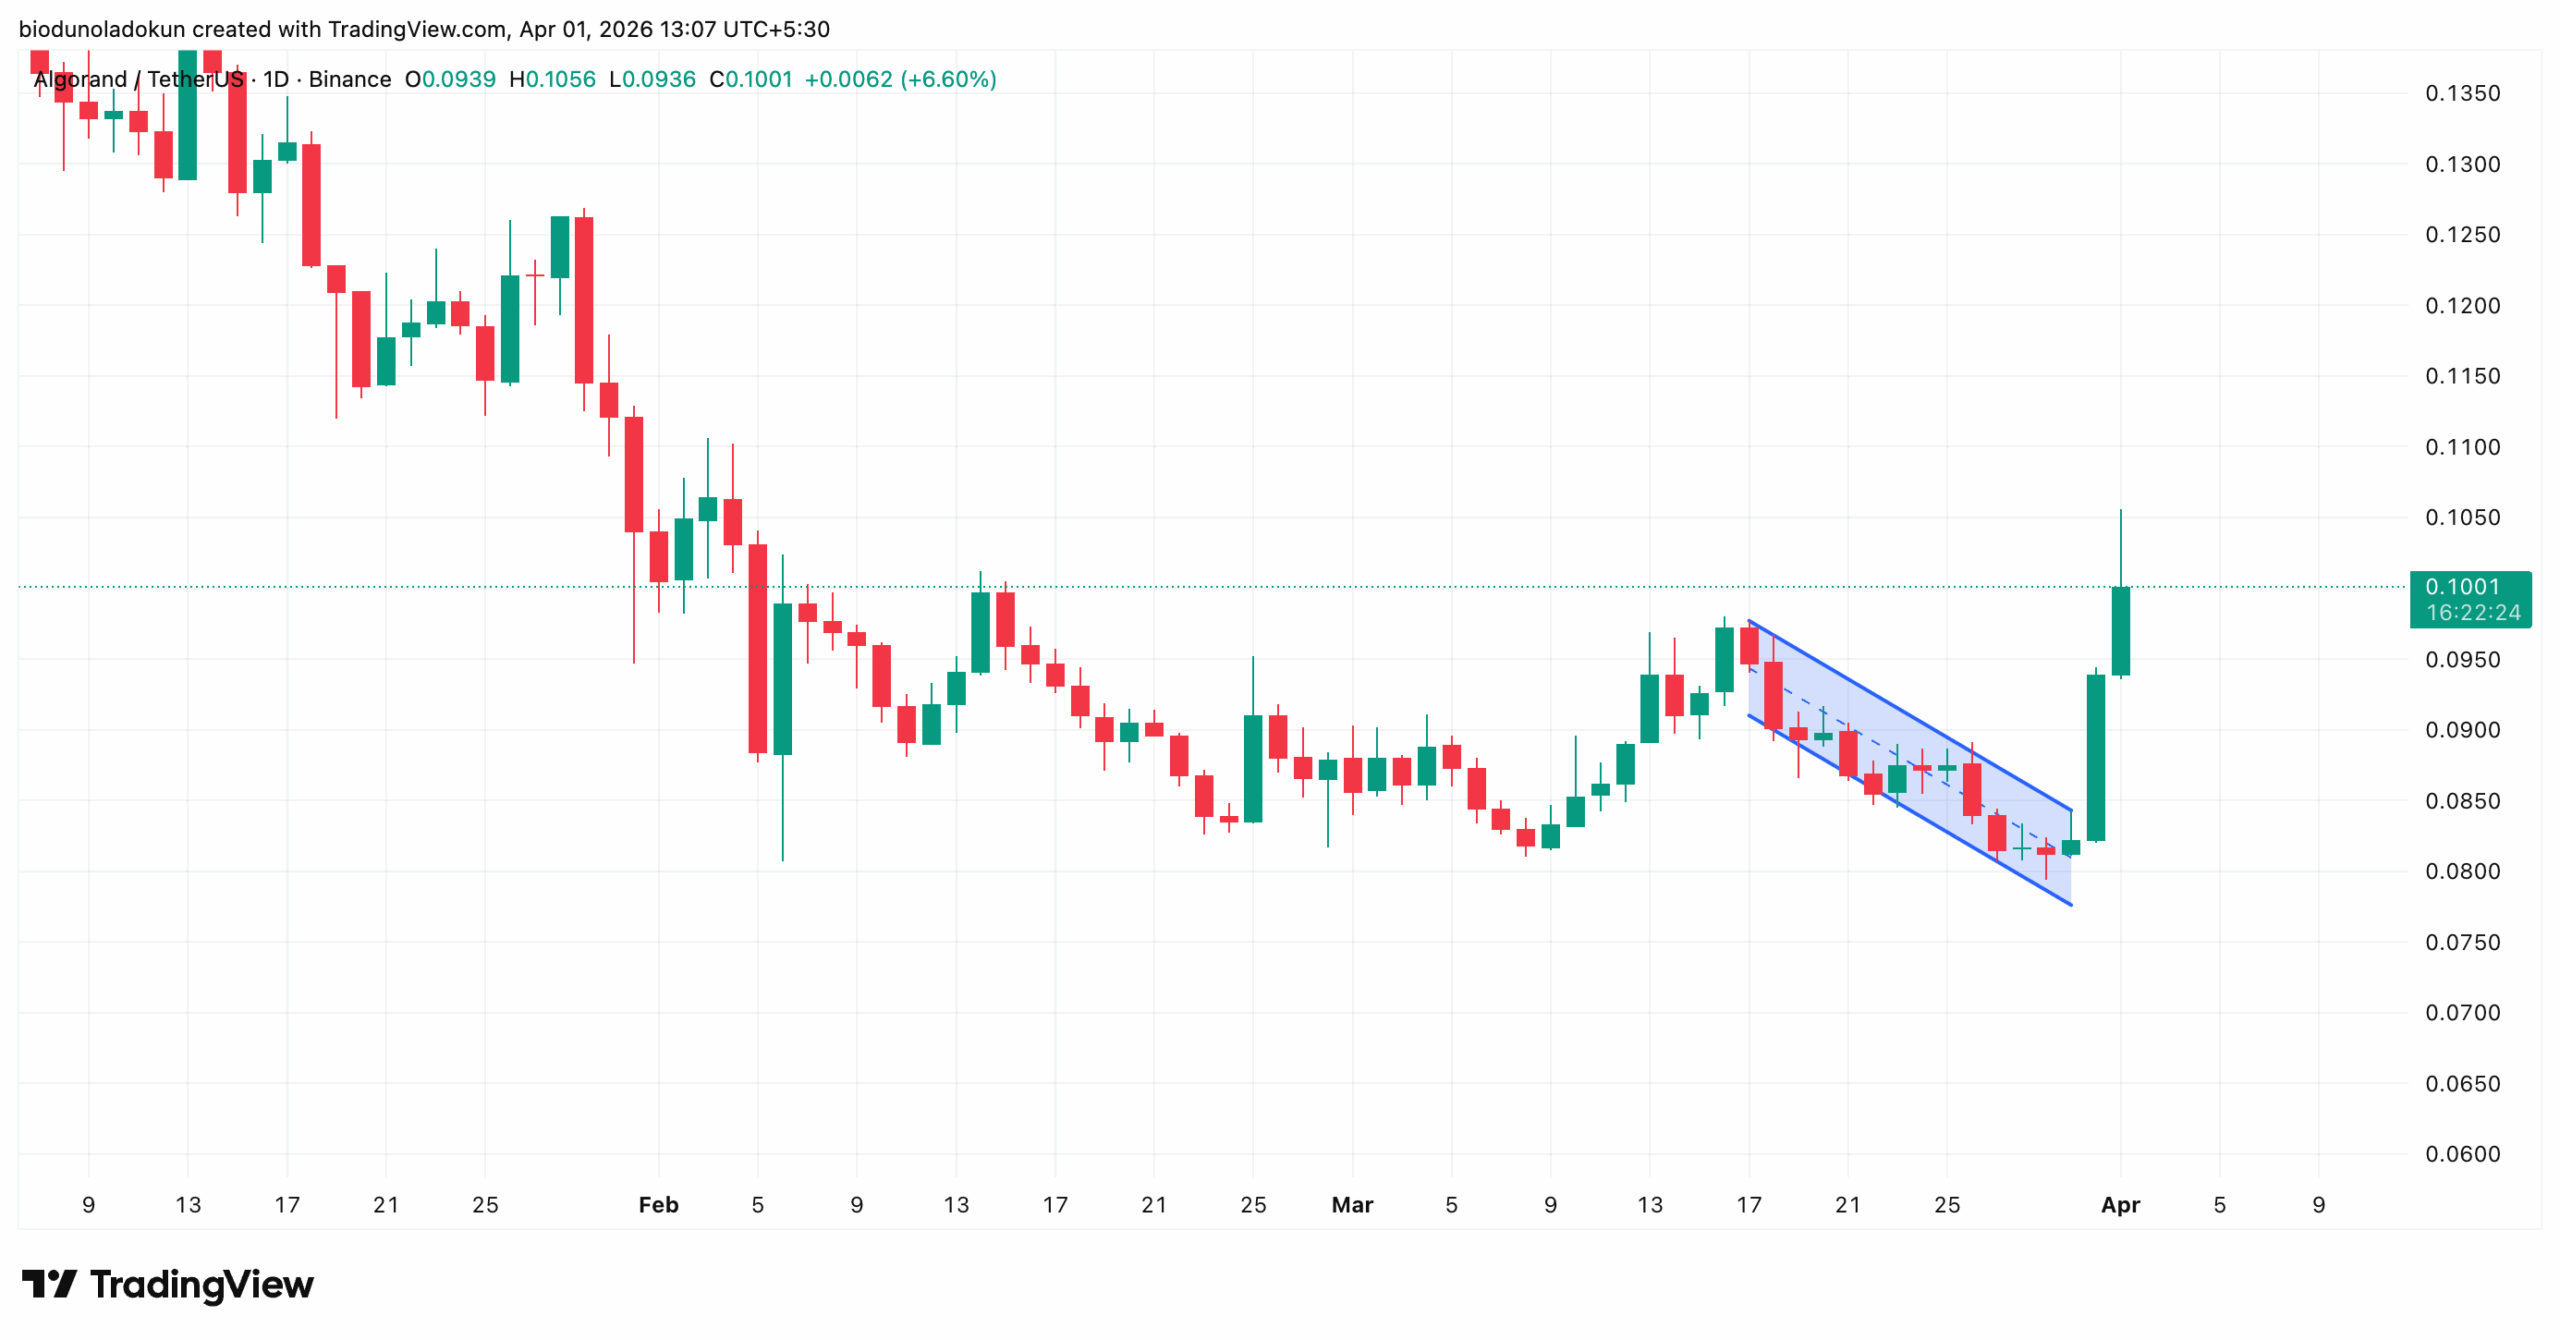
ALGO is up 23% on Wednesday after breaking out of a descending parallel channel that had compressed its price for 13 days and eroded 15% of its value.
Technical indicators — including a bullish MACD crossover, an Ichimoku Leading Span A breach, and a long/short ratio above 1 — suggest the uptrend may persist through April.
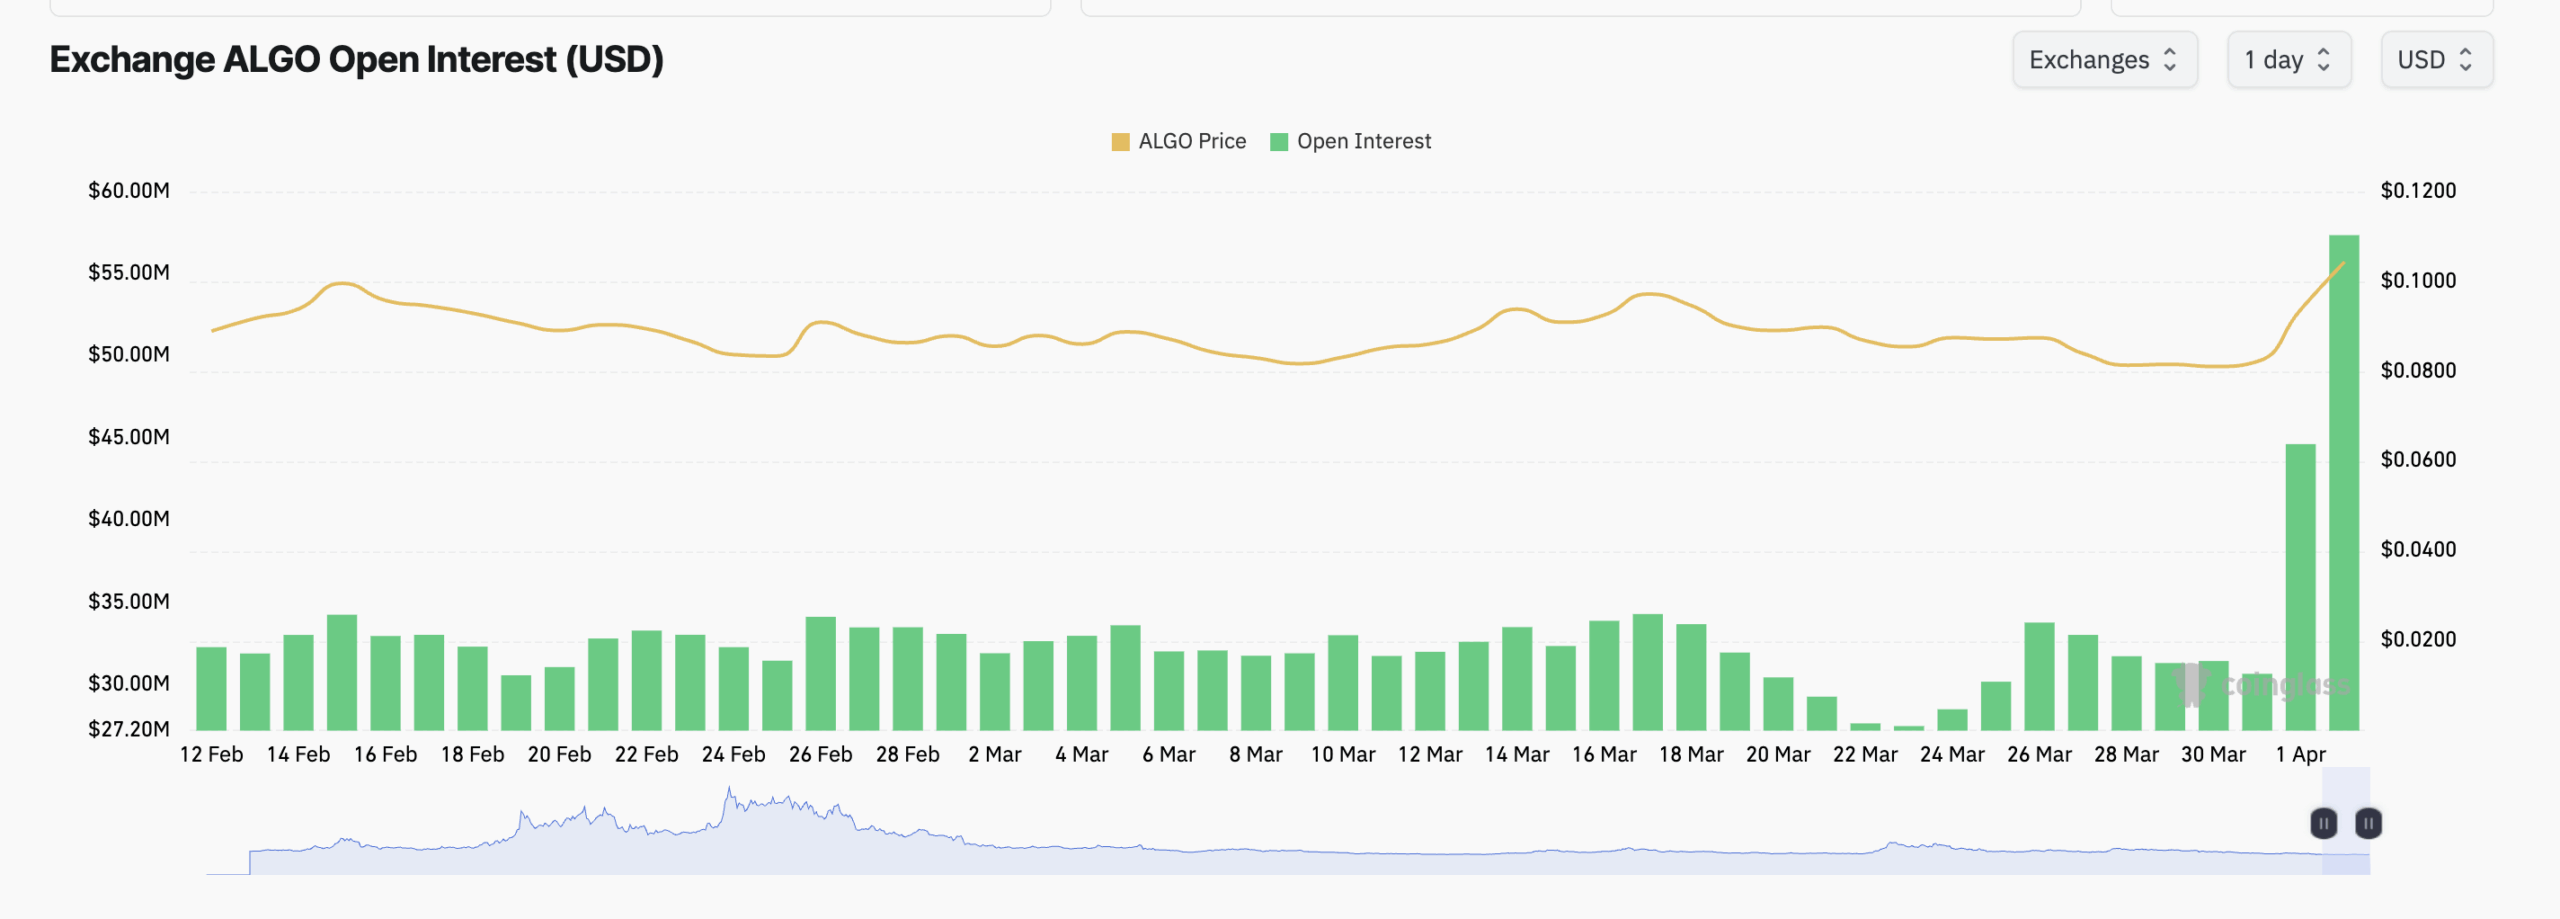
Open interest has surged 30% over the past 24 hours to a six-month high of $57.35 million, signaling fresh capital inflows.
Algorand’s native token ALGO is Wednesday’s top-performing asset in the crypto market. The altcoin has posted a 23% gain on the day.
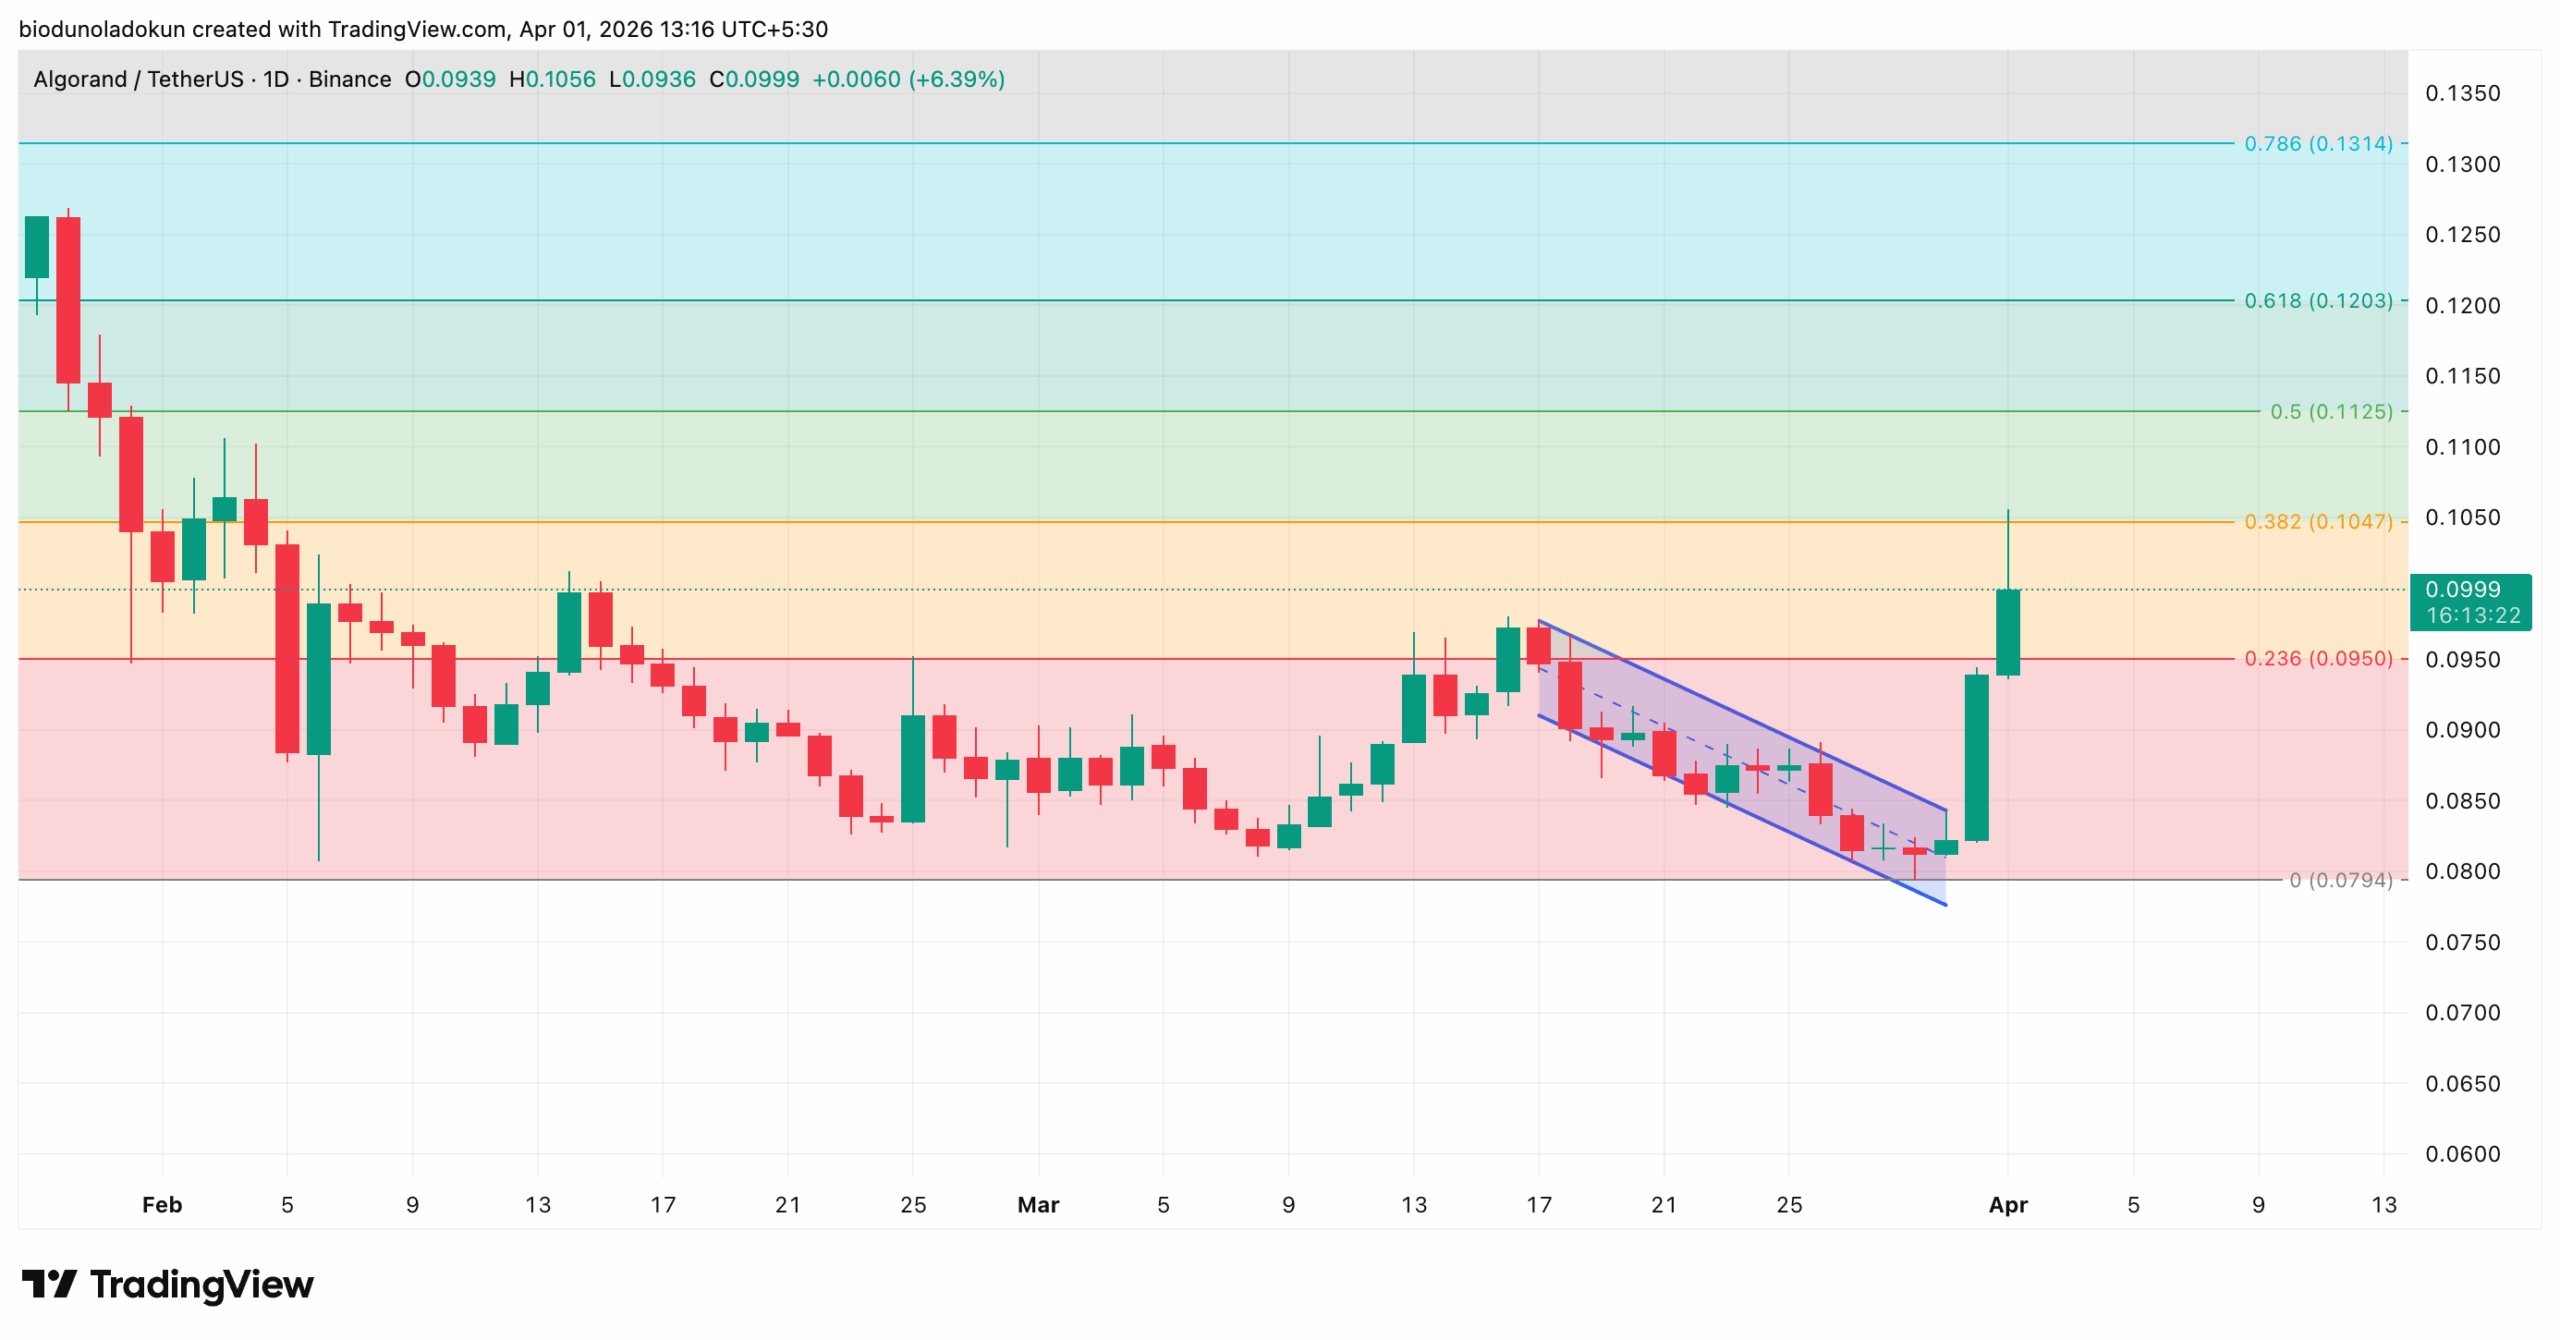
This follows a breakout from a descending parallel channel, which eroded 15% of its value over 13 days. The breakout marks a sharp reversal from the sustained bearish pressure that marked the last few weeks of March.
However, the timing of this is significant. Since 2019, ALGO has averaged a -1.66% decline in April. Will April 2026 be any different?
ALGO Snaps Two-Week Bearish Structure
Readings from the one-day chart show that ALGO traded within a descending parallel channel from March 17 to March 30.
This was due to the broader dip in demand for risk-based assets as macro uncertainty continued to dampen investor sentiment, causing ALGO to shed 15% of its value within those two weeks.
However, buyers stepped in decisively on Tuesday, forcing a clean break to the upside and a close above the upper line of the descending parallel channel.
Some key technical indicators now suggest the uptrend may persist through April.
ALGO Bulls Take Position
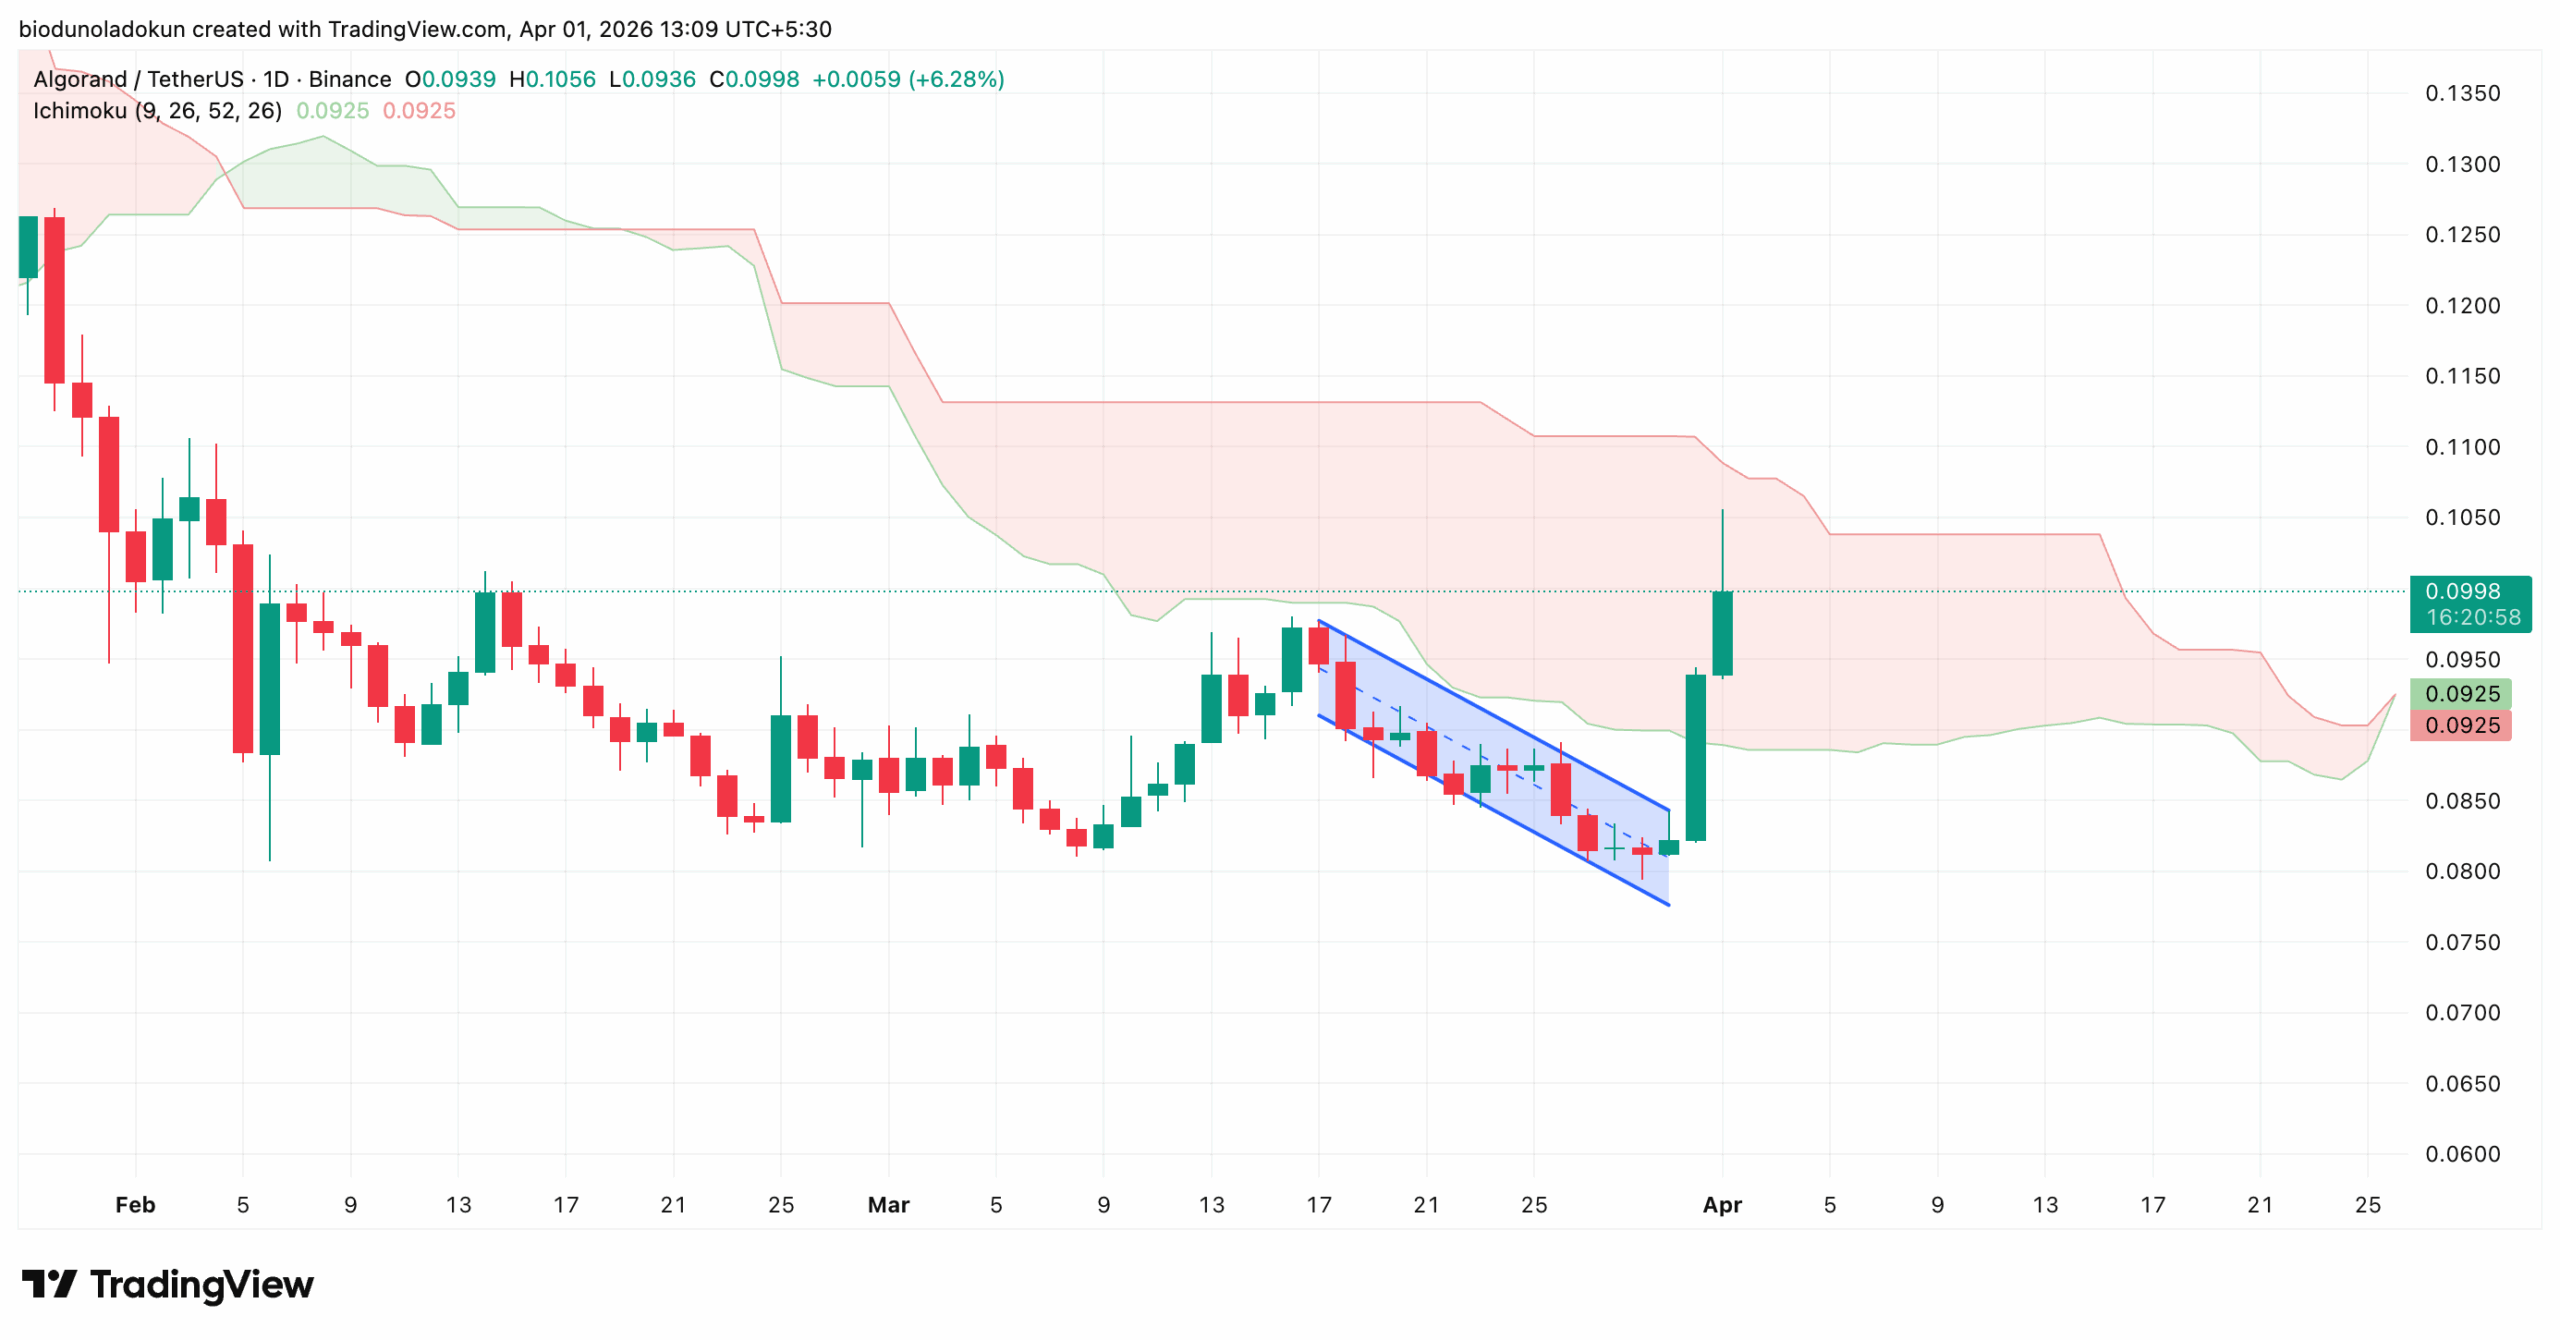
ALGO’s double-digit rally over the past day has pushed its price above the Leading Span A (green line) of its Ichimoku Cloud and is now trending toward the Leading Span B (red line).
This indicator tracks the momentum of an asset’s price trend and identifies potential support and resistance levels.
Breaching the Leading Span A signals that ALGO has cleared its first major cloud resistance, reflecting a meaningful shift in short-term momentum. It suggests that buyers are beginning to assert control after weeks of sustained selling pressure.
An eventual break above the Leading Span B would confirm a full cloud breakout. This pattern typically indicates that the broader trend has decisively flipped in favor of buyers.
Should buying pressure remain consistent, the Ichimoku setup suggests that ALGO has the foundation to sustain its current uptrend through April.
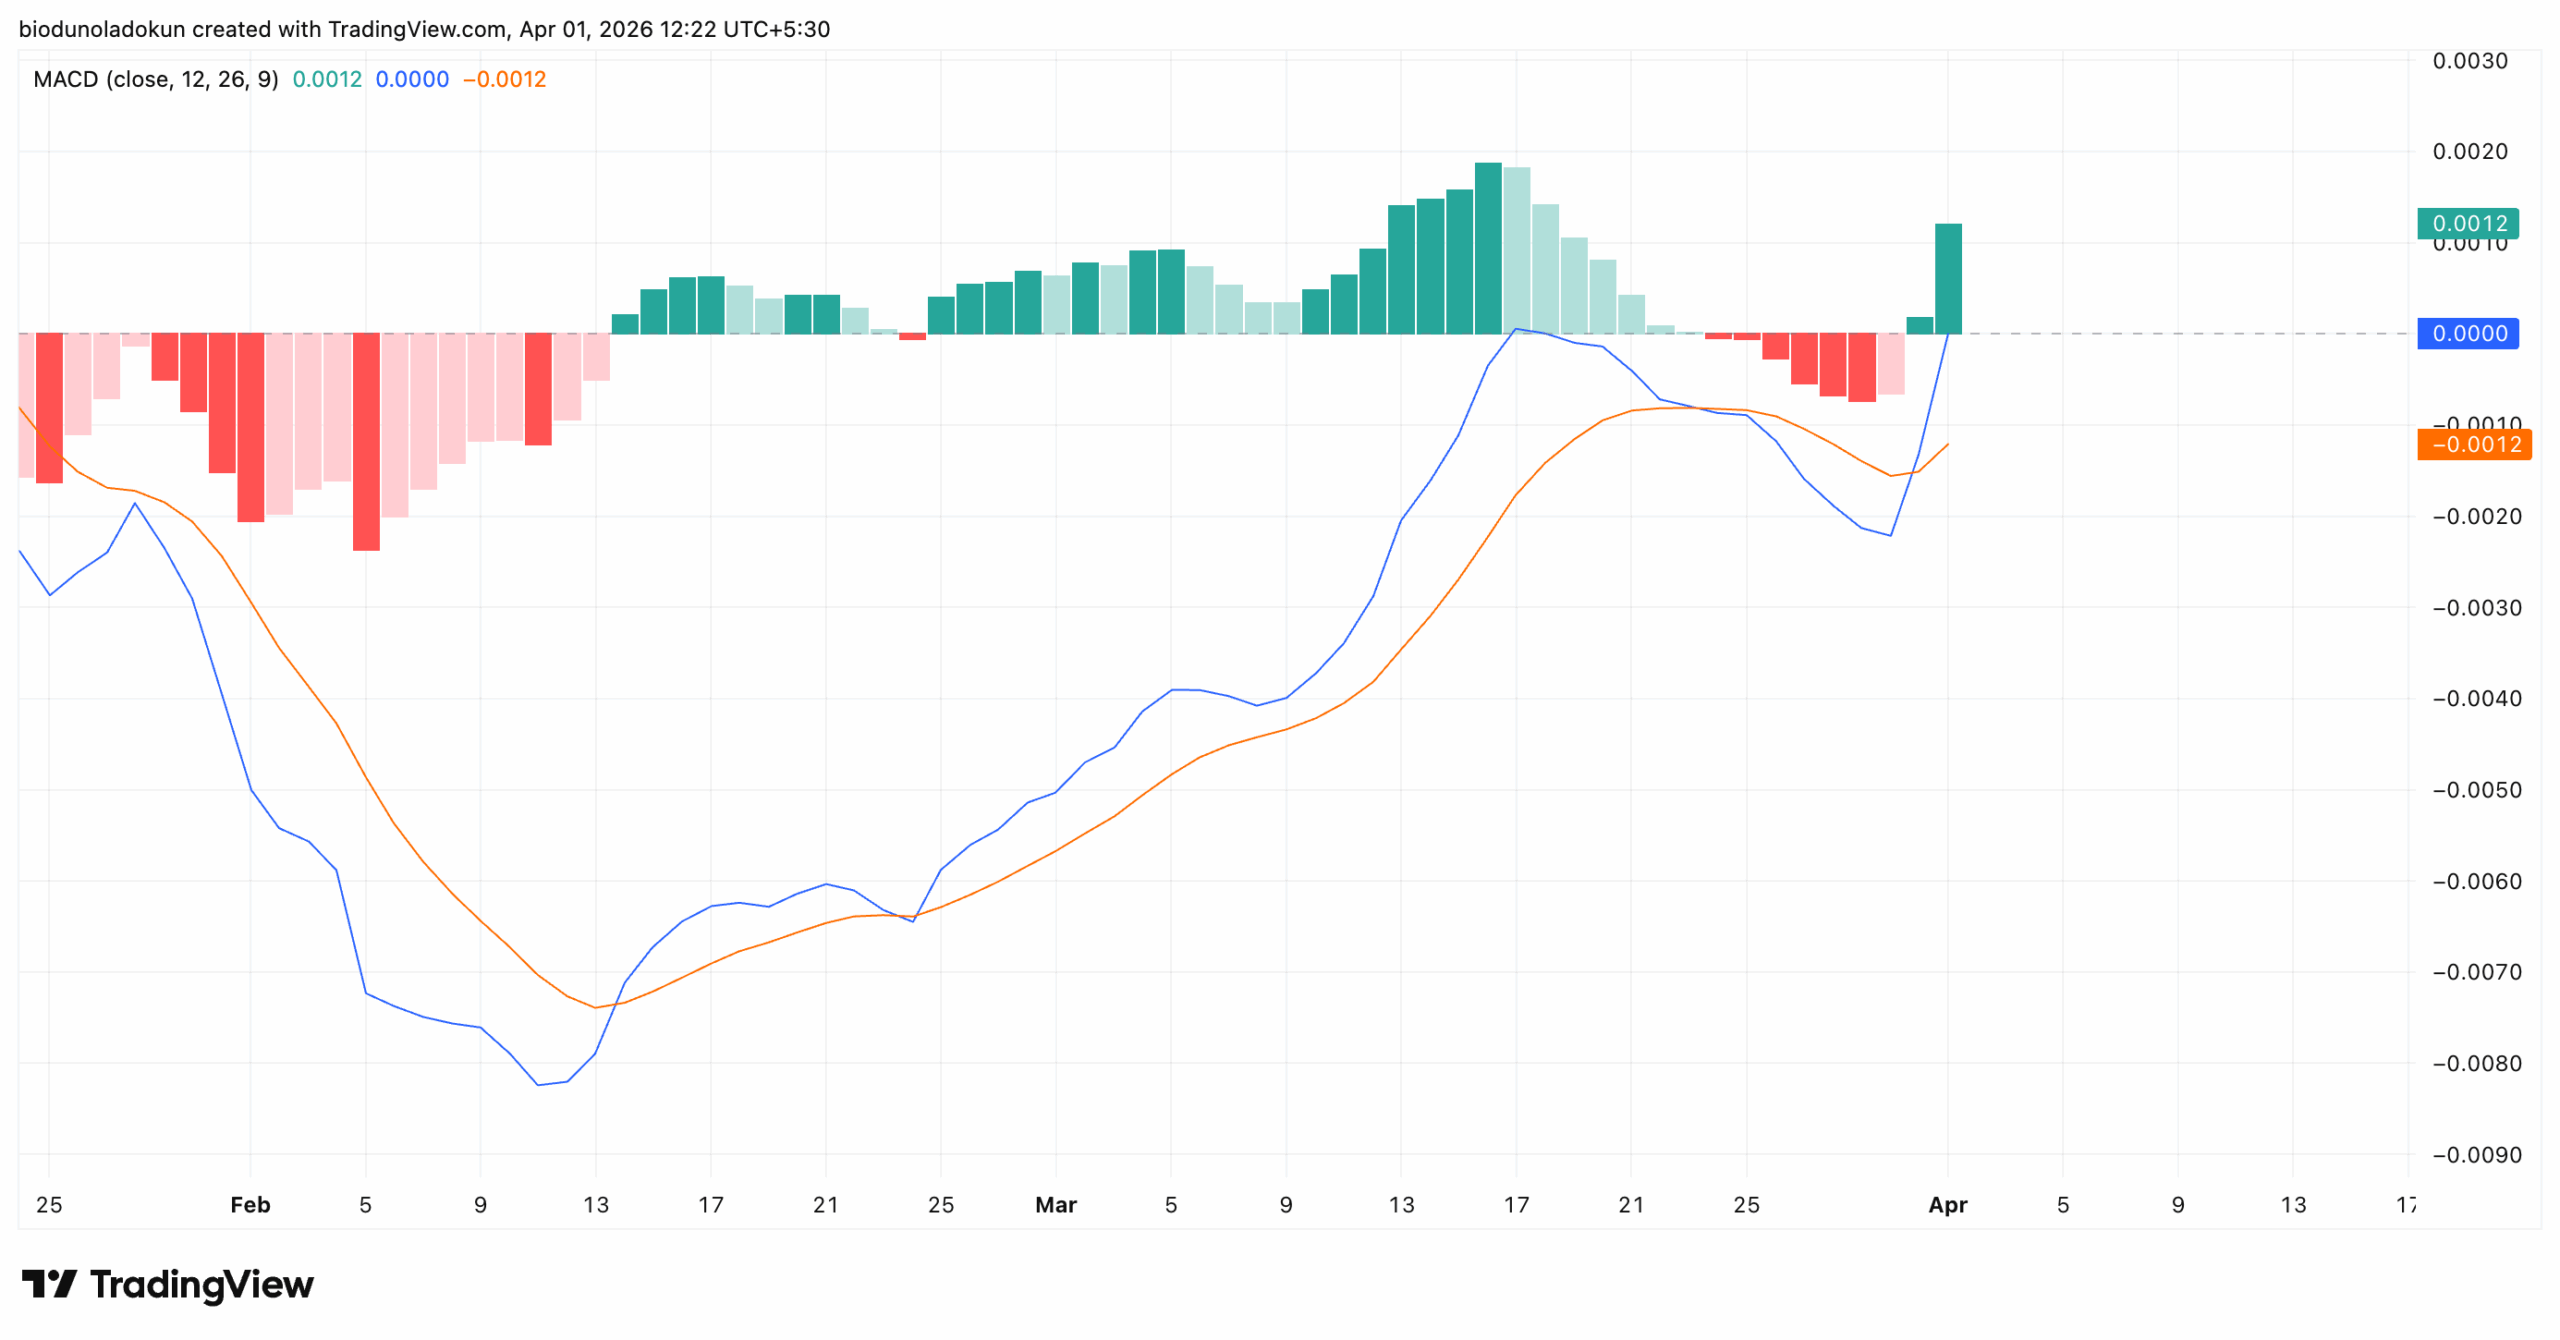
In addition, ALGO’s Moving Average Convergence Divergence (MACD) indicator supports the bullish case. The token’s price breakout during Tuesday’s session triggered a bullish crossover, with the MACD line (blue) crossing above the signal line (orange).
Historically, when the MACD bullish crossover occurs in tandem with a price breakout, as is the case here, it adds some conviction to the uptrend.
Moreover, the indicator’s histogram has flipped green, with its bars expanding in height over the past two sessions. This confirms that bullish momentum is building rather than fading.
In the last week of March, ALGO’s MACD histogram printed only red, reflecting the sustained selling pressure that defined the descending channel period.
The shift to green bars at the start of April suggests growing confidence among market participants, which may help sustain a price hike throughout the month.
Derivatives Data Backs ALGO’s Rally
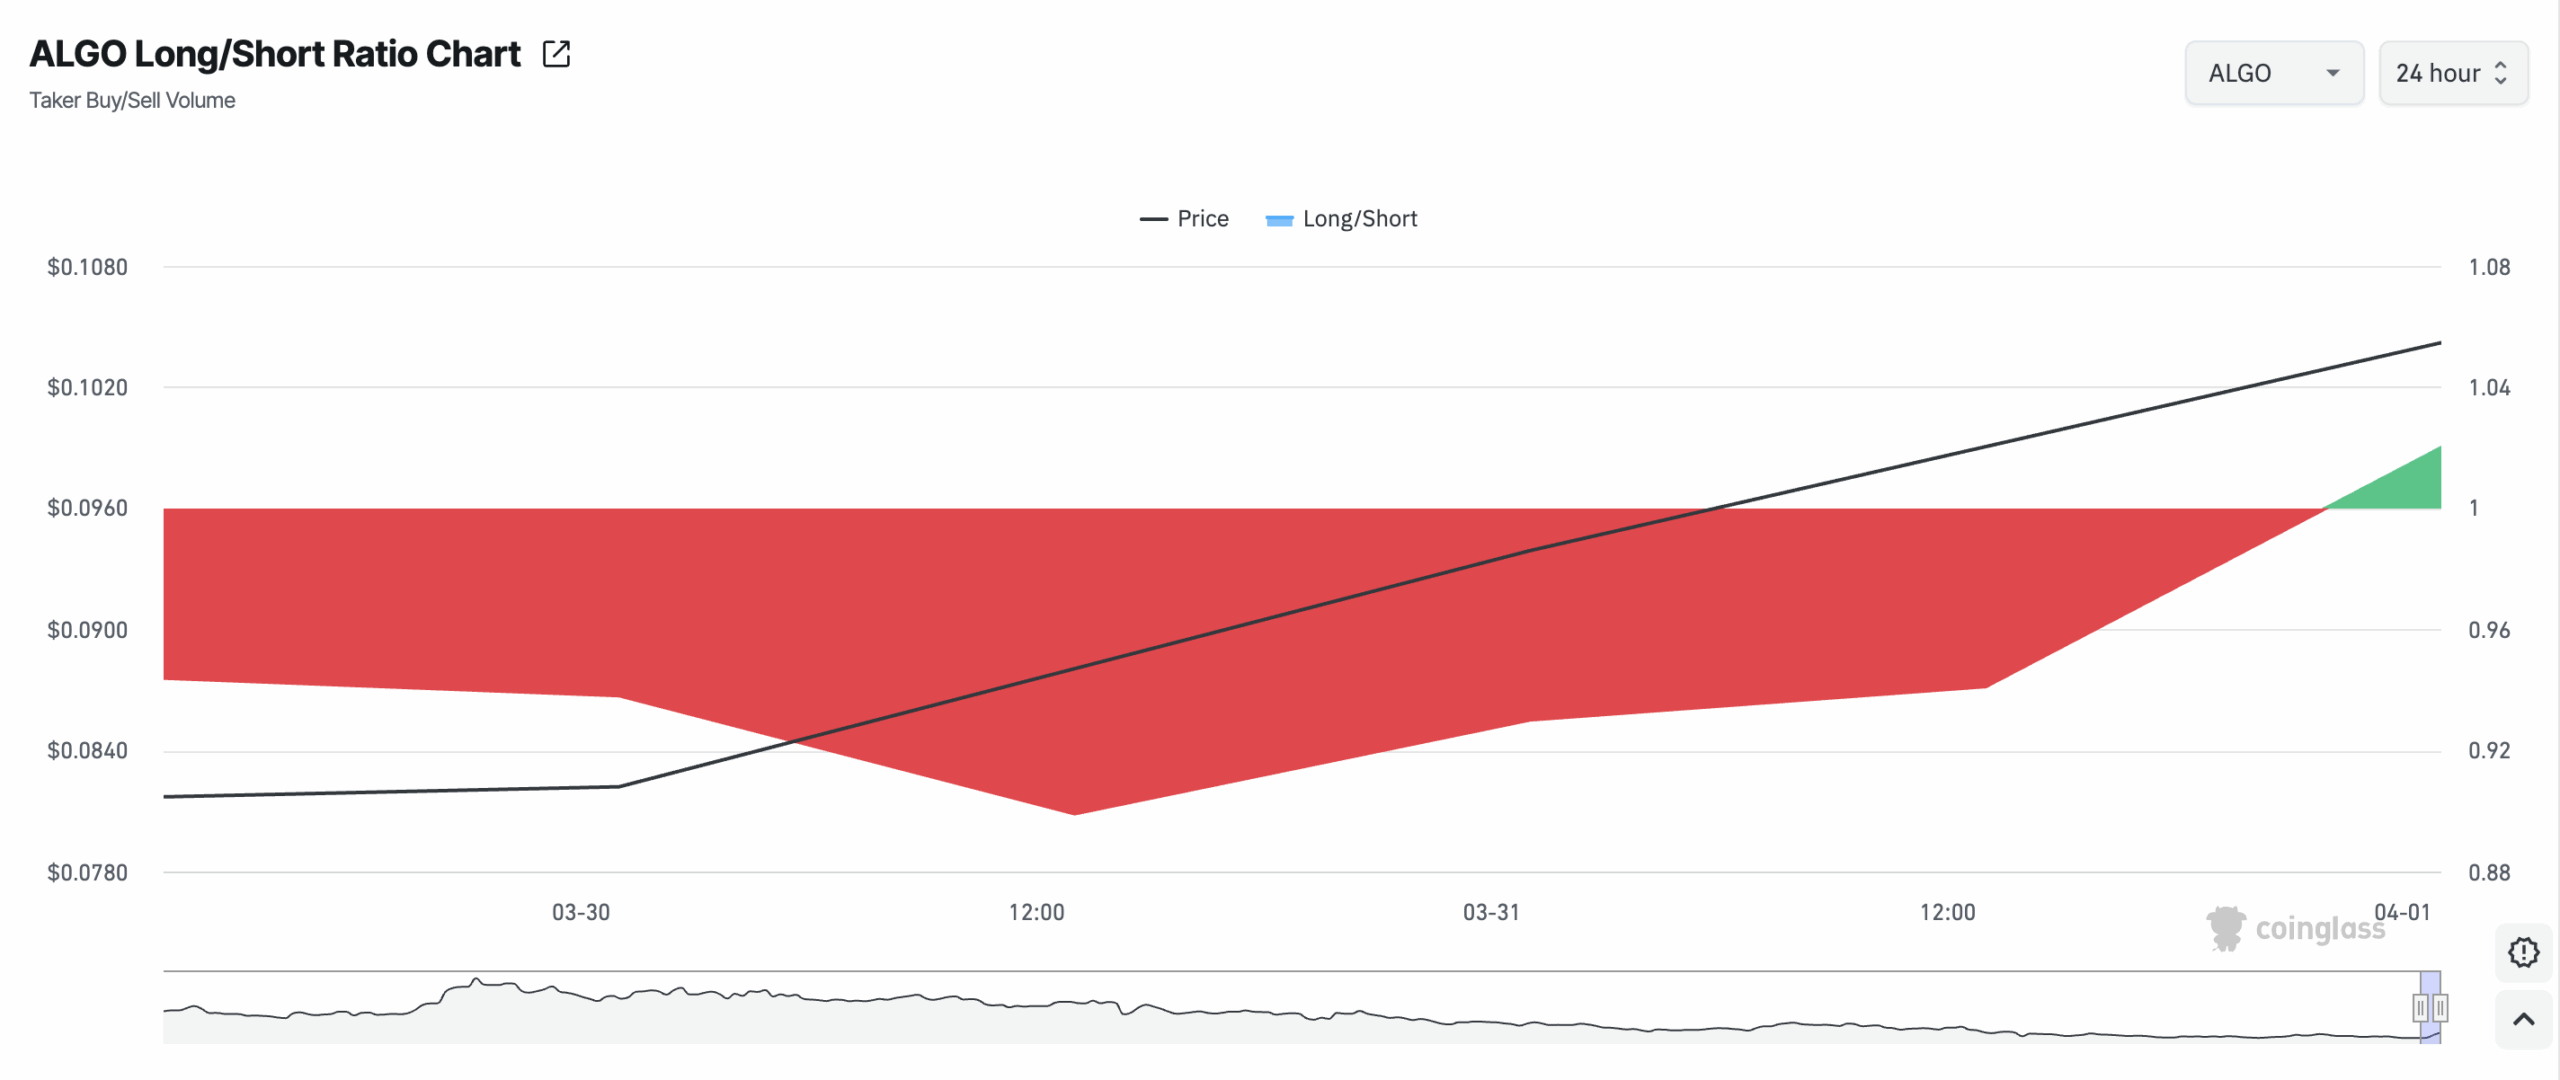
According to Coinglass, ALGO’s long/short ratio, which had primarily been in the red for several weeks, has flipped green again today, a signal that traders are increasingly positioning for further upside. As of this writing, the ratio sits at 1.02.
The long/short ratio tracks the balance between traders betting on price increases (longs) versus those betting on declines (shorts).
When the ratio is above 1, it indicates that long positions dominate, signaling bullish sentiment; conversely, a ratio below 1 suggests that short positions are heavier, signaling bearish sentiment.
ALGO’s climbing ratio suggests sentiment among derivatives traders is slowly turning bullish and could sustain the token’s price rally.
Furthermore, Coinglass data shows a sharp uptick in ALGO’s open interest. Up 30% over the past day, it sits at a six-month high of $57.35 million at press time.
This indicates that a significant amount of capital has rotated into ALGO positions in the last 24 hours.
An asset’s open interest measures the total number of outstanding derivative contracts, such as futures or options, that have not been settled. When it rises alongside price, it indicates new money is entering the market.
In ALGO’s case, the breakout suggests it is attracting fresh capital, a trend that could help drive its price higher as April progresses.
Bulls Must Hold $0.0950 or Risk a Retest of ALGO’s All-Time Low
ALGO currently trades at $0.0999, consolidating just below the 0.382 Fibonacci retracement level at $0.1047.
With the gradual bullish shift in market sentiment reflected across technical and derivatives indicators, buying pressure could push ALGO above this price wall.
A daily close above $0.1047 would open the door to $0.1125, representing an 11% gain from current prices.
Should momentum hold beyond that, ALGO could climb to $0.1203 over the next few weeks.
Disclaimer:
The information provided in this article is for informational purposes only. It is not intended to be, nor should it be construed as, financial advice. We do not make any warranties regarding the completeness, reliability, or accuracy of this information. All investments involve risk, and past performance does not guarantee future results. We recommend consulting a financial advisor before making any investment decisions.
Abiodun Oladokun is a Research Analyst at CCN, where he covers cryptocurrency markets with a focus on on-chain analysis, technical assessments, and emerging trends across decentralized finance (DeFi), real-world assets (RWA), artificial intelligence (AI), decentralized physical infrastructure networks (DePIN), Layer 2s, and meme coins.
Prior to CCN, he served as a Senior On-Chain Analyst at BeInCrypto, producing market reports spanning diverse crypto sectors.
Before that, he conducted technical analysis and market assessments of various altcoins at AMBCrypto, where he also contributed long-form quarterly research papers on DeFi, NFTs, DAOs, and scaling architectures, leveraging on-chain platforms including Messari, Santiment, DefiLlama, and Dune Analytics.
He began his crypto career as a research analyst at SixthSense DAO, developing blockchain forensic tools to trace the history of stolen assets.
Abiodun is a lawyer called to the Nigerian Bar and the founder of Ilé Ijó, a Lagos-based electronic dance music collective.