Akash Network's AKT targets full recovery | Credit: Hameem Sarwar
Share
Key Takeaways
AKT has surged by 80% over the past 30 days as supply tightens; however, it has faced strong rejection near $0.60.
March 23’s Burn-Mint Equilibrium reinforces $AKT’s utility and scarcity, supporting potential future demand.
A sustained push above $0.63 could trigger continuation toward $0.75, whereas failure may lead to a pullback.
AKT, native coin of the Akash Network, has surged 80% over the past 30 days.
This has made it one of the strongest-performing assets in the decentralised AI infrastructure sector amid broader crypto markets navigating significant macro turbulence.
However, the rally is not driven solely by speculation. It is anchored in a specific and increasingly powerful tokenomic mechanism.
Here is a breakdown of everything that has happened and what lies ahead for the AKT coin price.
AKT Price Enters Tight Range
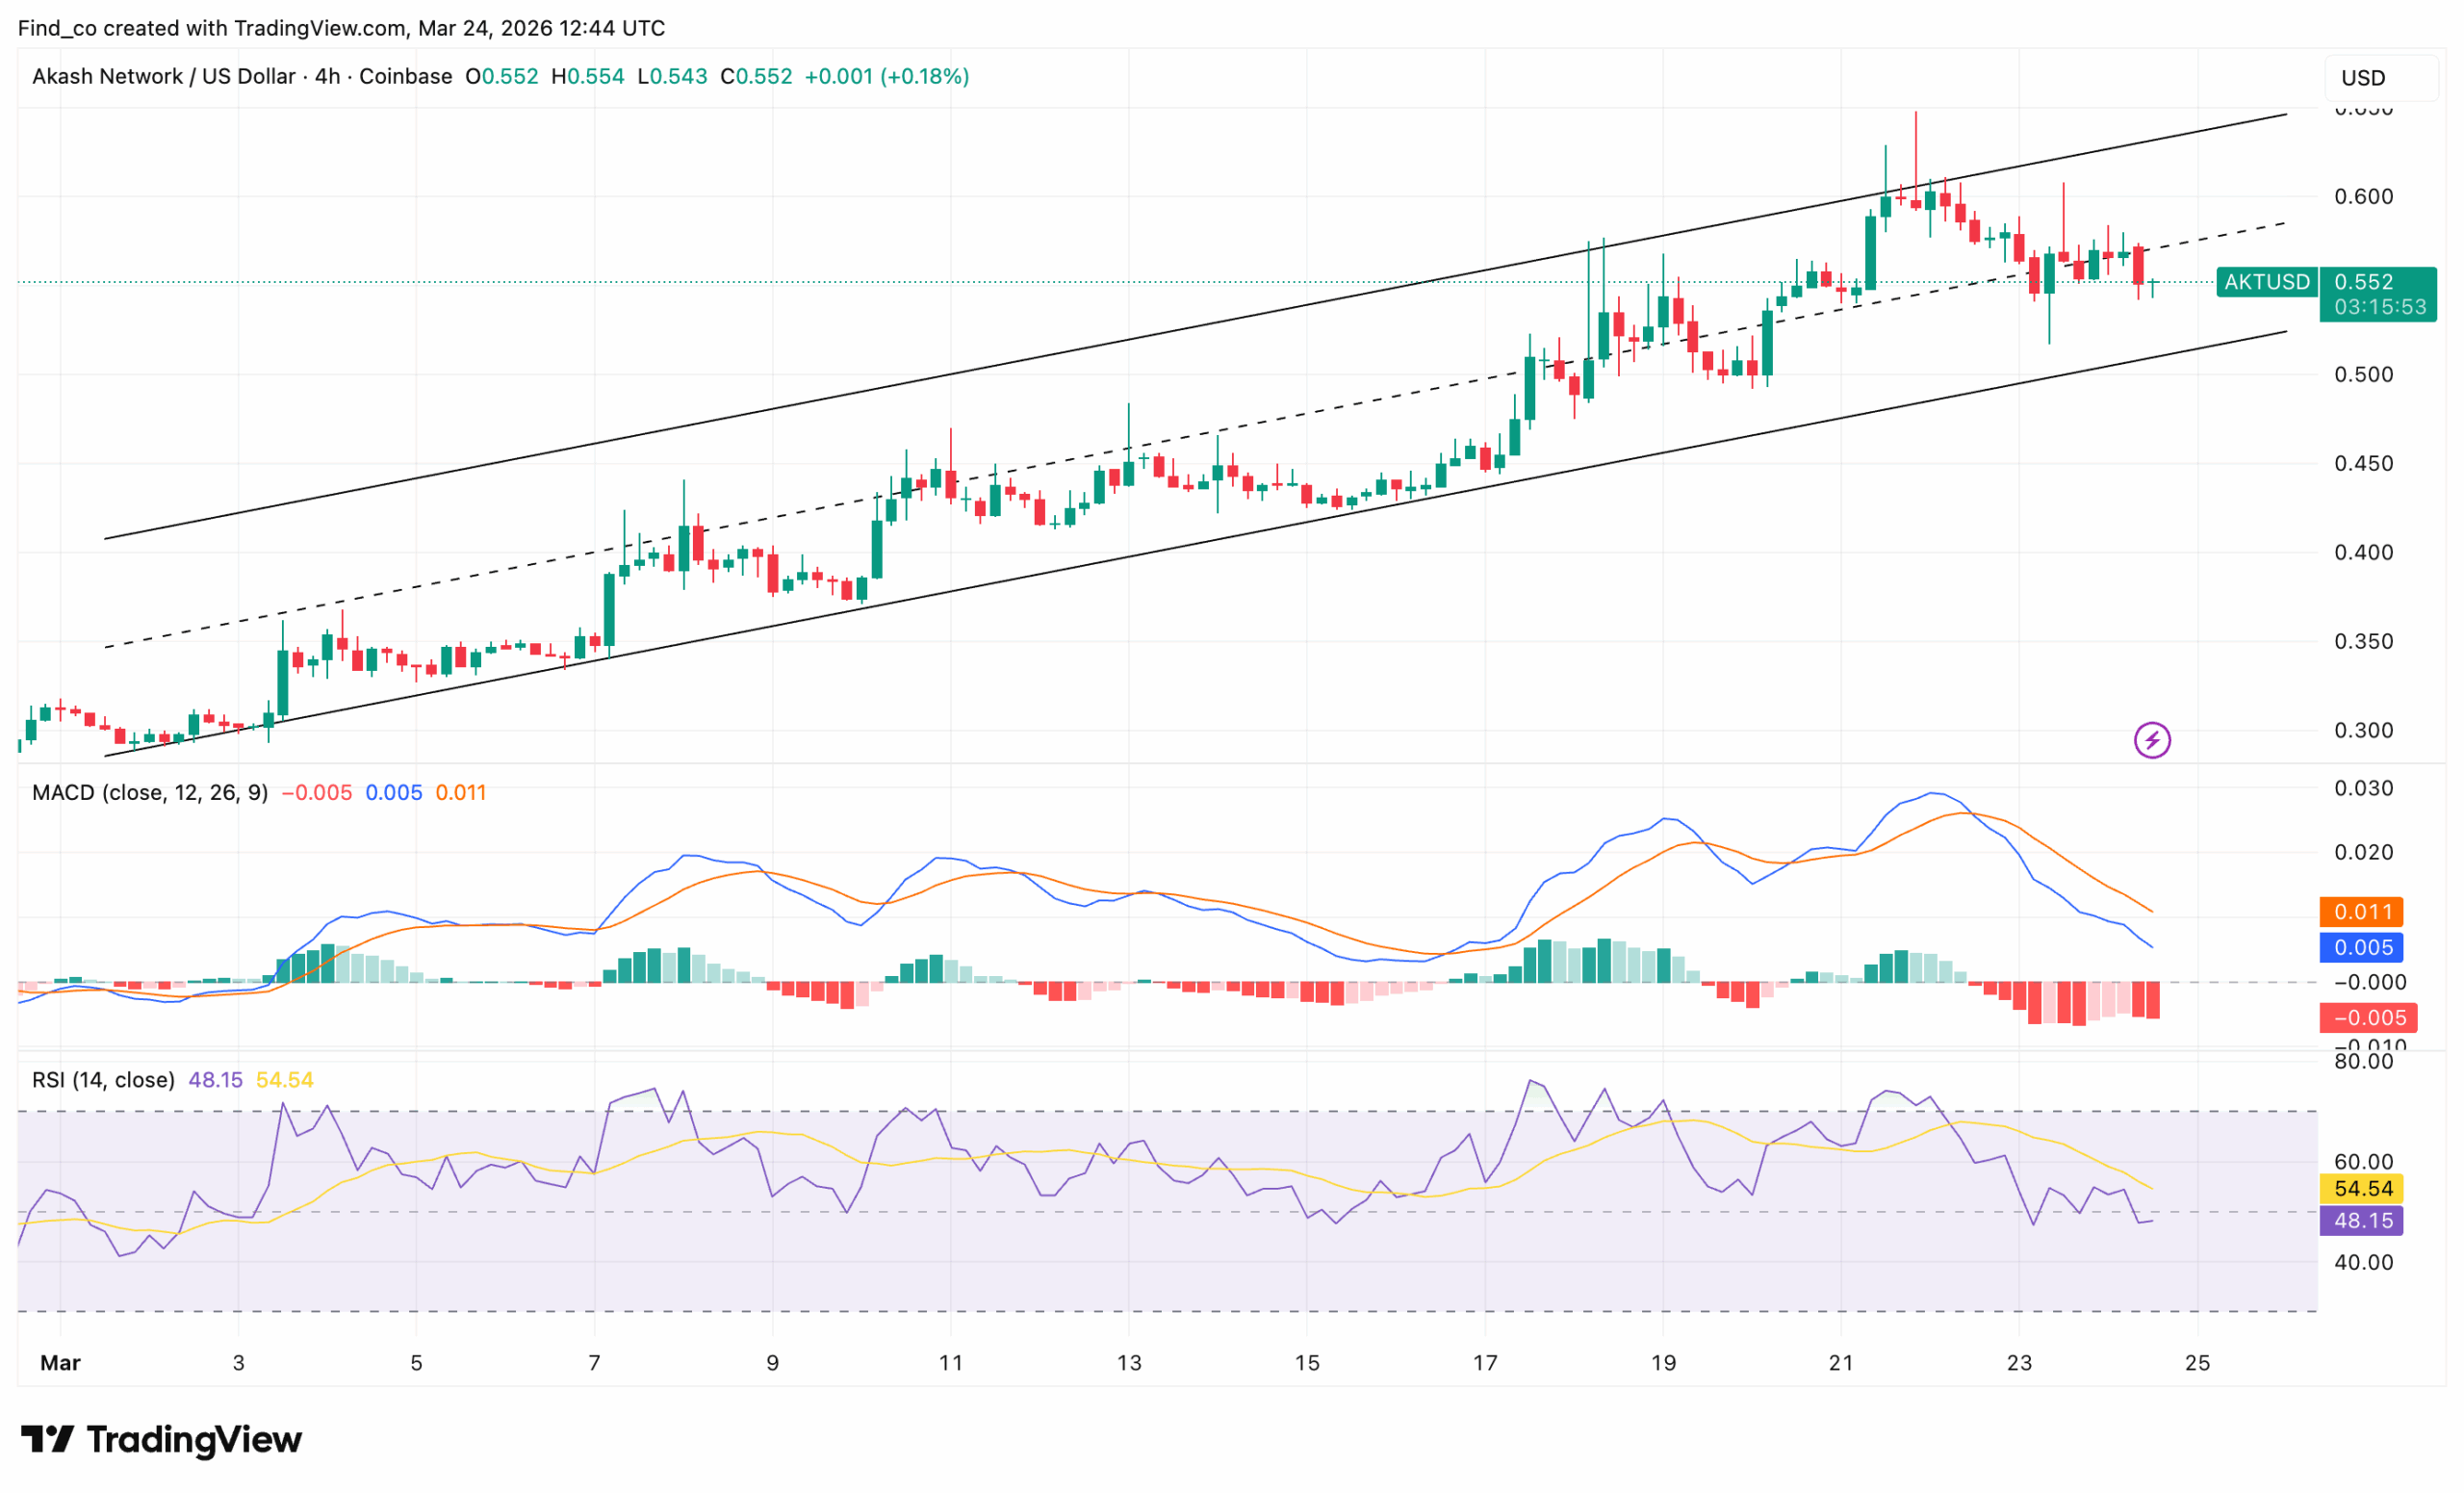
AKT’s price remains in a clear short-term uptrend, printing consistent higher highs and higher lows. However, price action has now shifted into a tight consolidation range between $0.55 and $0.58.
Meanwhile, repeated rejection near the $0.60 level highlights strong overhead supply. Buyers are still active, but upside continuation is no longer aggressive. In other words, the market is entering a decision phase.
Get These Top Crypto Casino Offers Now!
Sponsored
Disclosure
We sometimes use affiliate links in our content, when clicking on those we might receive a commission at no extra cost to you. By using this website you agree to our terms and conditions and privacy policy.
On the 4-hour chart, the Moving Average Convergence Divergence (MACD) has crossed downward, with the signal line now below the MACD line.
At the same time, histogram bars have flipped negative and continue expanding.
This indicates increasing bearish pressure in the short term. This shift follows a strong bullish impulse, suggesting a cooling-off period rather than an immediate trend reversal.
The Relative Strength Index (RSI) is hovering around the 52-56 region, reflecting a neutral stance. However, it is gradually trending downward, signaling fading buying strength.
The RSI indicator remains above the 50 midpoint, meaning bulls have not fully lost control.
Still, the lack of bullish divergence reduces the probability of an immediate breakout.
A break above $0.60 could trigger a continuation toward new local highs.
Scarcity to Boost Coin Value
The single biggest catalyst is the Burn-Mint Equilibrium (BME) upgrade, which went live yesterday, March 23, at 14:00 UTC, and fundamentally reshapes AKT’s economy.
At its core, BME introduces a “Token Sink” mechanic. Now, every time a user purchases cloud compute on the network, a portion of the AKT coin is permanently burned.
That connection matters. By tying scarcity to adoption, BME turns AKT into a deflationary asset, shifting Akash’s perception from a speculative token to a revenue-driven utility play.
While the 30-day rally predates this upgrade, the new Burn-Mint Equilibrium reinforces AKT’s utility and could sustain demand going forward.
“Every compute transaction on Akash will now burn $AKT. Burn-Mint Equilibrium makes $AKT essential to every deployment while maintaining USD pricing and pegged payments for tenants and providers,” the team noted.
Meanwhile, the upgrade also rolled out support for WebAssembly (WASM). Developers can now build programmable dApps directly on the decentralized cloud, broadening the network’s appeal beyond just compute buyers.
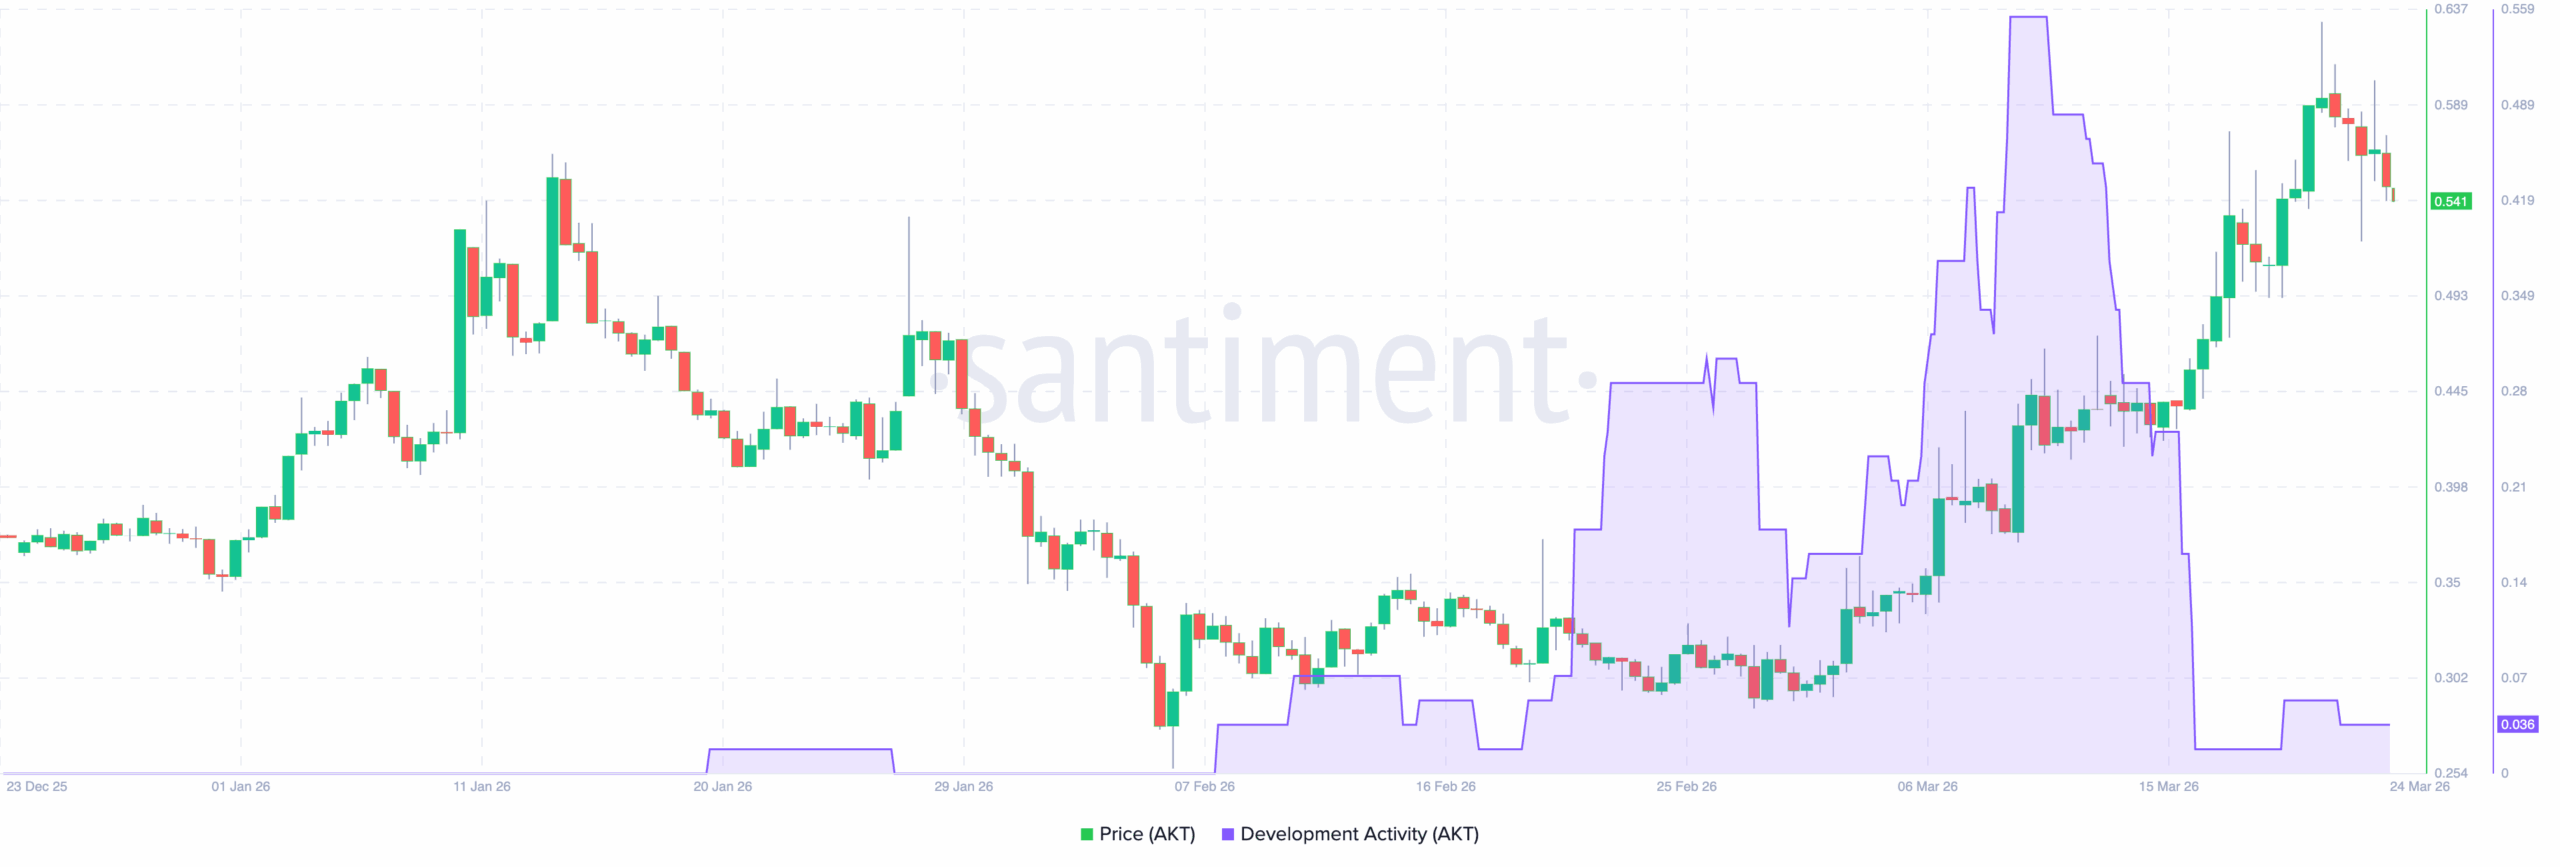
Following the activation, the Santiment chart shows AKT’s price overlaid on development activity.
The sequence of events is striking. AKT spent January and early February grinding lower, falling from highs near $0.54 down to a painful trough around $0.30 by early February.
During that same period, development activity was minimal. Then, around Feb. 25, something changed.
Development activity exploded, surging to its highest reading on the entire chart and sustaining elevated levels through early March.
The team was clearly building at an accelerated pace. Importantly, price followed. AKT launched from $0.35 and rallied aggressively, peaking near $0.64 by mid-March — a gain of roughly 82% from the February lows.
That correlation between sustained dev activity and price appreciation is exactly the on-chain signal long-term investors hunt for.
Now, however, both metrics are retreating simultaneously. Development activity has dropped back to near-zero levels while the AKT coin price has pulled back accordingly to $0.54.
As a result, the altcoin might consolidate for a while before another breakout.
AKT Price Forecast: Upswing Not Over
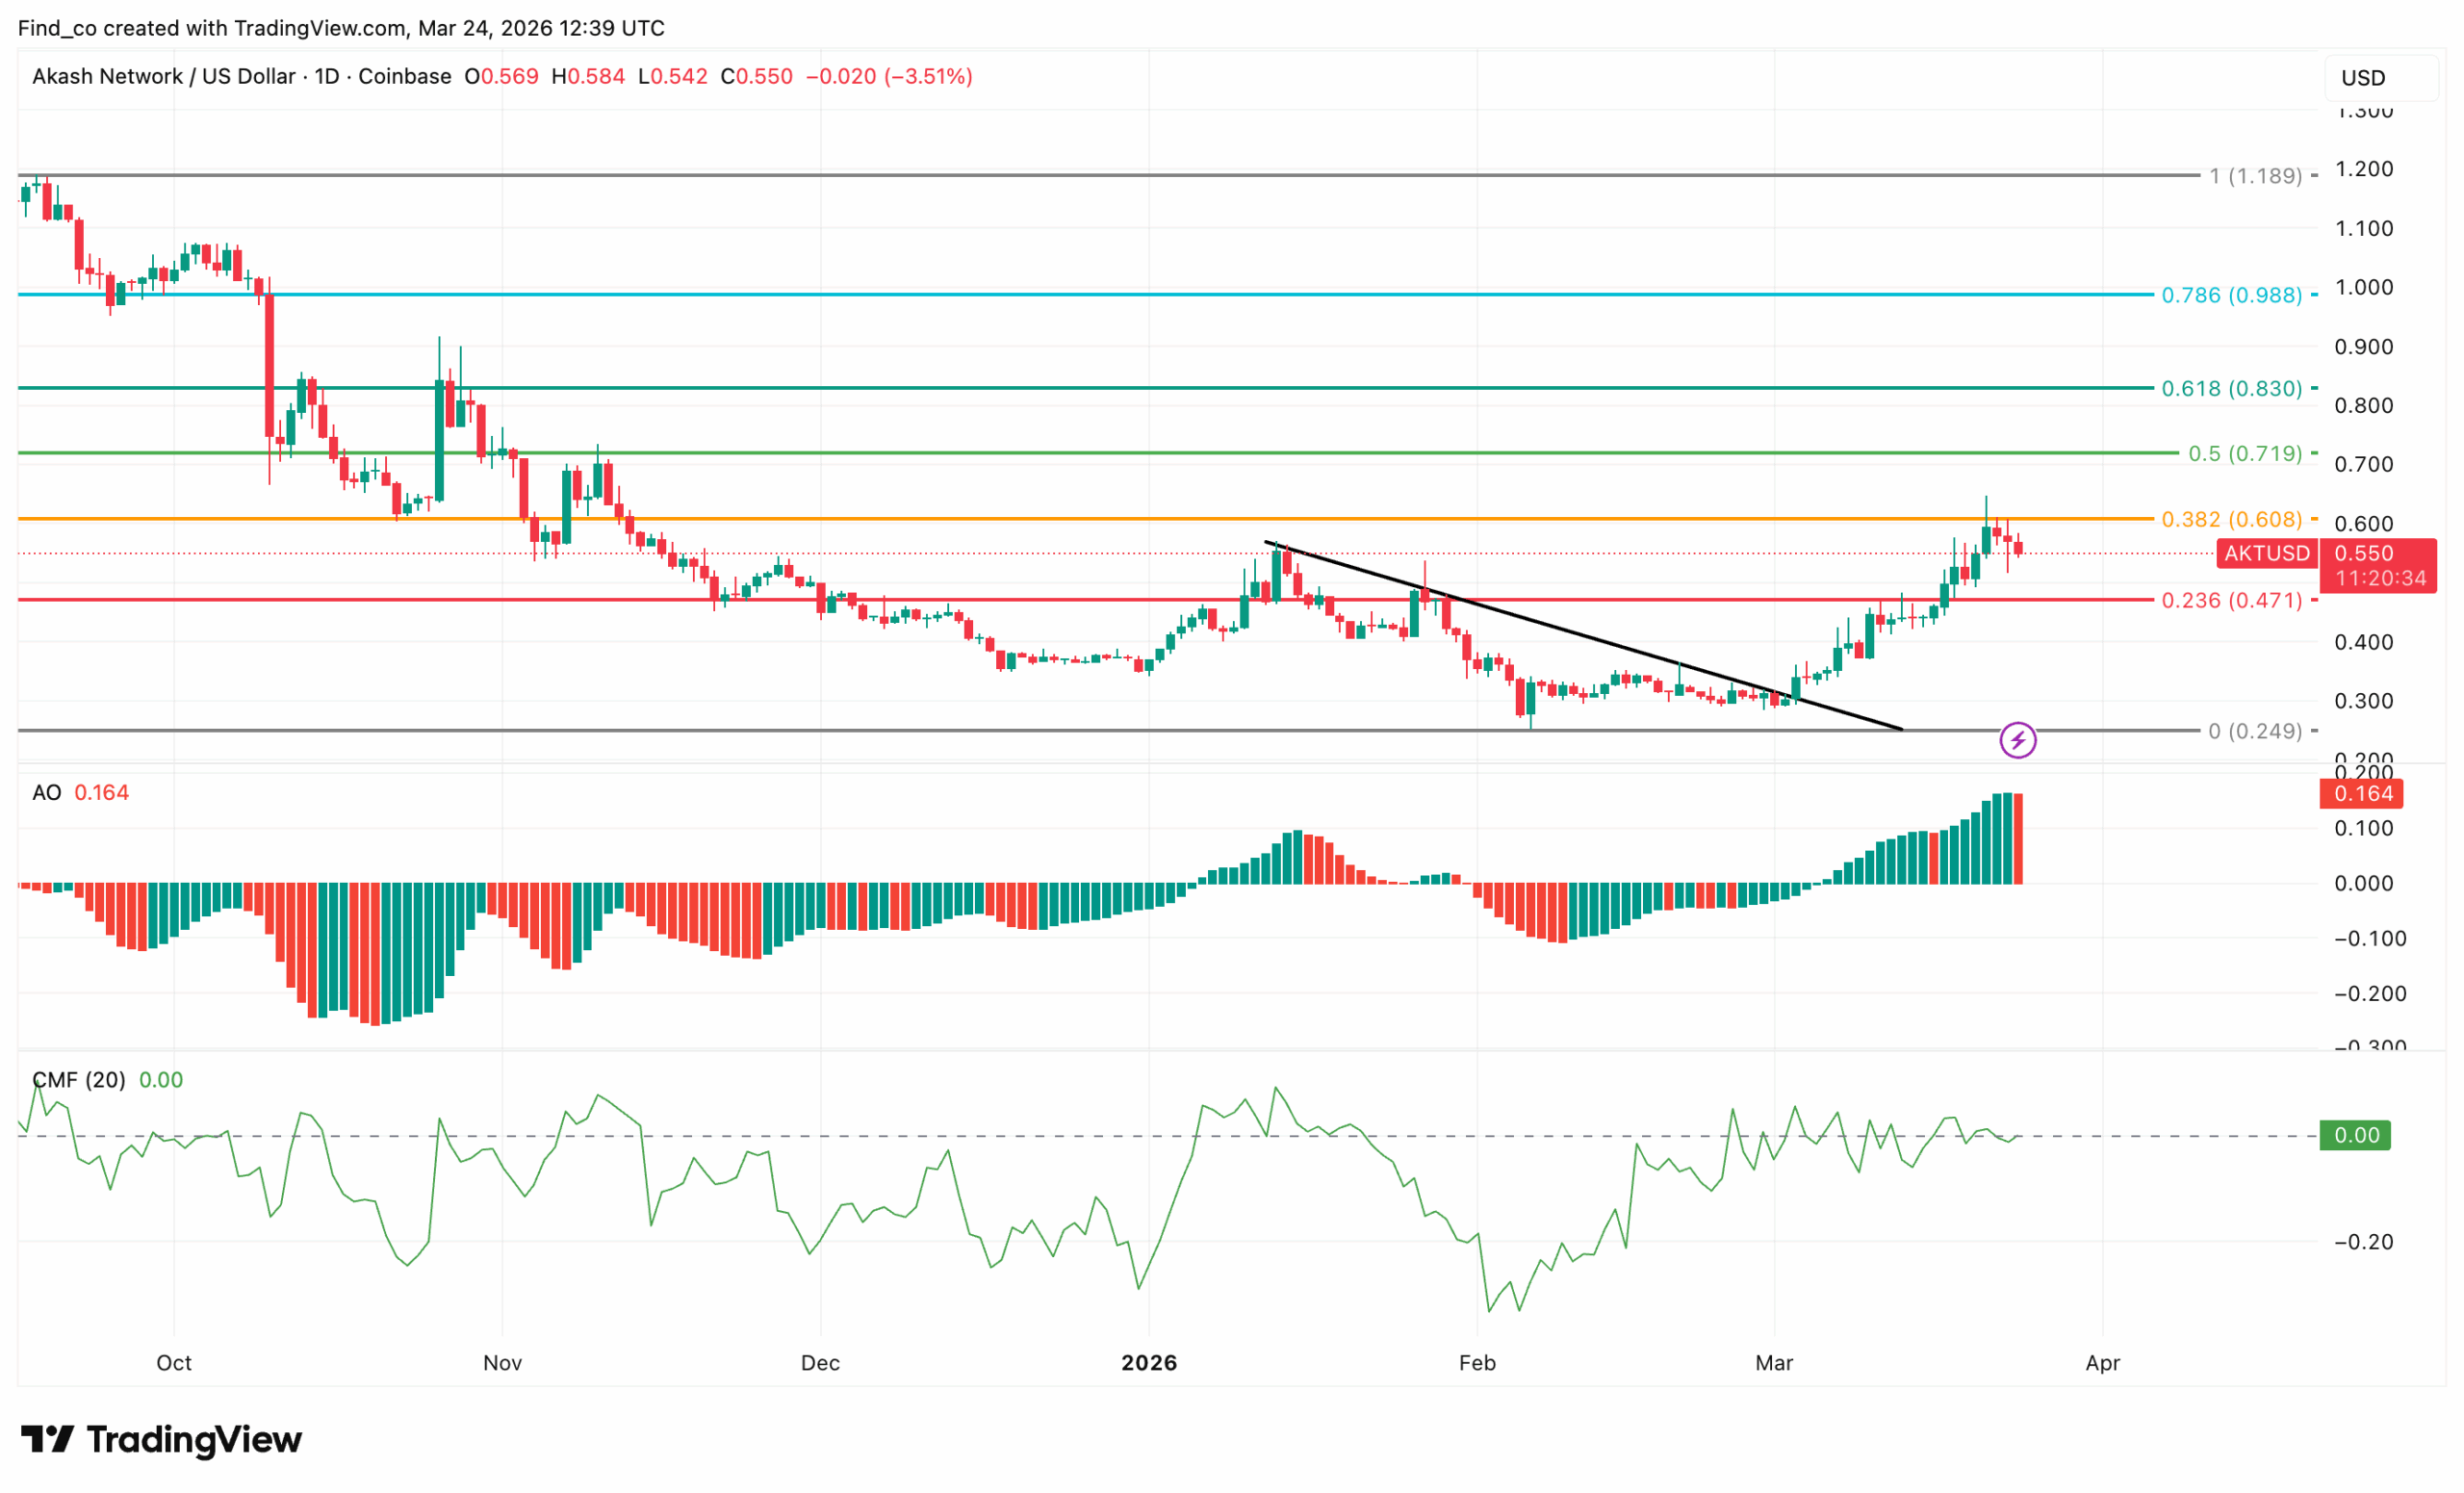
On the daily chart, the AKT coin is showing signs of a short-term recovery after a prolonged downtrend.
Price has pushed past $0.55, testing the 0.382 Fibonacci level near $0.63, a key resistance area that previously capped upward momentum.
The structure demonstrates a steady climb, with higher highs and higher lows forming over recent sessions.
Momentum indicators support the rally. The Awesome Oscillator (AO), having printed multiple green histogram bars in the positive territory, has now released a single red bar signaling that the bullish momentum is slowing.
Chaikin Money Flow (CMF) hovers near zero, suggesting accumulation is steady rather than overheated.
While the move remains below stronger resistance zones at $0.75 (0.5 Fib) and $0.87 (0.618 Fib), the current uptrend shows resilience.
Disclaimer:
The information provided in this article is for informational purposes only. It is not intended to be, nor should it be construed as, financial advice. We do not make any warranties regarding the completeness, reliability, or accuracy of this information. All investments involve risk, and past performance does not guarantee future results. We recommend consulting a financial advisor before making any investment decisions.
Victor Olanrewaju is a crypto analyst and reporter at CCN with deep roots in on-chain research and technical analysis. His crypto journey began in 2017, but it was the 2020 Uniswap airdrop that sparked a full-time pivot into the space.
With a foundation in copywriting, Victor honed his craft creating high-converting content for leading crypto brokers — most notably an XRP price prediction that ranked #1 on Google during the 2021 bull run.
He later joined AMBCrypto in 2022, where he combined storytelling with technical and on-chain analysis to cover key market narratives.
In 2024, he expanded his expertise at BeInCrypto, collaborating with analysts and using tools like Glassnode, Santiment, and IntoTheBlock to break down Bitcoin and altcoin trends.
At CCN, Victor covers the top cryptocurrencies, memecoins, macro shifts, blending real-time insights with deep-dive metrics.
He holds a Bachelor’s degree in Physics from the University of Ibadan, equipping him to simplify complex data for a wide audience. Follow his work or connect on LinkedIn or X.