Claude responded: Aave's TVL is down 45%, users halved, and AAVE eyes $70 a month after the $292M KelpDAO hack.Aave's TVL is down 45%, users halved, and AAVE eyes $70 a month after the $292M KelpDAO hack. Credit: CCN
Share
Key Takeaways
Aave’s total value locked has plummeted 45% from $26.4 billion to $14.56 billion in the 30 days since the April 18 KelpDAO exploit, with total supplied and total borrowed both hitting their lowest levels in over a year.
Weekly active users have collapsed by 56% from a post-exploit peak of 53,000 to just 23,400, while Aave’s weekly fees and revenue have tumbled by 66% and 62%, respectively, as utilization and borrow demand evaporate.
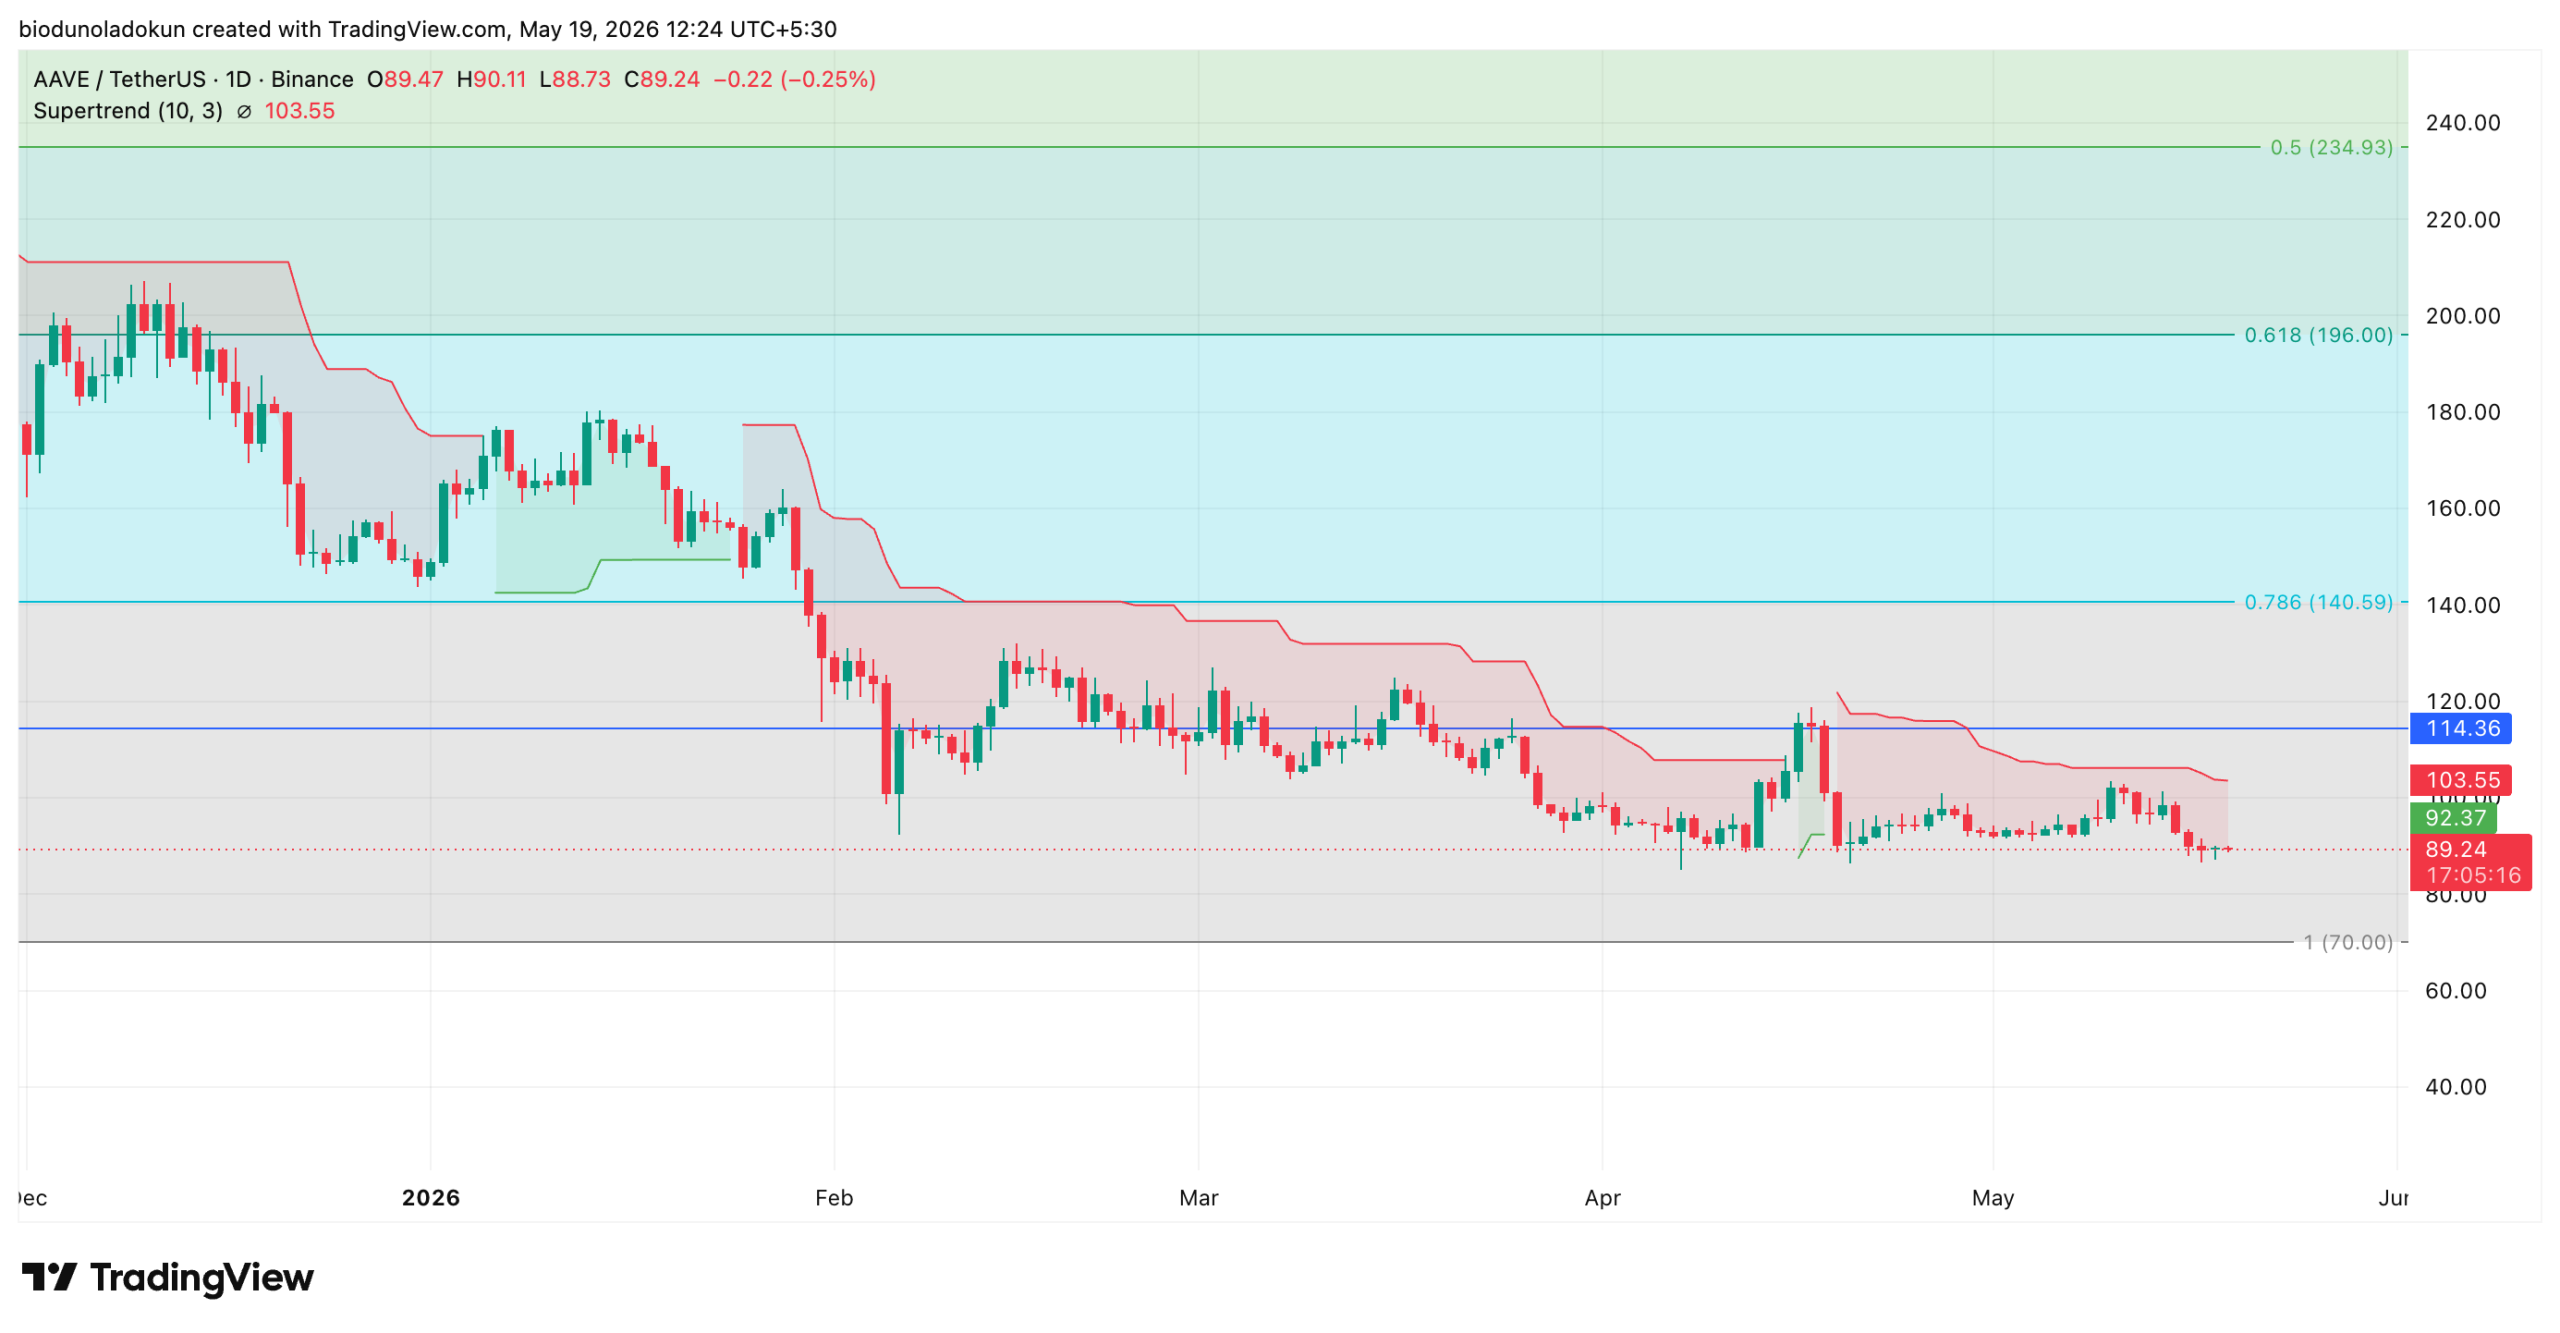
AAVE trades at $89.17 with the daily SuperTrend resistance at $103.55, capping every recovery attempt; a breakdown below $89 support exposes the token to the $70 region.
On April 18, Aave, the largest decentralized lending protocol in crypto, suffered what has become the largest DeFi exploit of 2026 so far.
Attackers, later attributed to North Korea’s Lazarus Group, drained roughly 116,500 rsETH worth approximately $292 million from KelpDAO’s LayerZero-powered bridge.
The attackers then deposited the unbacked liquid restaking tokens as collateral on Aave V3 and borrowed wrapped ether (WETH) against them, leaving a significant amount in bad debt on the lender.
A month later, even after a sweeping cross-protocol bailout has clawed back some of the stolen funds, Aave is still struggling as lost liquidity has not yet returned, borrowing demand has thinned, and active users have dipped.
Aave’s Supply and Borrow Books Hit Their Lowest Levels in Over a Year
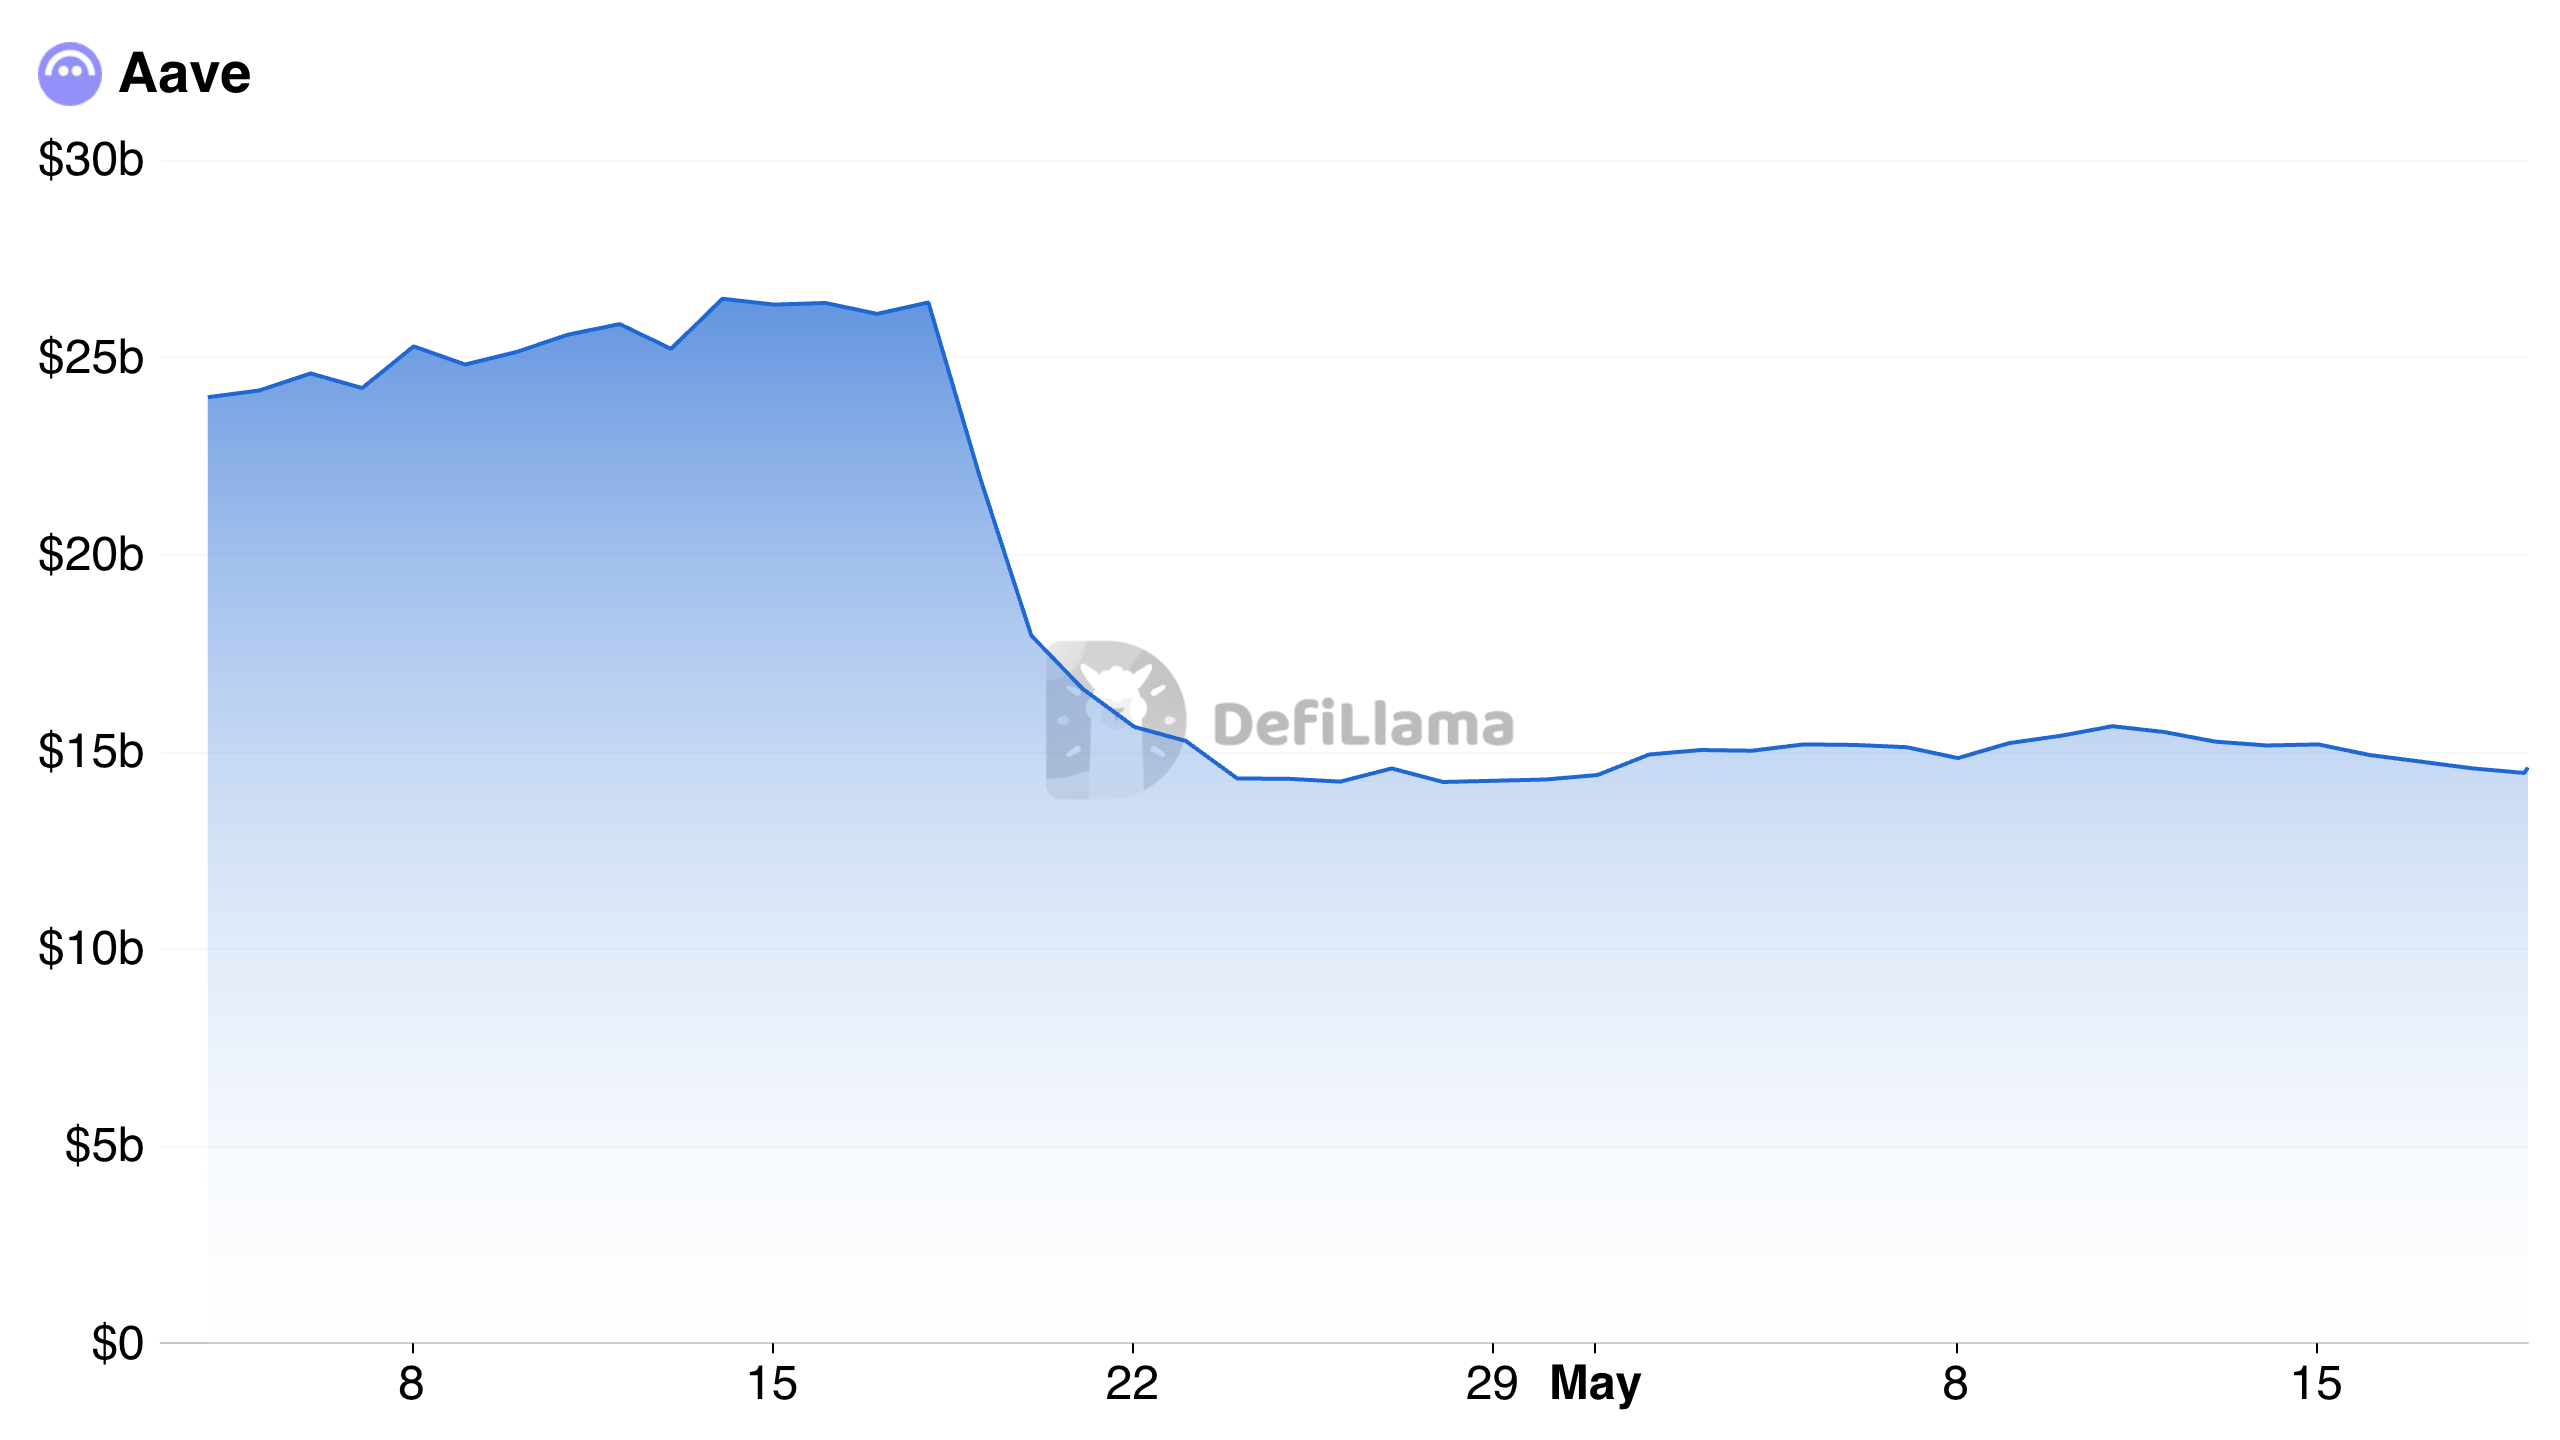
According to DefiLlama, Aave’s total value locked (TVL) has plummeted from $26.4 billion on April 18 to $14.56 billion at press time, marking a 45% dip in 30 days.
The lender’s TVL tracks the difference between assets supplied and borrowed, both of which have plunged to their lowest levels in over a year.
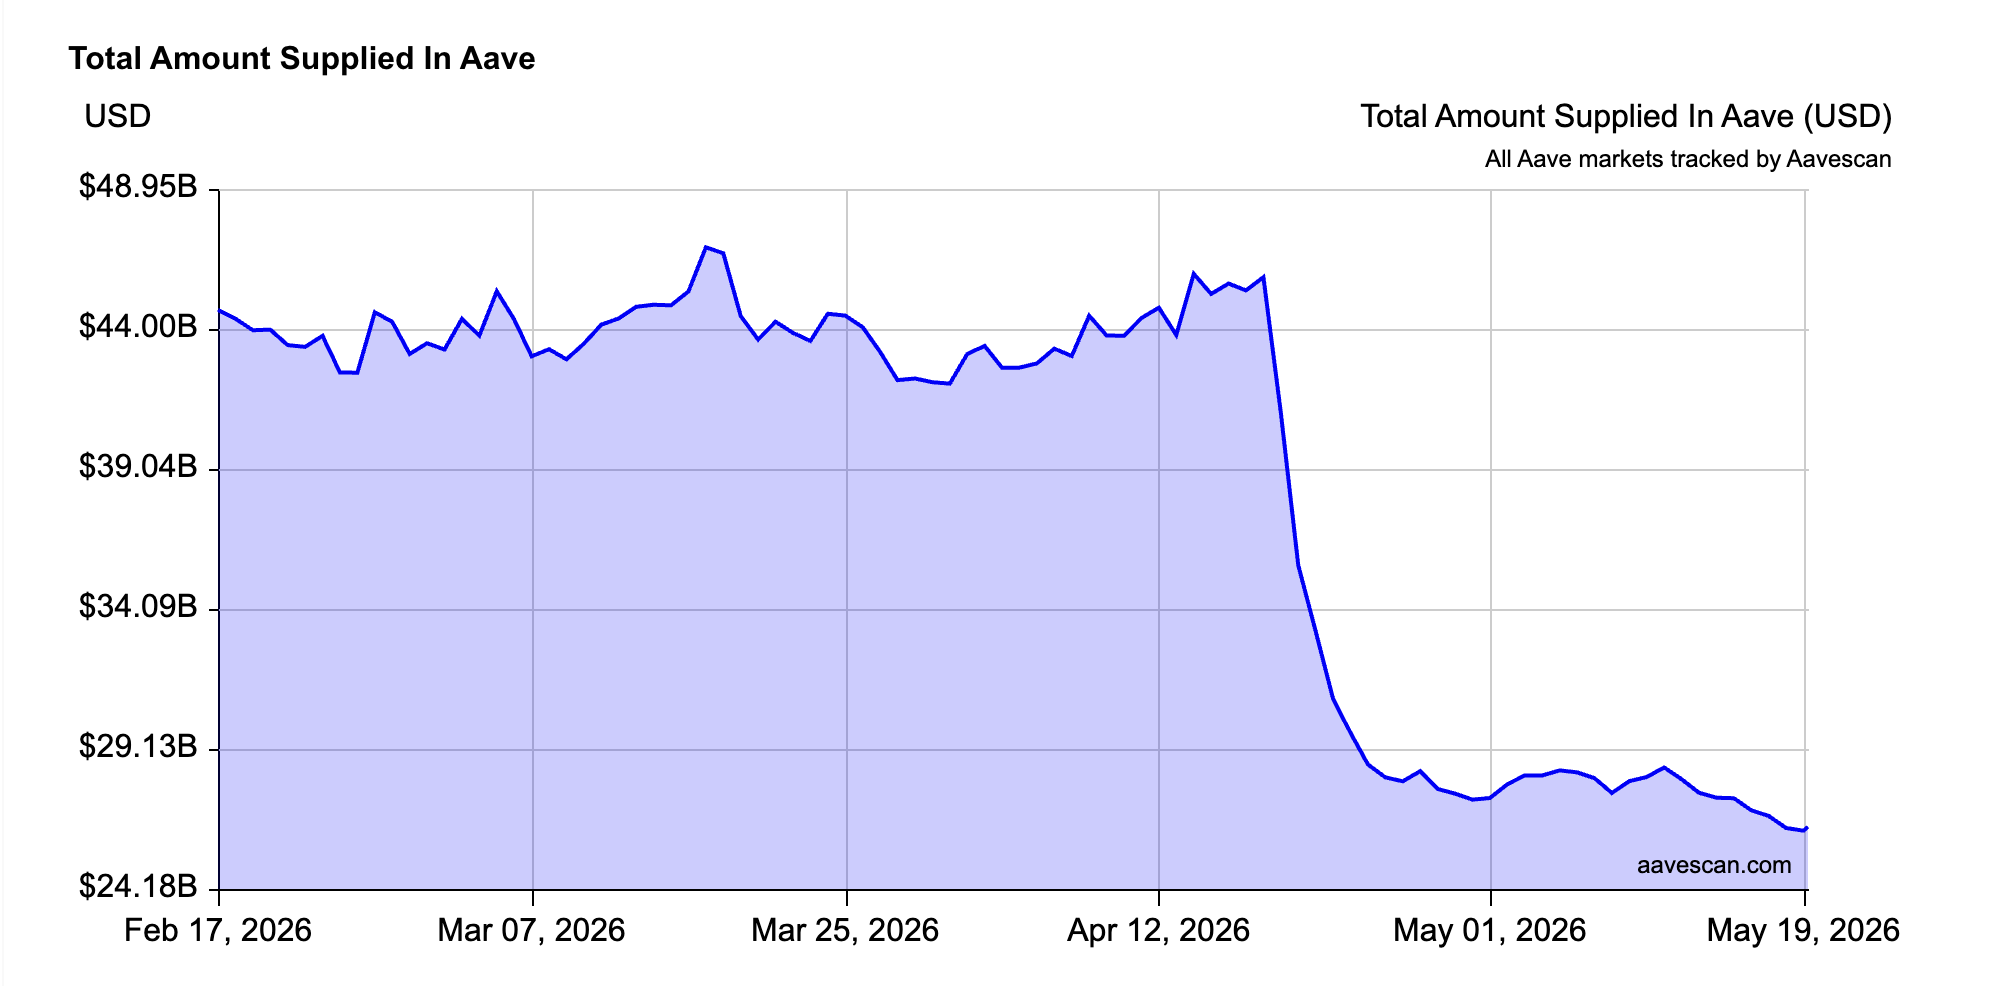
AaveScan data shows the total amount supplied across all Aave markets has dropped 35.7%, from $41.03 billion on April 18 to $26.37 billion at press time.
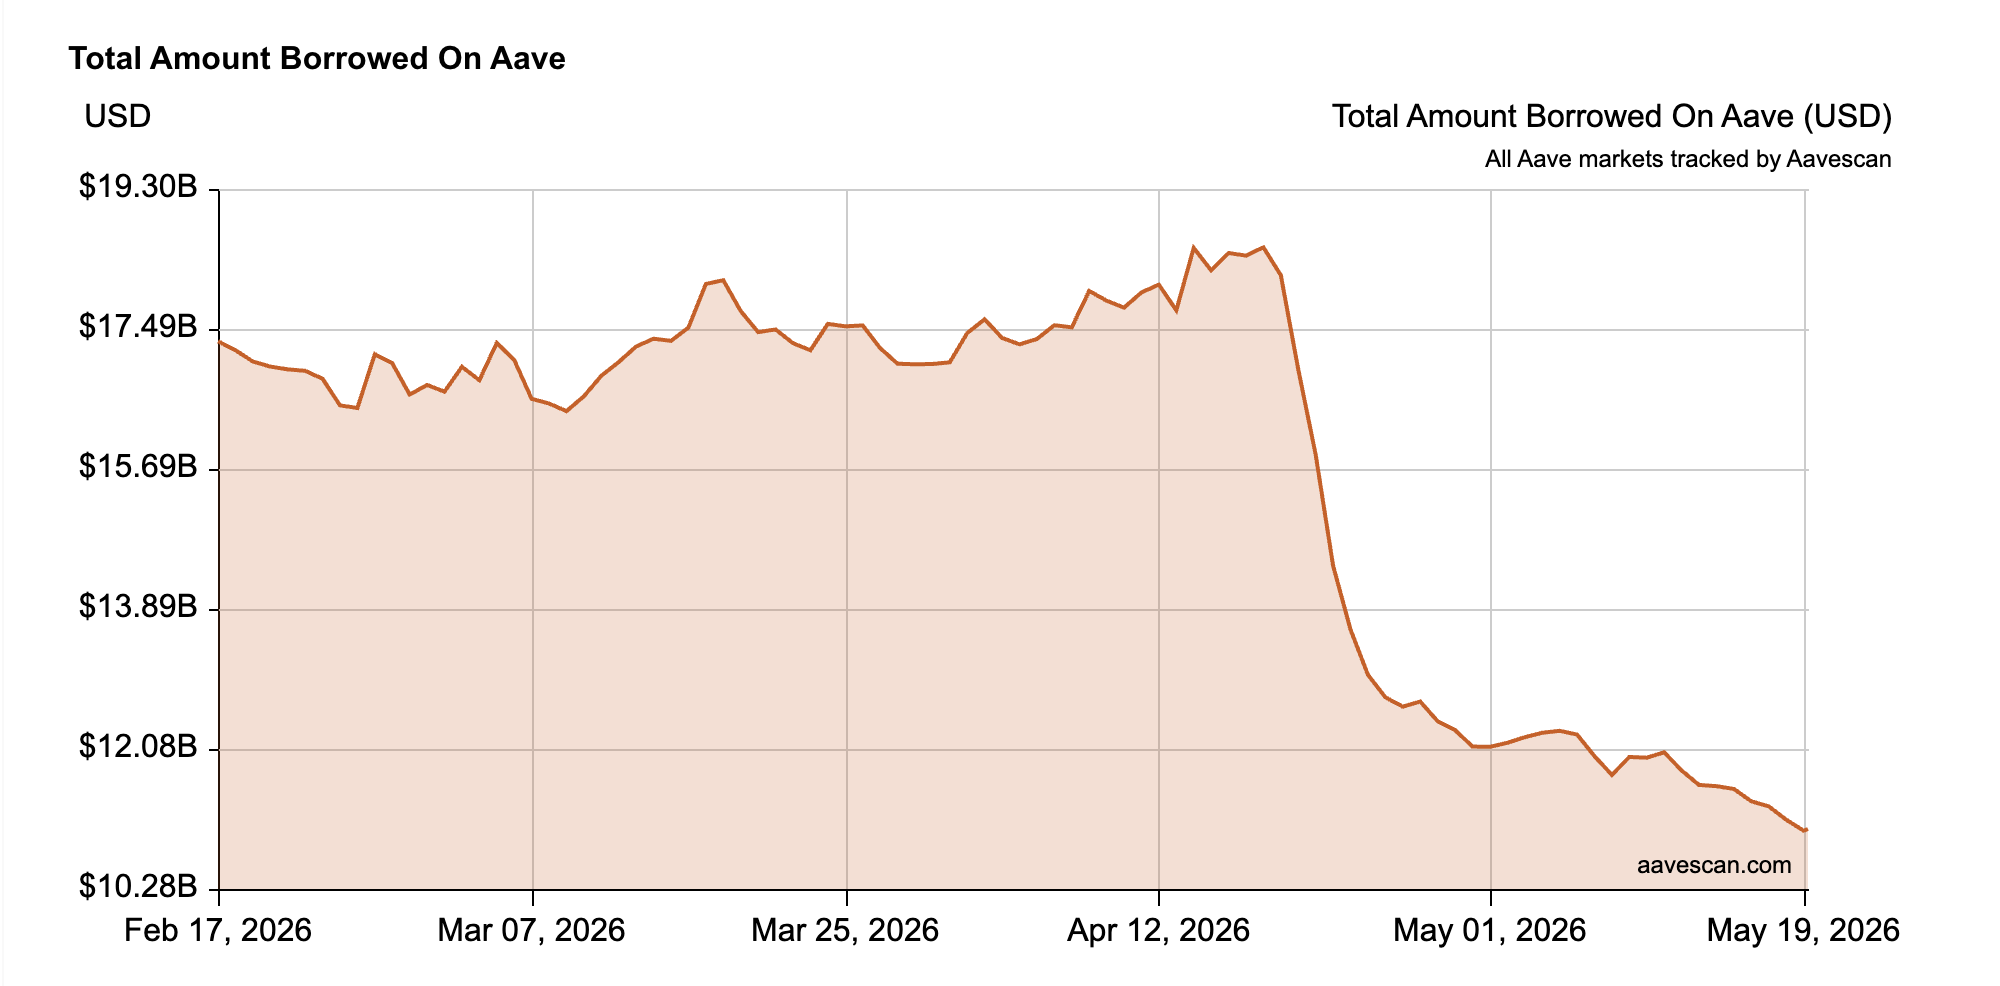
The fact that borrowers are falling faster than supply is particularly significant. It means the lender’s utilization has dropped as borrowers who repaid loans have not been replaced, and new leverage is not coming online to fill the gap.
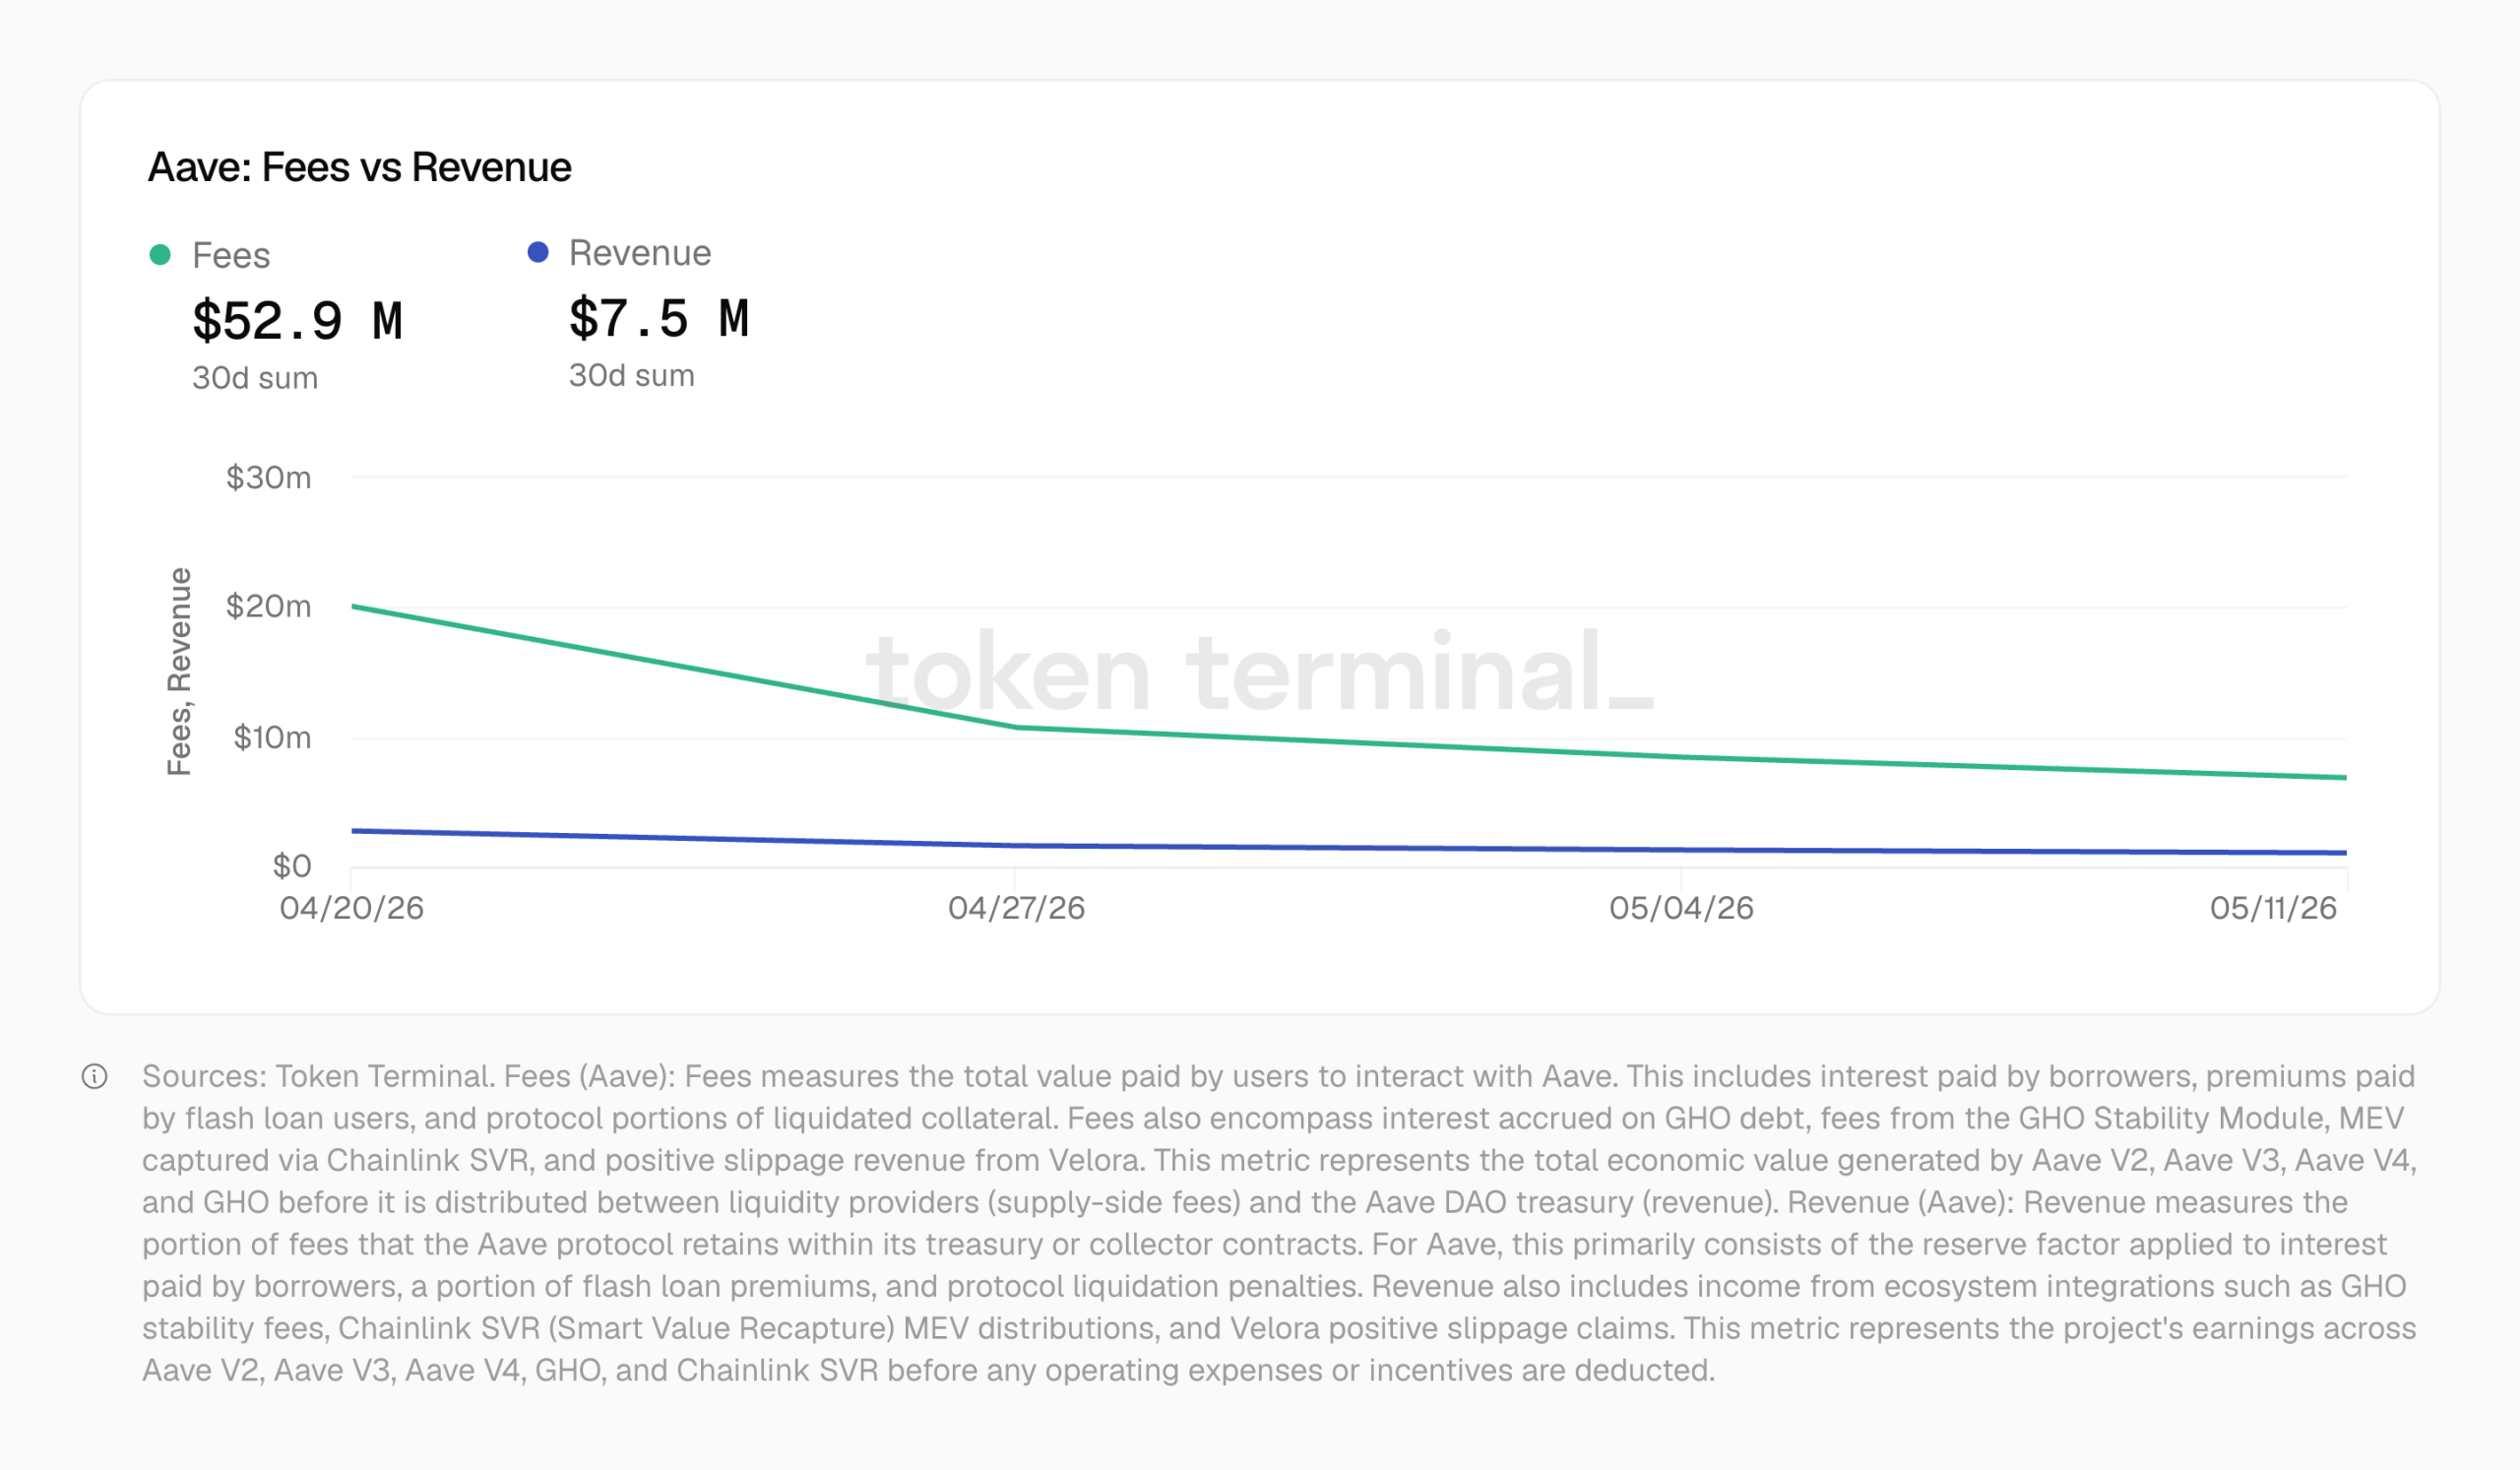
Notably, Aave’s revenue is partly directly a function of borrowing interest. So, with outstanding borrows down nearly 40% and utilization compressed, the protocol’s fee generation and resulting revenue have collapsed since the exploit.
Per Token Terminal data, Aave’s weekly fees have tumbled by 66% since April 18, with weekly revenue down 62% during the same period.
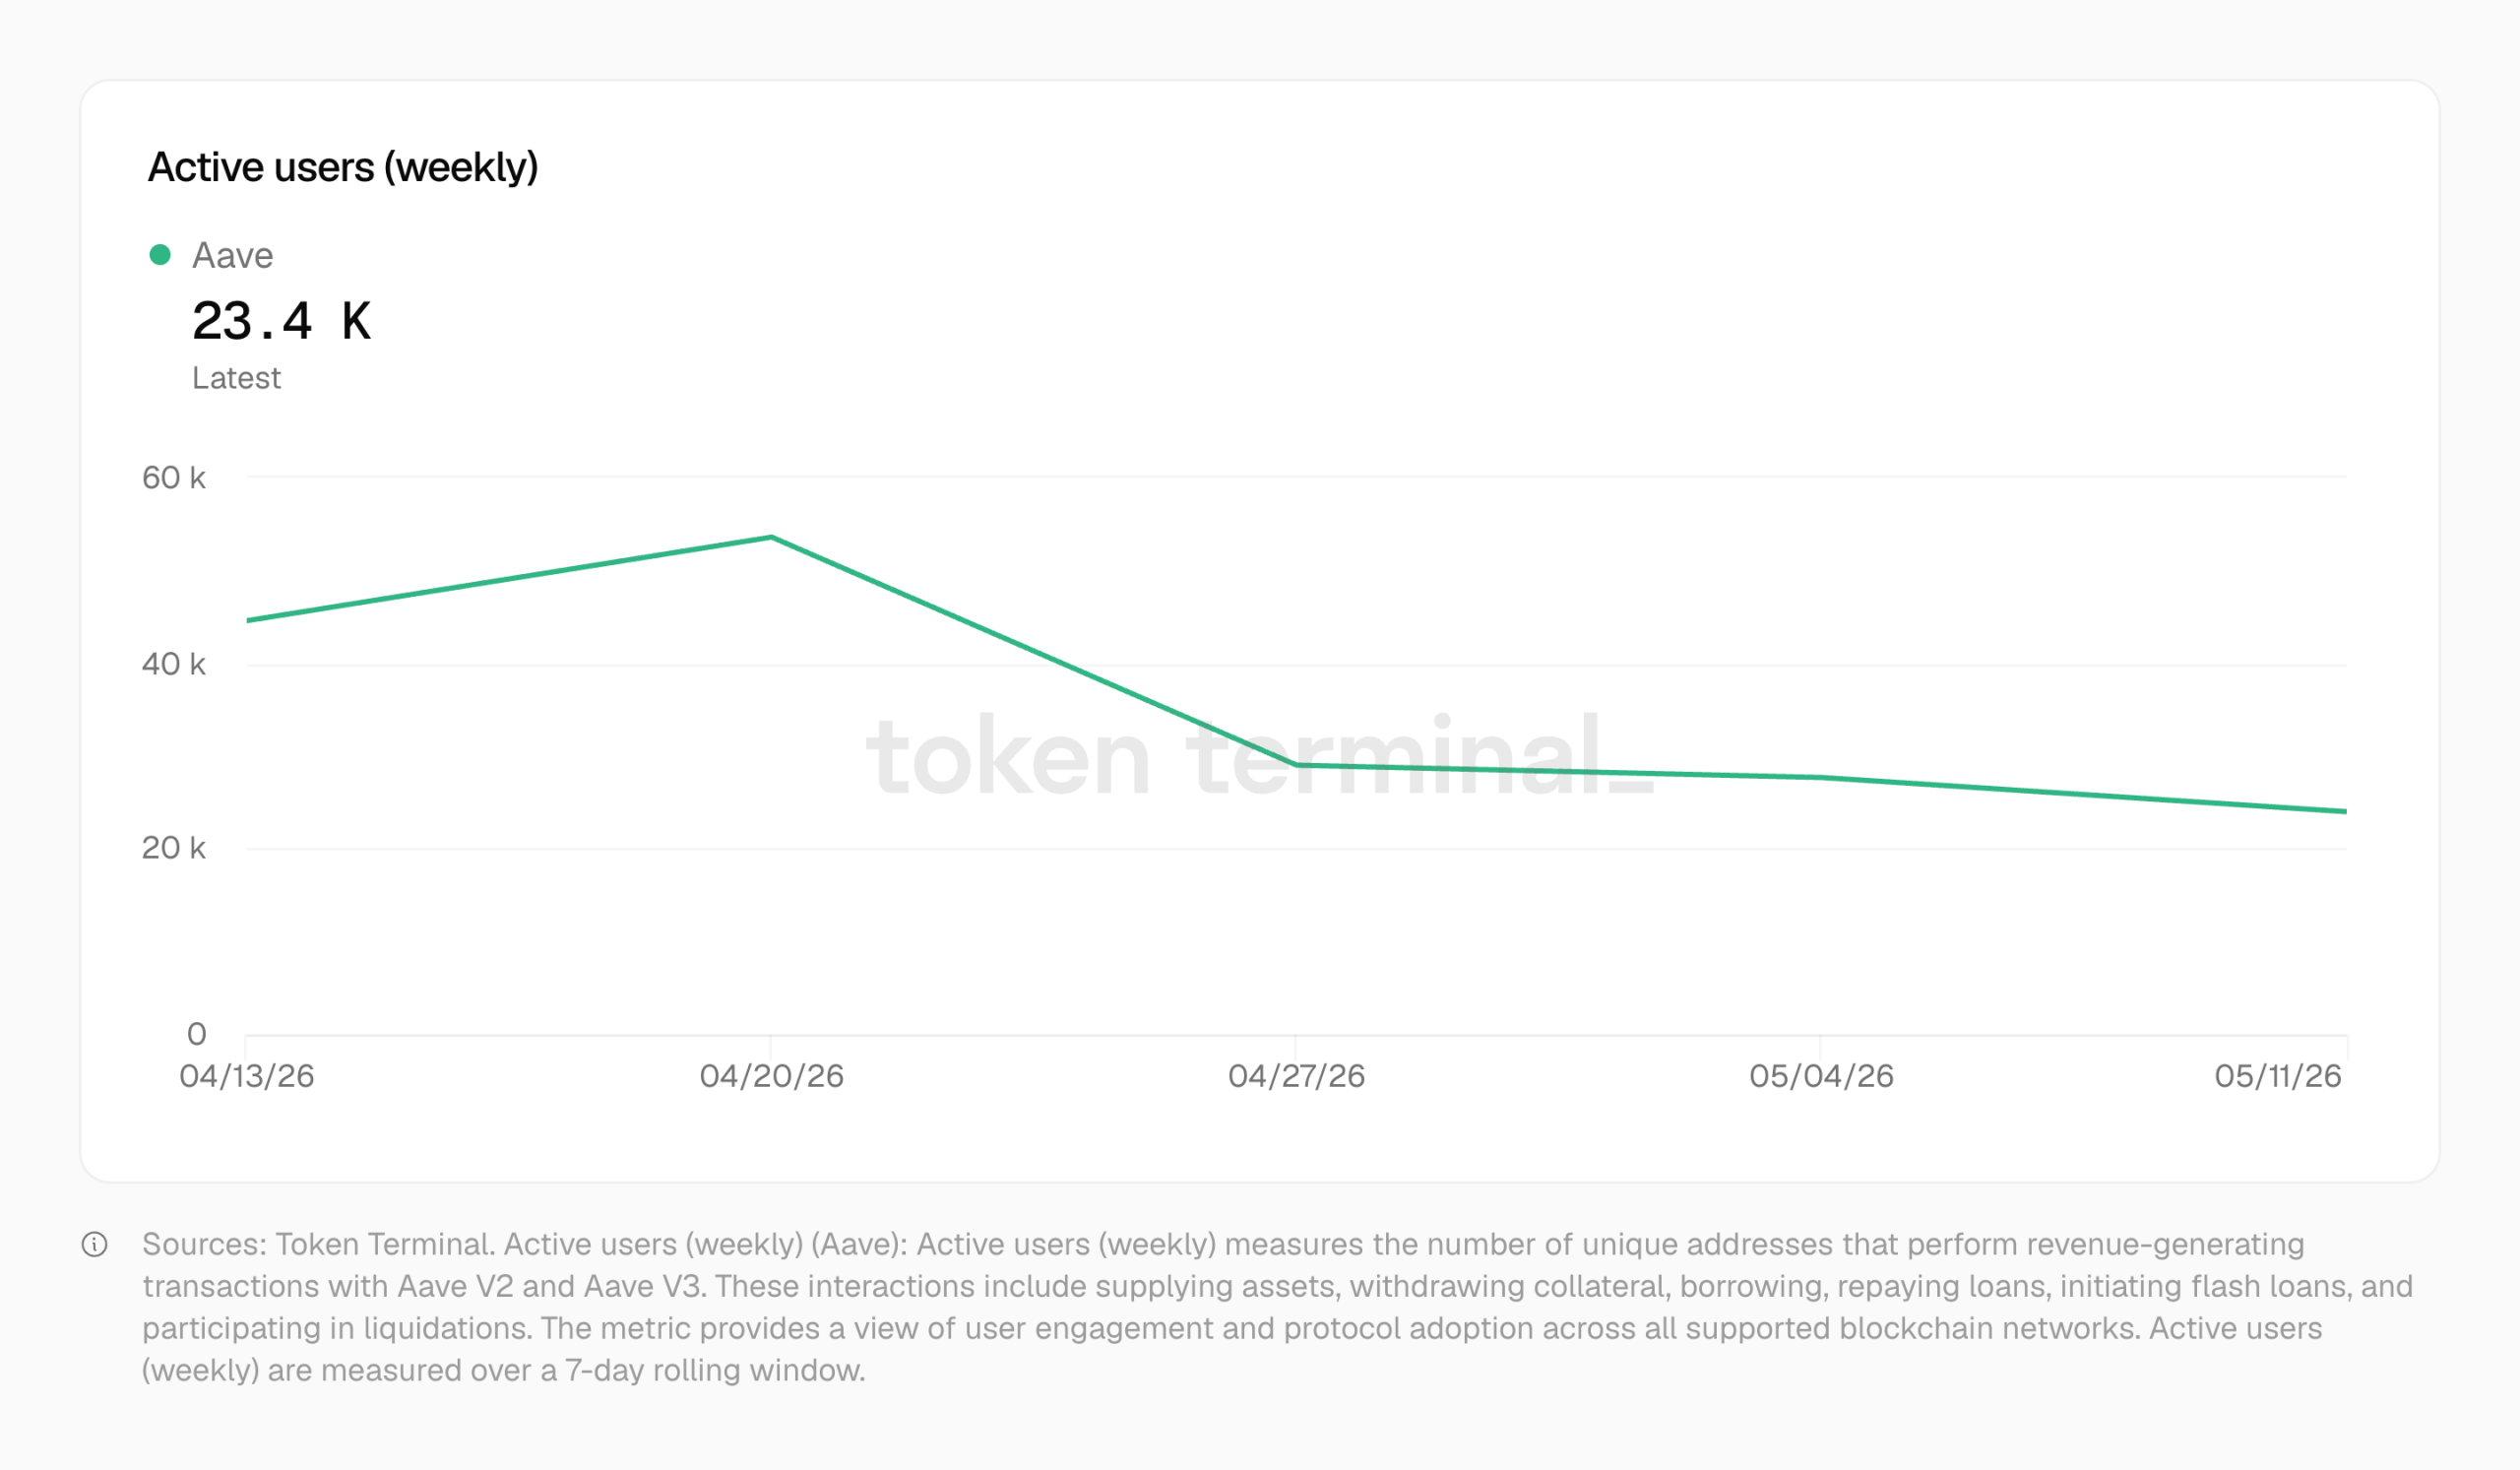
Active address counts have followed deposits out of Aave since the exploit, according to Token Terminal data.
Weekly active users peaked at 53,000 in the week of April 20, the panic window immediately after the exploit, as users rushed to withdraw collateral and unwind leveraged positions.
That figure has since collapsed to 23,400 at press time, a 56% drop in four weeks, and marks Aave’s lowest weekly active user count since January 2024.
For context, the user count spiked to 53,000 by April 20, showing a significant surge in users who pulled deposits, repaid defensive loans, and closed looping positions two days after the hack.
Once that cleared, the line has trended steadily downward, signaling that users are not returning to the protocol in any meaningful capacity.
Sell-Side Pressure Mounts on AAVE
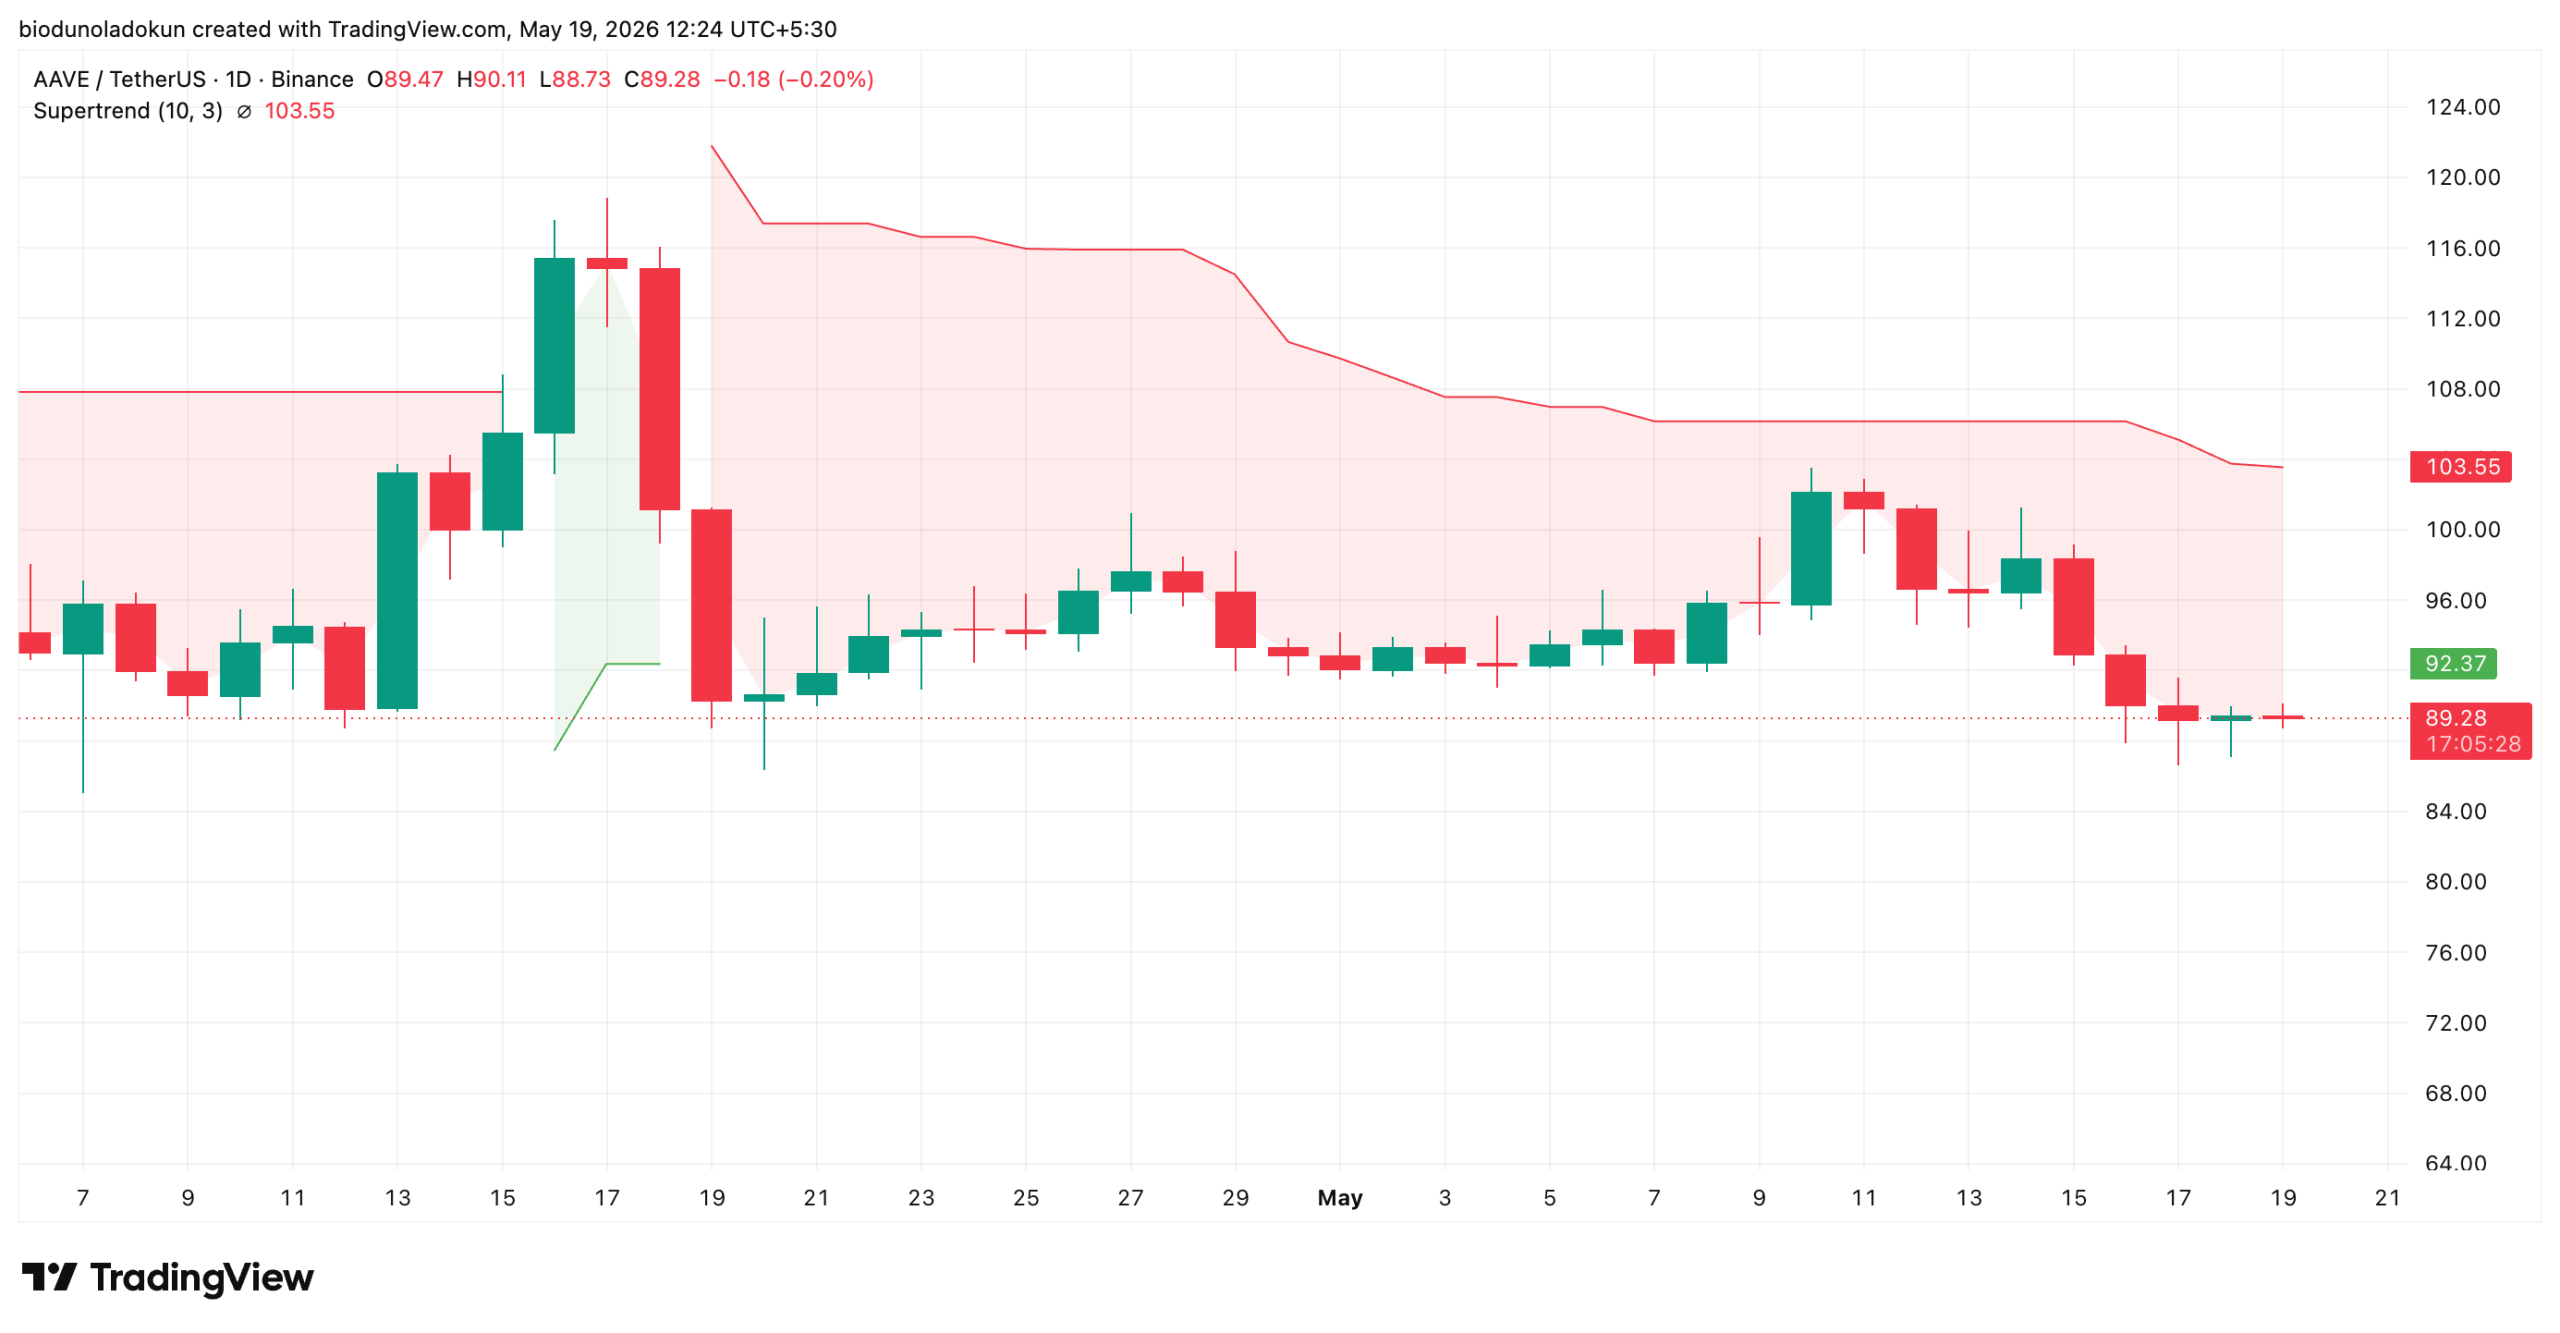
At press time, AAVE trades at $89.28, plunging 12% since April 18. On the daily chart, the altcoin has since traded below its SuperTrend indicator, confirming the dominant sell-side pressure.
At press time, the indicator’s red line forms a dynamic resistance above AAVE’s price at $103.55.
This momentum indicator helps traders identify the market’s direction by placing a line above or below the price chart, depending on the asset’s volatility.
When an asset’s price trades above the green line of the Super Trend indicator, it signals a bullish trend, indicating that the market is in an uptrend and that buying pressure is dominant.
Conversely, as with AAVE, when the price trades below the red line of the SuperTrend, it confirms a bearish trend, signaling that sellers are in control and downside pressure dominates. This means the $103.55 line will continue to cap every recovery attempt until AAVE’s price can decisively close above it.
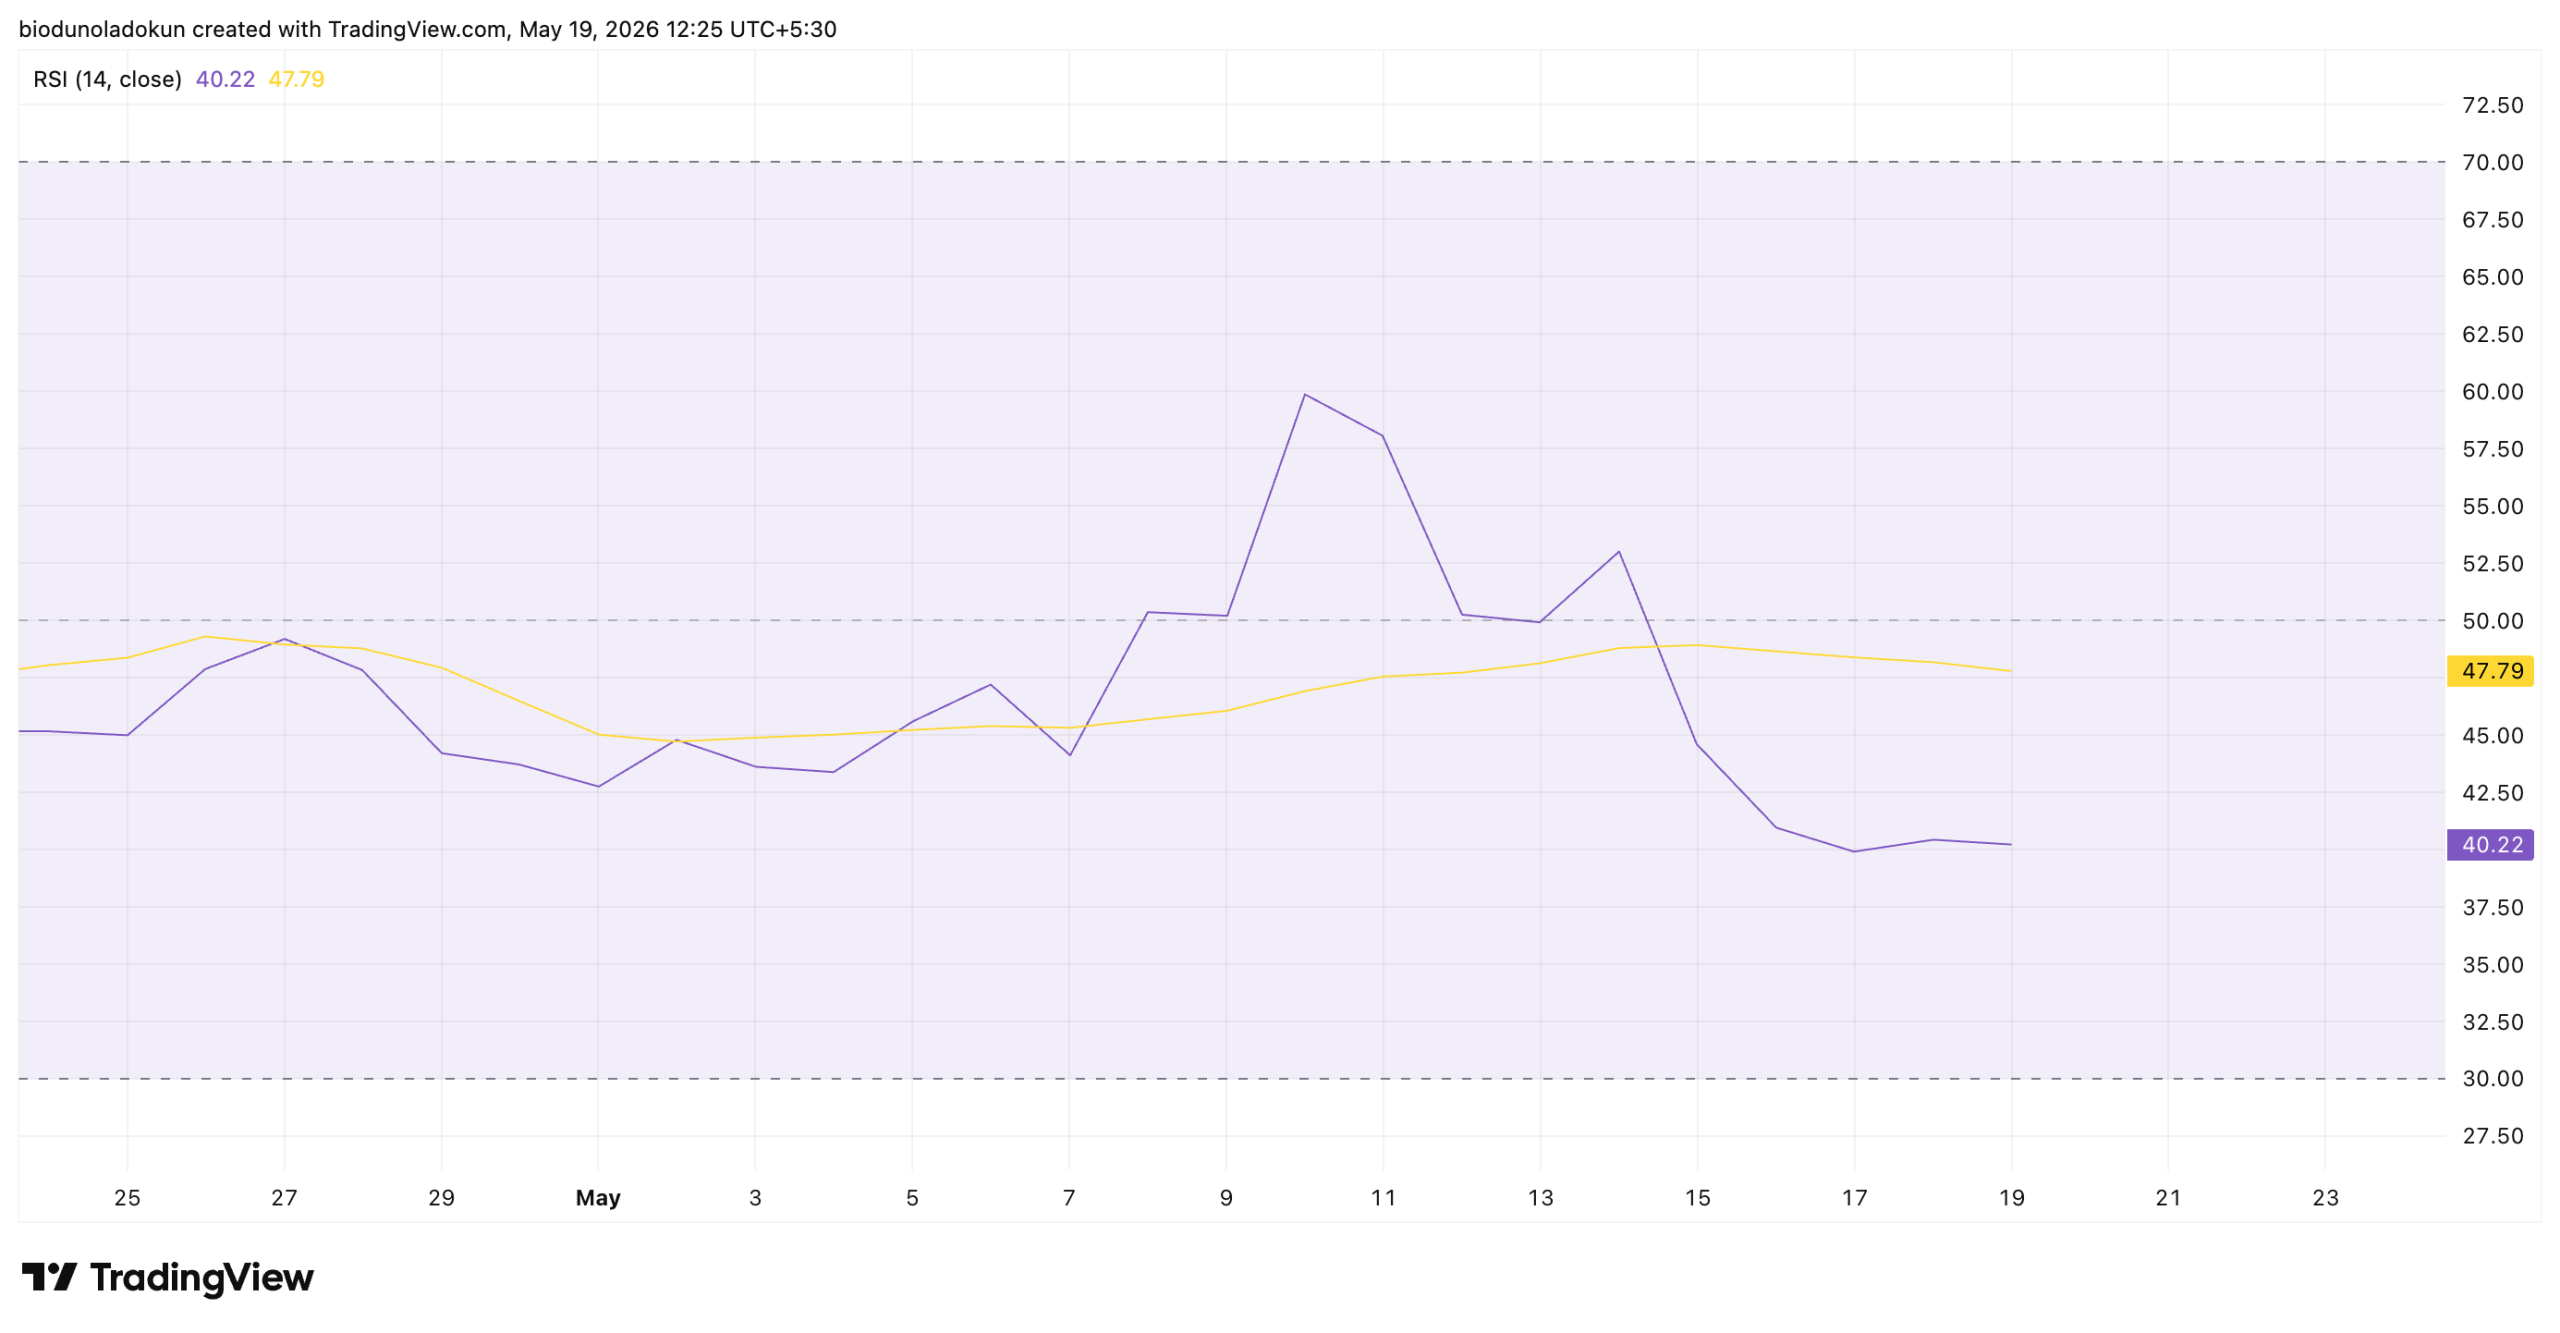
Moreover, readings from AAVE’s Relative Strength Index (RSI) support this bearish outlook. At press time, it is at 40.22, below the neutral 50 threshold and trending lower.
Disclaimer:
The information provided in this article is for informational purposes only. It is not intended to be, nor should it be construed as, financial advice. We do not make any warranties regarding the completeness, reliability, or accuracy of this information. All investments involve risk, and past performance does not guarantee future results. We recommend consulting a financial advisor before making any investment decisions.
Abiodun Oladokun is a Research Analyst at CCN, where he covers cryptocurrency markets with a focus on on-chain analysis, technical assessments, and emerging trends across decentralized finance (DeFi), real-world assets (RWA), artificial intelligence (AI), decentralized physical infrastructure networks (DePIN), Layer 2s, and meme coins.
Prior to CCN, he served as a Senior On-Chain Analyst at BeInCrypto, producing market reports spanning diverse crypto sectors.
Before that, he conducted technical analysis and market assessments of various altcoins at AMBCrypto, where he also contributed long-form quarterly research papers on DeFi, NFTs, DAOs, and scaling architectures, leveraging on-chain platforms including Messari, Santiment, DefiLlama, and Dune Analytics.
He began his crypto career as a research analyst at SixthSense DAO, developing blockchain forensic tools to trace the history of stolen assets.
Abiodun is a lawyer called to the Nigerian Bar and the founder of Ilé Ijó, a Lagos-based electronic dance music collective.