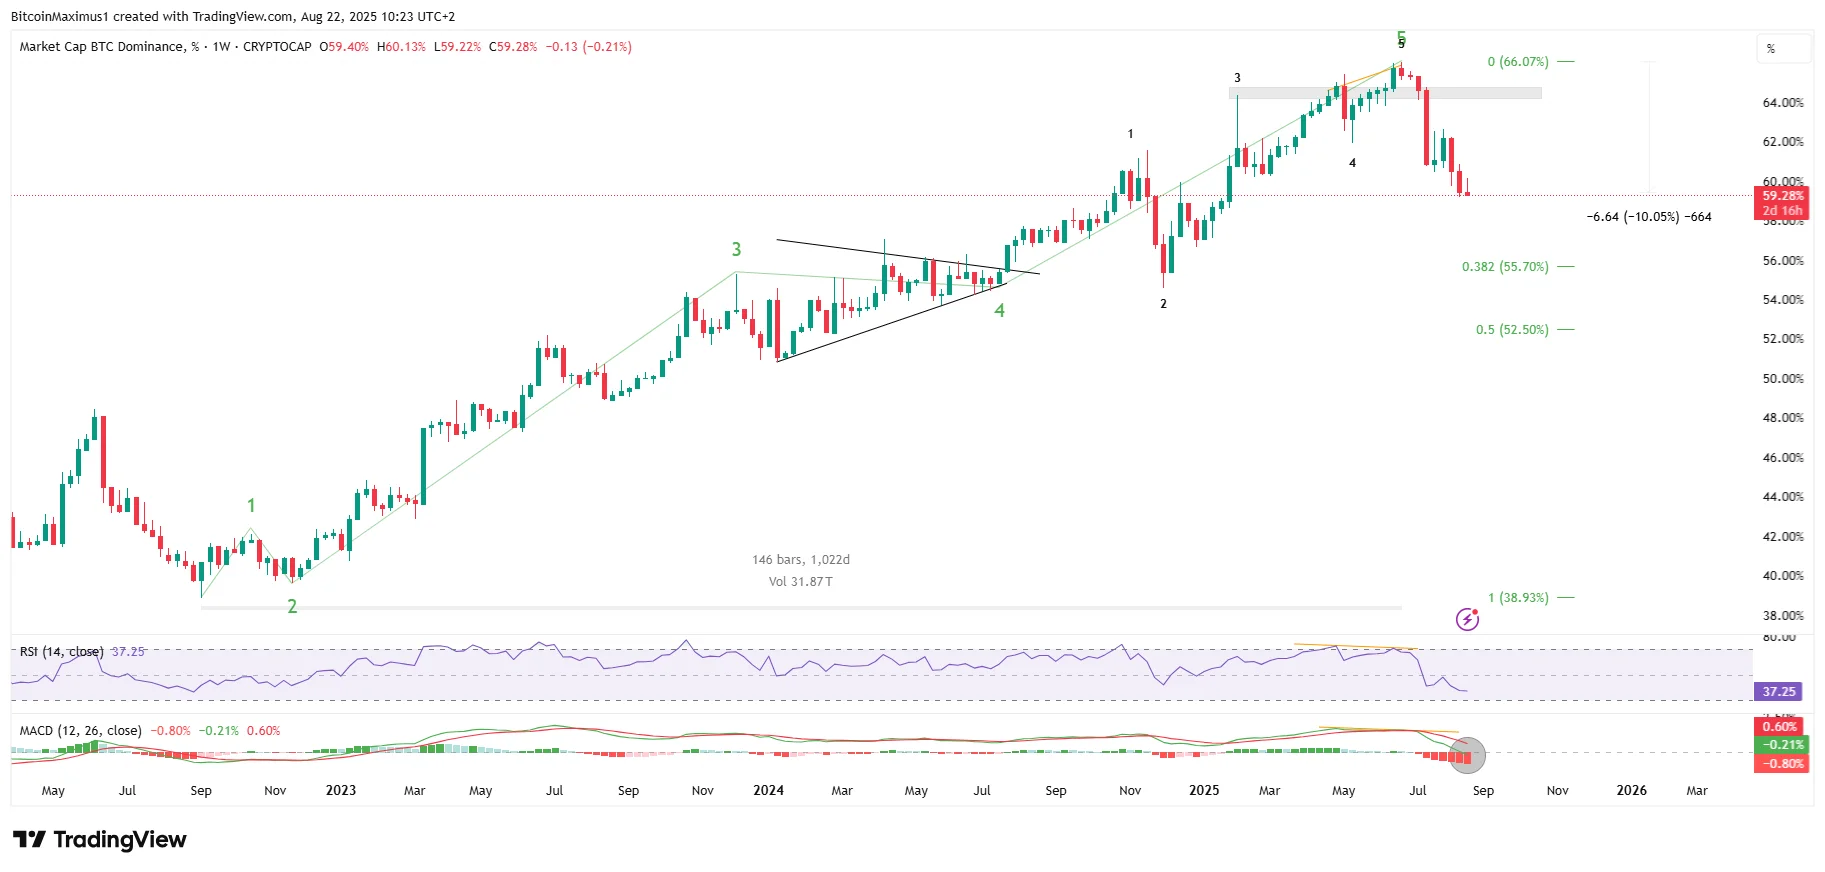
However, the upward trend has reversed since June, leading to a 10% decrease and a low of 59.18%.
Get These Top Crypto Casino Offers Now!
Sponsored
Disclosure
We sometimes use affiliate links in our content, when clicking on those we might receive a commission at no extra cost to you. By using this website you agree to our terms and conditions and privacy policy.
Bearish divergences in the Relative Strength Index (RSI) and Moving Average Convergence/Divergence (MACD) led to the decline,
The indicators are now well into bearish territory, confirming the downward trend.
The MACD reading is especially interesting, since the indicator has fallen into negative territory (black circle) for the first time since the end of 2022.
So, Bitcoin’s dominance will likely fall in the long term, meaning altcoin season will continue.
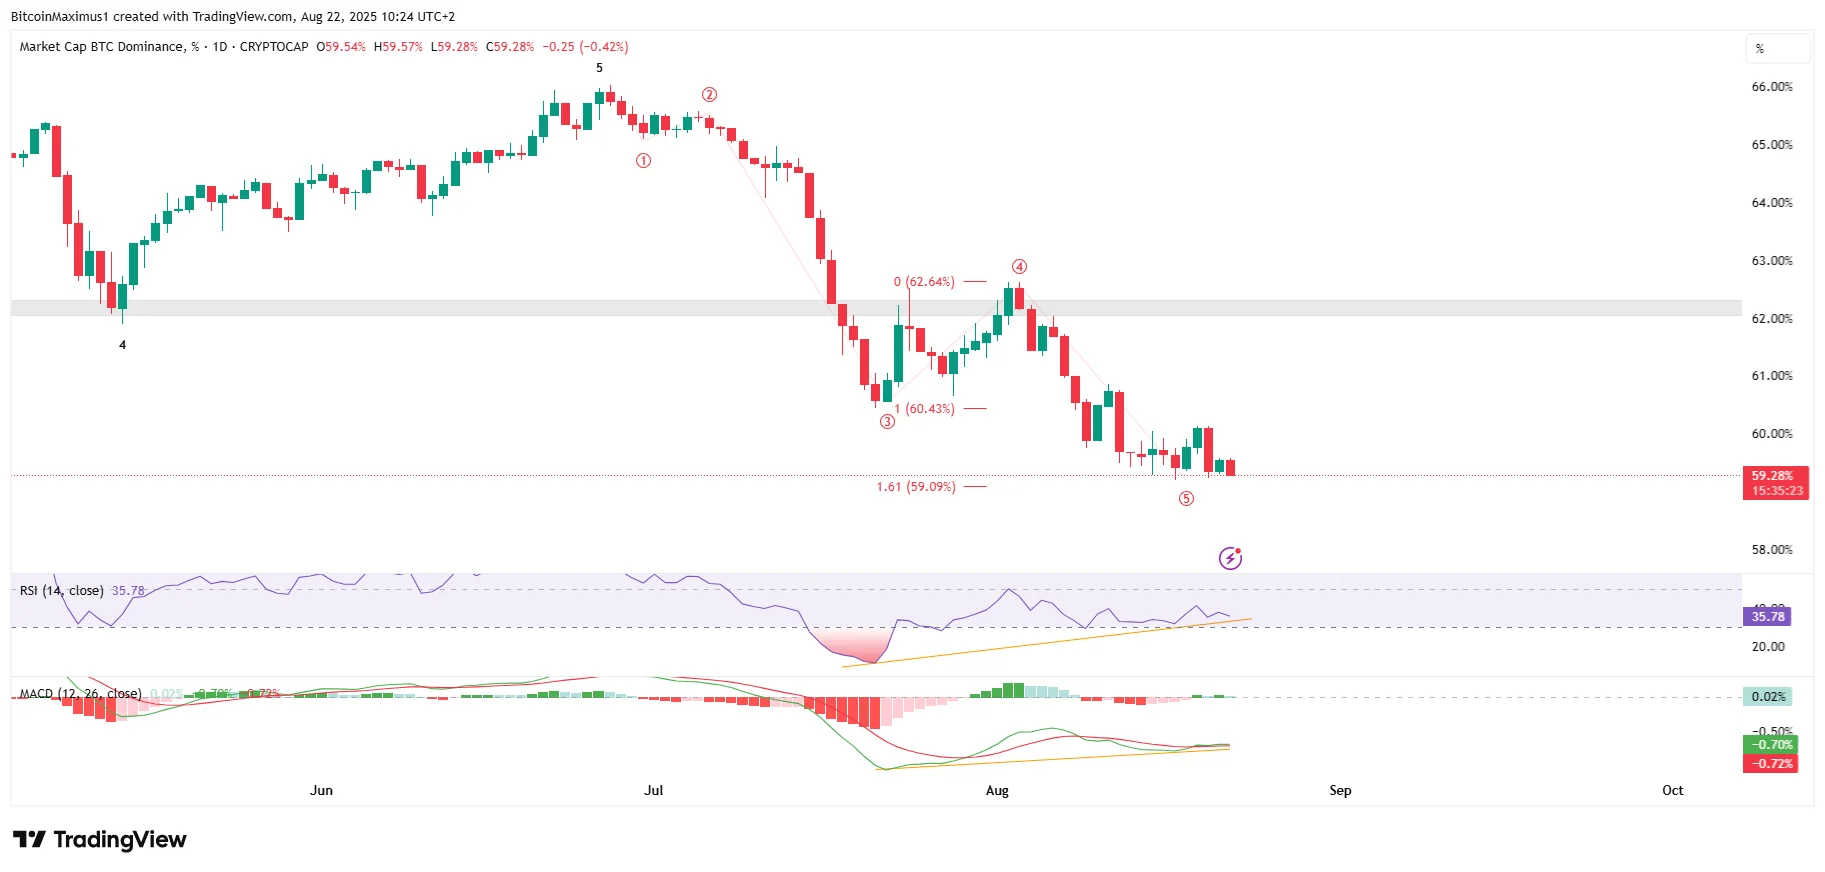
So, BTC’s dominance could bounce today and continue in the short term, targeting the resistance at 62.50% before falling again.
No signs suggest that altcoin season is at risk for the rest of 2025.
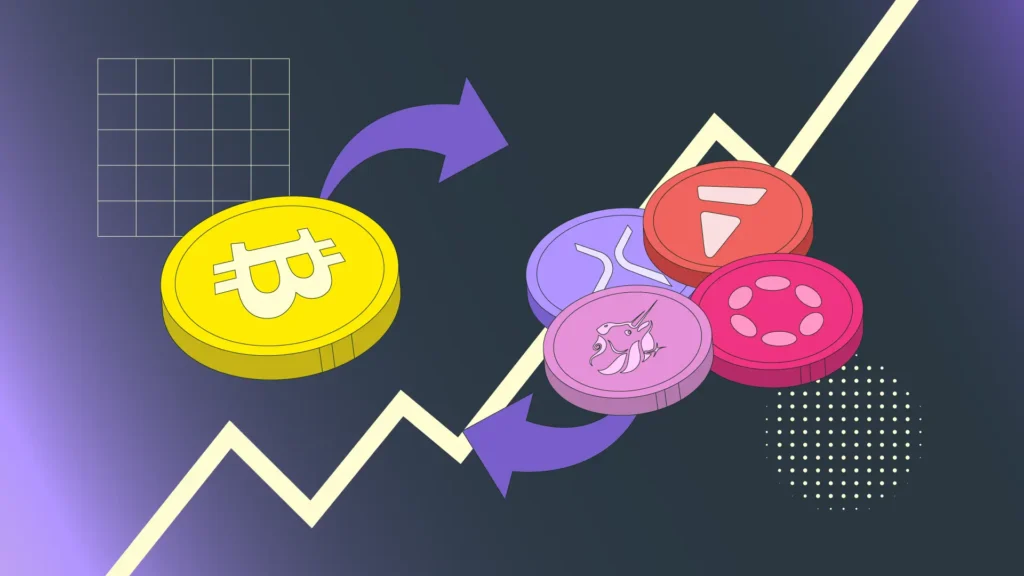
How Will Altcoins Fare?
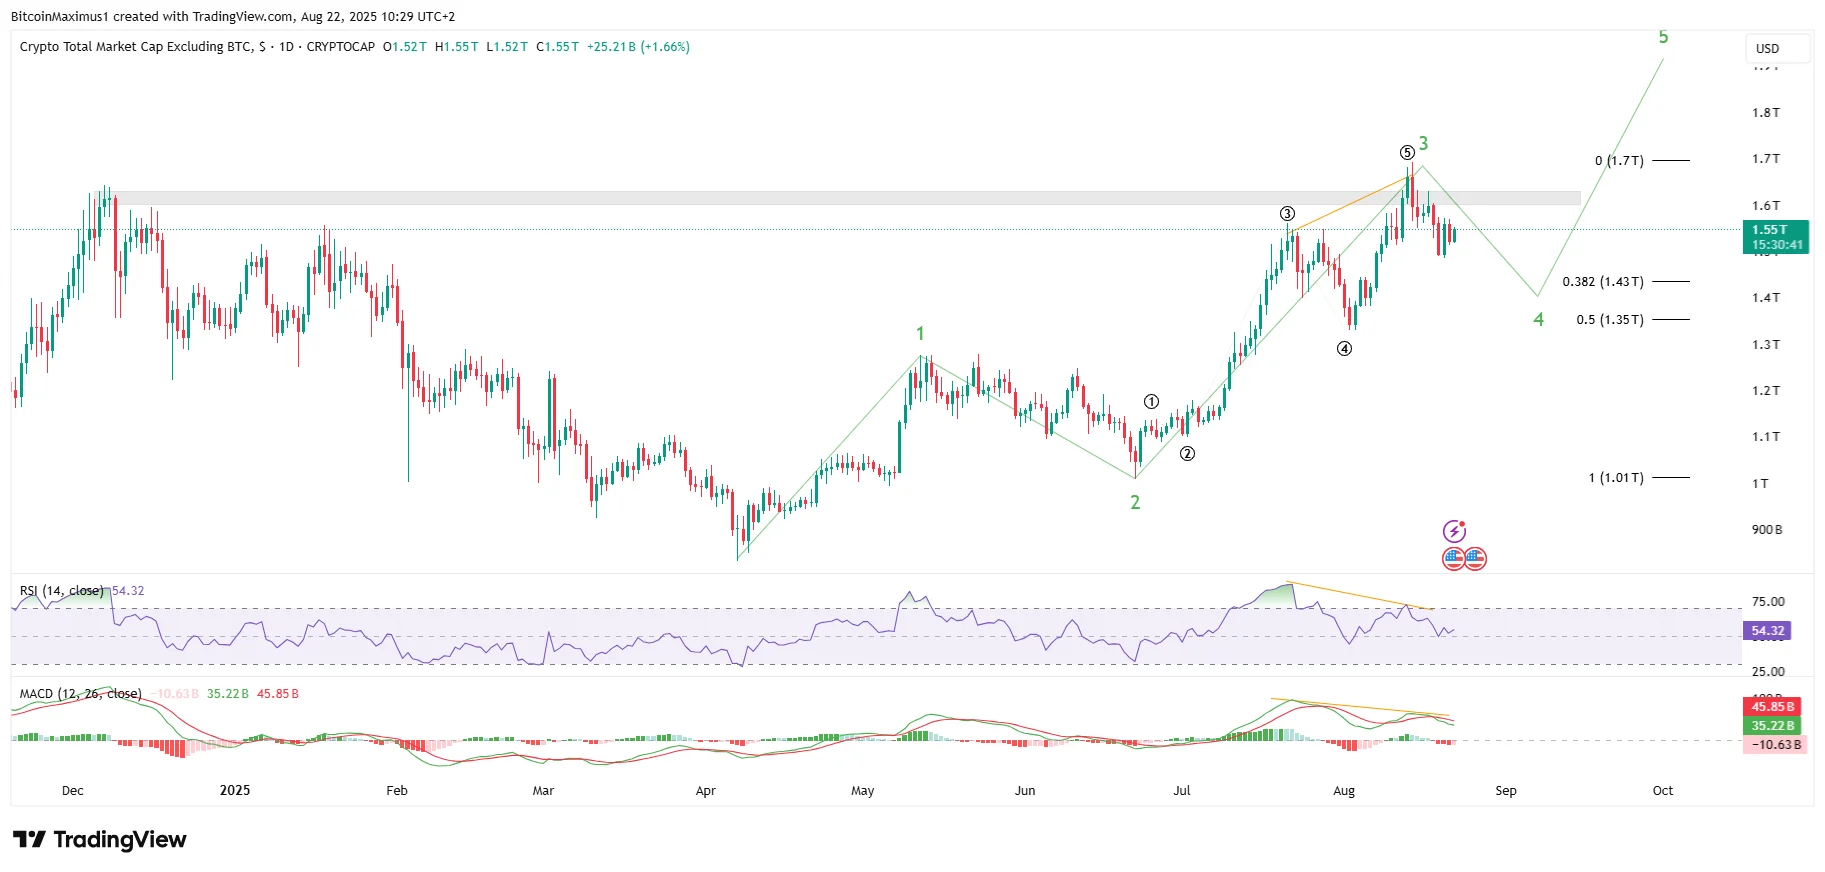
The Altcoin market cap reached a new cycle high on Aug. 14, but the price failed to reach a new all-time high.
Since then, the ALTCAP has fallen under $1.60 trillion, failing to sustain the breakout above the cycle highs.
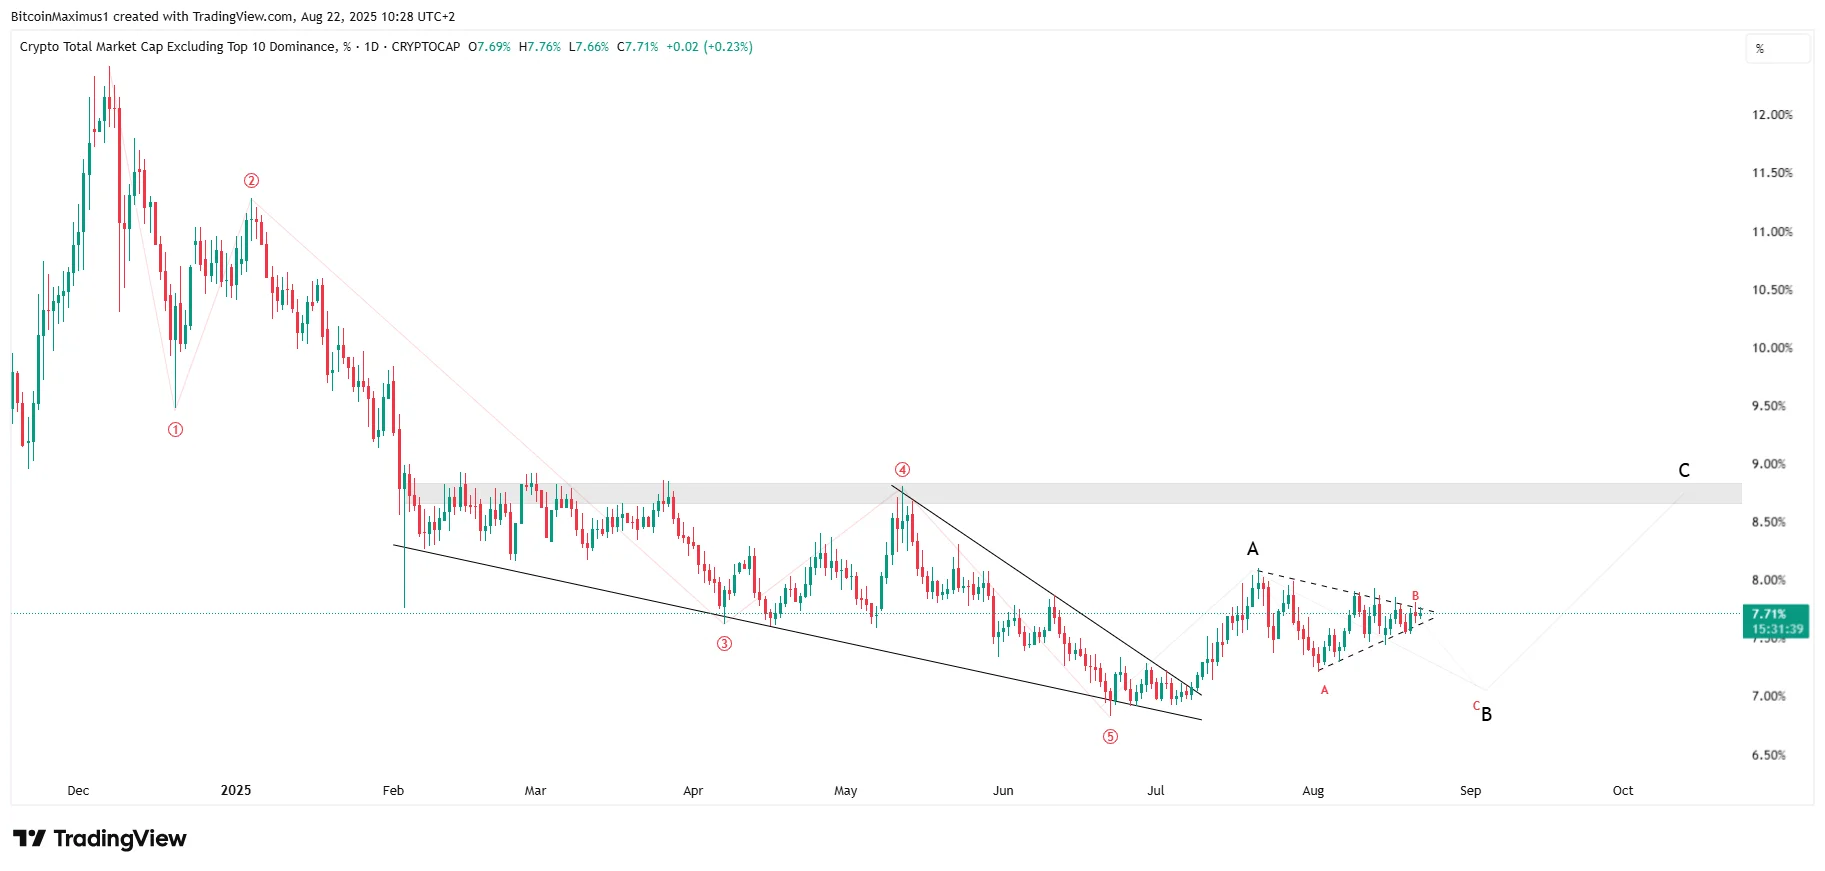
Such deviations are bearish structures that often lead to much lower prices.
Adding to the overall bearishness, the RSI and MACD generated bearish divergences (orange).
Altcoin Market Cap | Credit: Valdrin Tahiri/ TradingView
The wave count suggests the ALTCAP is in wave four of a five-wave upward movement and the correction could end near the 0.382-0.5 Fibonacci support levels at $1.35-$1.43 trillion.
Small altcoins are trading in wave B of an A-B-C correction (black). The short-term movement shows a symmetrical triangle, from which a breakdown is expected.
After the breakdown, small-cap altcoins could begin another rally toward the 8.70% level.
These analyses align with the Bitcoin dominance rate. While the BTCD bounces in the short term, the ALTCAP is likely to fall, and small altcoins could be hit hard.
End-of-year Rally
The data makes it clear: Bitcoin’s dominance is losing steam while altcoins prepare for their next major move.
Short-term relief bounces may occur, but the broader trend suggests continued strength for altcoins into 2025.
Small altcoins could see some short-term pain, but they will likely explode in Q4.
Disclaimer:
The information provided in this article is for informational purposes only. It is not intended to be, nor should it be construed as, financial advice. We do not make any warranties regarding the completeness, reliability, or accuracy of this information. All investments involve risk, and past performance does not guarantee future results. We recommend consulting a financial advisor before making any investment decisions.
Valdrin Tahiri is a cryptocurrency analyst and reporter at CCN, specializing in technical analysis with a focus on Elliott Wave theory, on-chain metrics, and fundamental research. He brings over seven years of experience in the crypto space as both a trader and writer.
He discovered cryptocurrencies in 2017 while earning his MSc in Financial Markets at the Barcelona School of Economics, which sparked a deep interest in blockchain and market dynamics. Since then, he’s contributed to top crypto outlets like BeInCrypto and CoinGape.
Valdrin also served as Community Manager of BeInCrypto’s Telegram group for three years, helping grow it into one of the largest crypto communities worldwide. His expertise in market structure and price patterns allows him to break down complex trends into clear, actionable insights.
He’s published thousands of articles covering altcoins, Bitcoin cycles, and macro trends.