ZEC price rises after Robinhood listing | Credit: Hameem Sarwar
Share
Key Takeaways
Zcash is gaining momentum after a strong rally and Robinhood listing, breaking out of consolidation.
Rising OI and indicators support further upside, though crowded positioning increases volatility.
Holding above key support could drive ZEC’s price toward $395, while a failure could trigger a pullback.
Zcash (ZEC) was already having a strong month before Robinhood stepped in.
The token had climbed 45% over the past few weeks, quietly outperforming much of the market.
Then came the catalyst: Robinhood announced that ZEC is now tradable on its platform.
The reaction was immediate. Zcash jumped another 10% on the news, pushing it firmly back into focus for traders.
Here’s a closer look at what’s driving the move—and what could come next for ZEC.
Sponsored
Disclosure
We sometimes use affiliate links in our content, when clicking on those we might receive a commission at no extra cost to you. By using this website you agree to our terms and conditions and privacy policy.
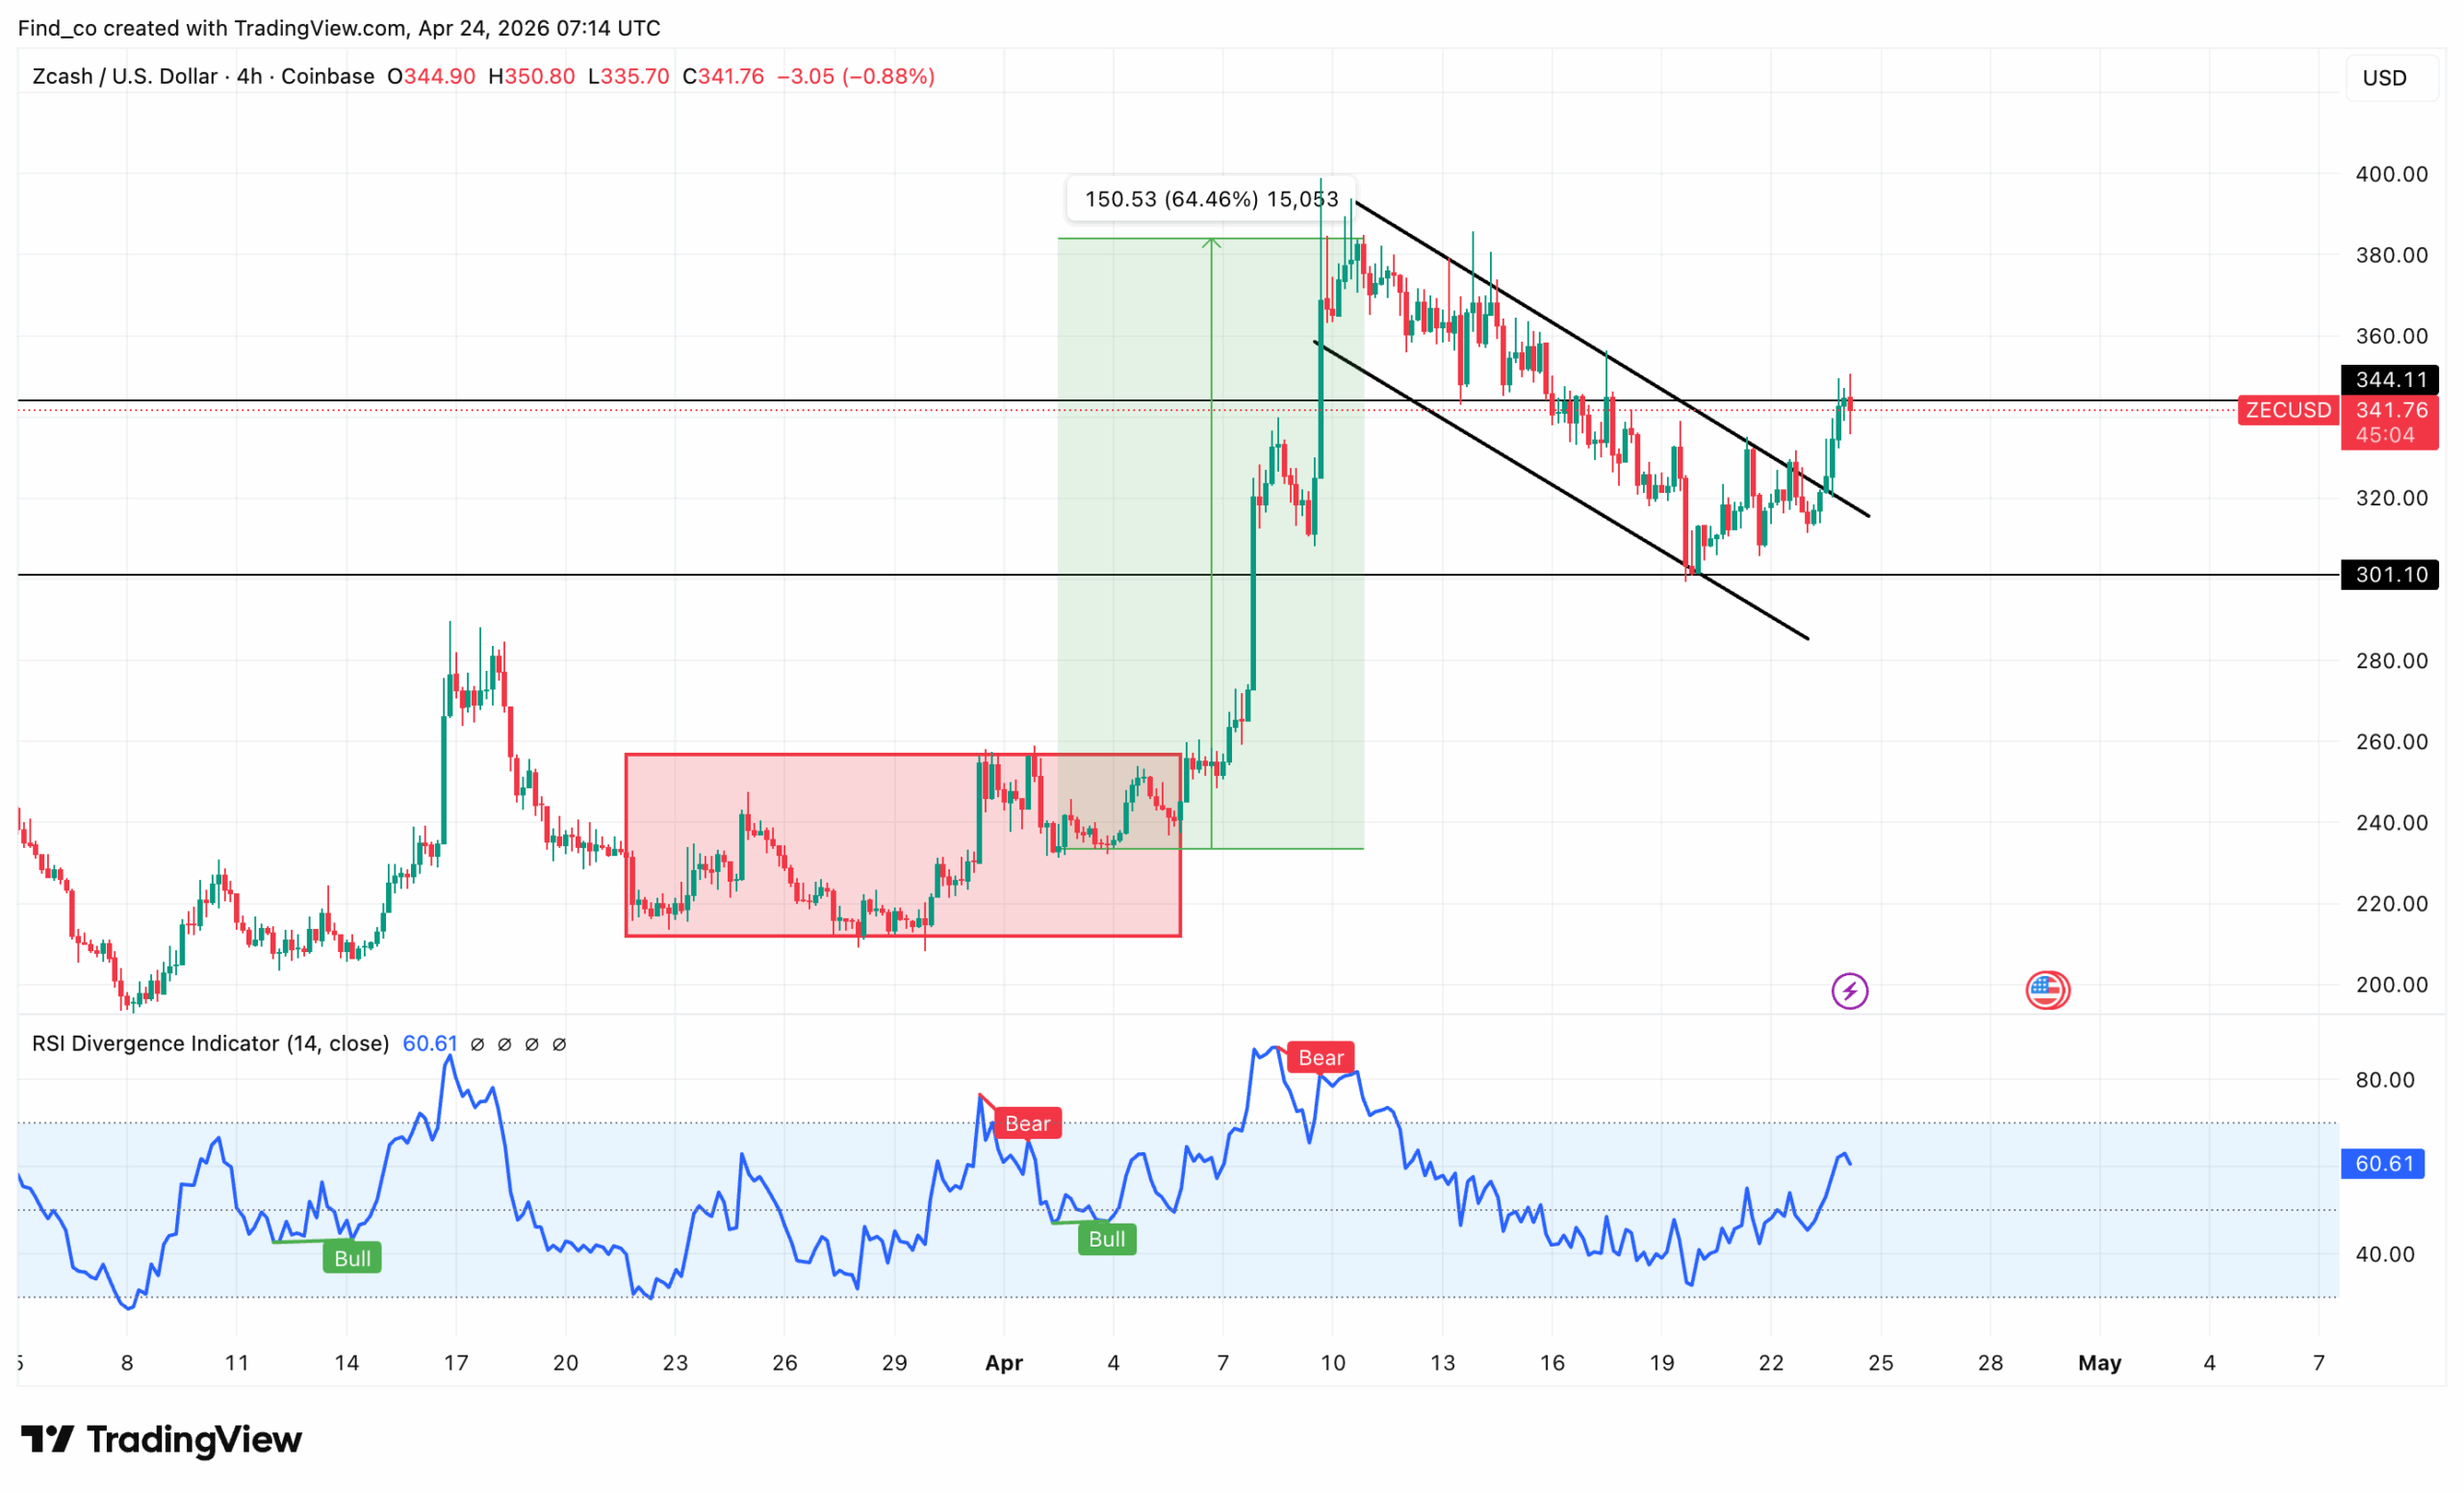
So, if ZEC’s price can hold above $345, the breakout is more likely to continue.
If it fails and drops back into the channel, it suggests the breakout lacked strength, and the price would likely rotate back toward the $300 region.
Robinhood Listing Coincides With Rising OI
As stated earlier, while the Robinhood listing wasn’t entirely responsible for the bullish setup, it played a part.
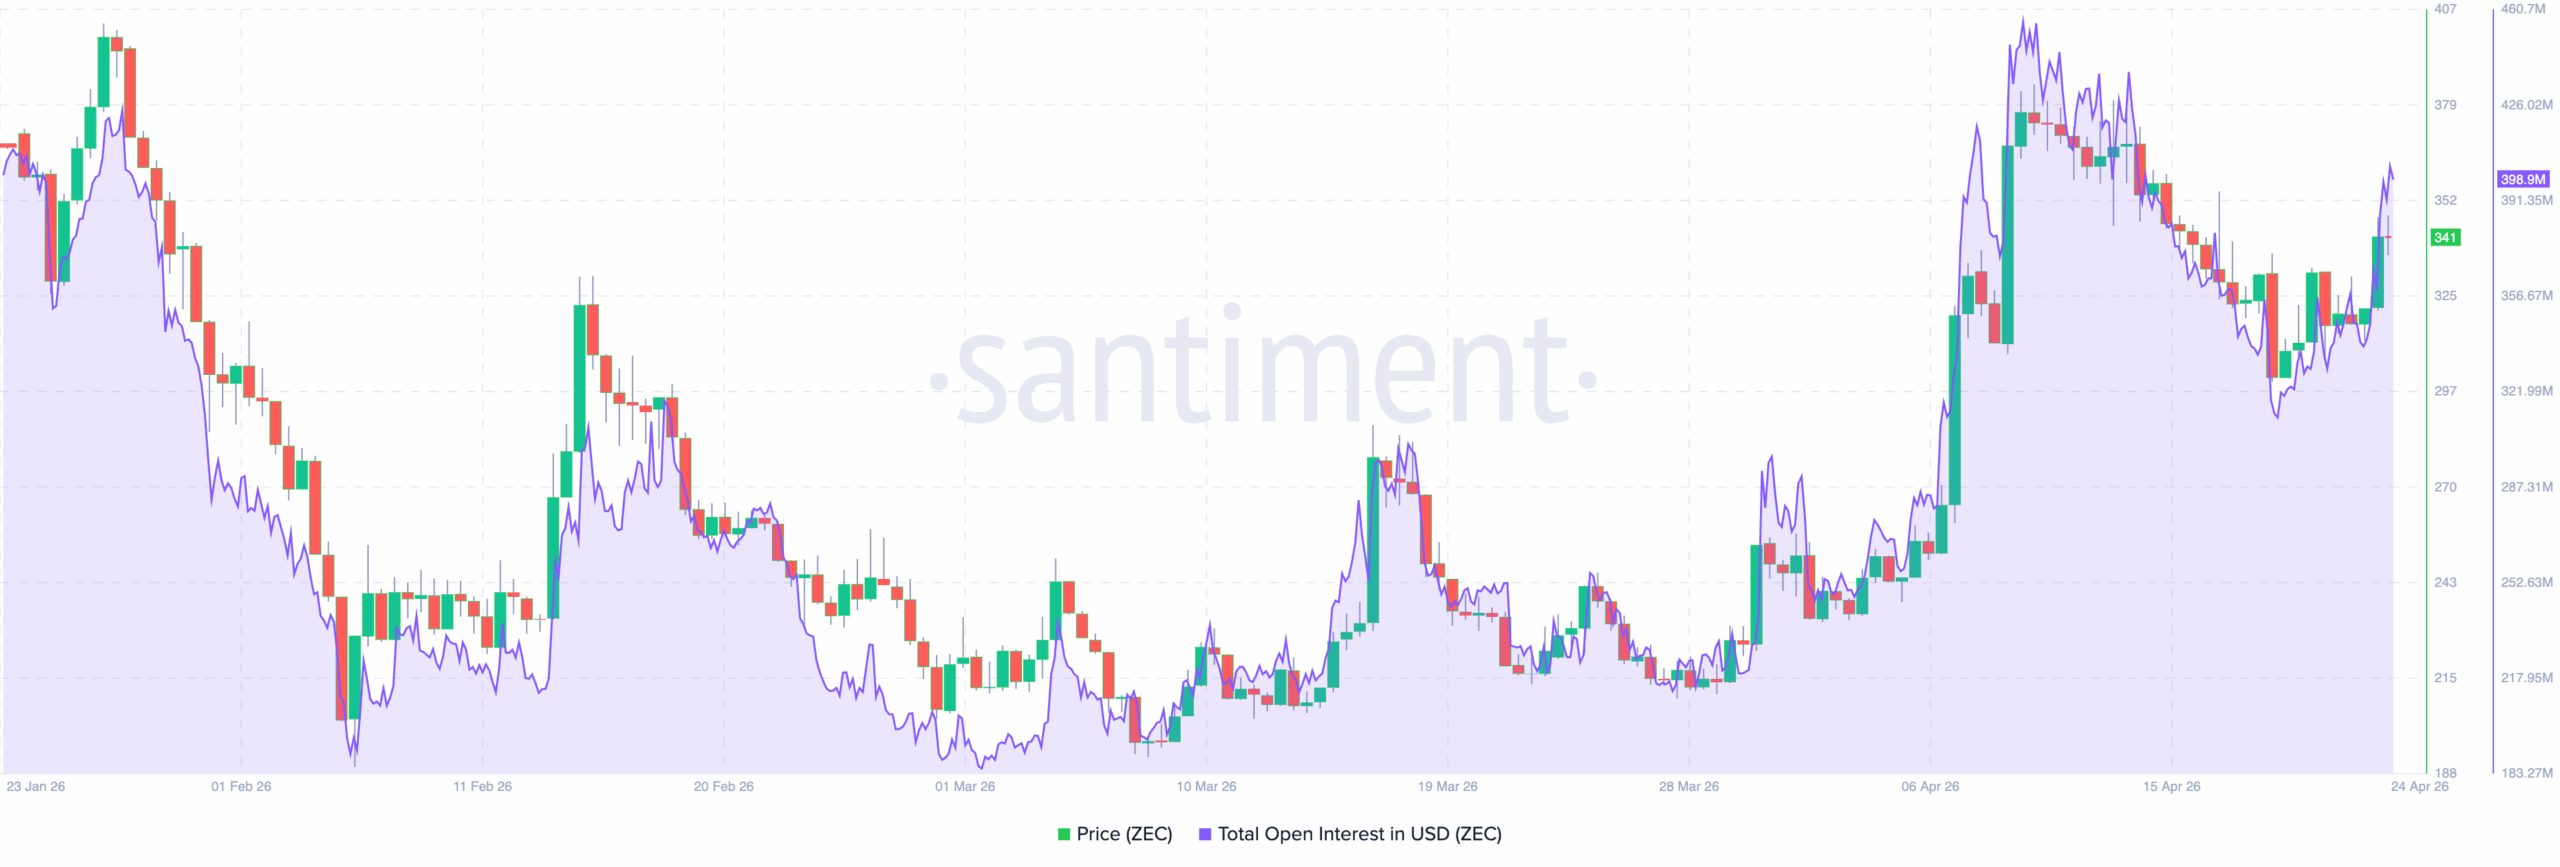
Amid that, on-chain data from Santiment shows that ZEC’s Open Interest (OI) is rising alongside price, and that combination matters a lot for what comes next.
Earlier in the chart, rallies with rising OI tended to sustain moves, meaning new positions were being added.
Right now, you’re seeing the same dynamic again. Notably, Zcash’s price is pushing back toward $340 while OI is climbing.
However, when OI expands aggressively near local highs, it increases the risk of a crowded trade.
If the positioning is mostly long, even a small rejection can trigger liquidations, accelerating the downside quickly.
But in the current context, if ZEC continues higher and breaks into the $380 region with OI still rising, the move can extend.
ZEC Price Prediction: Higher?
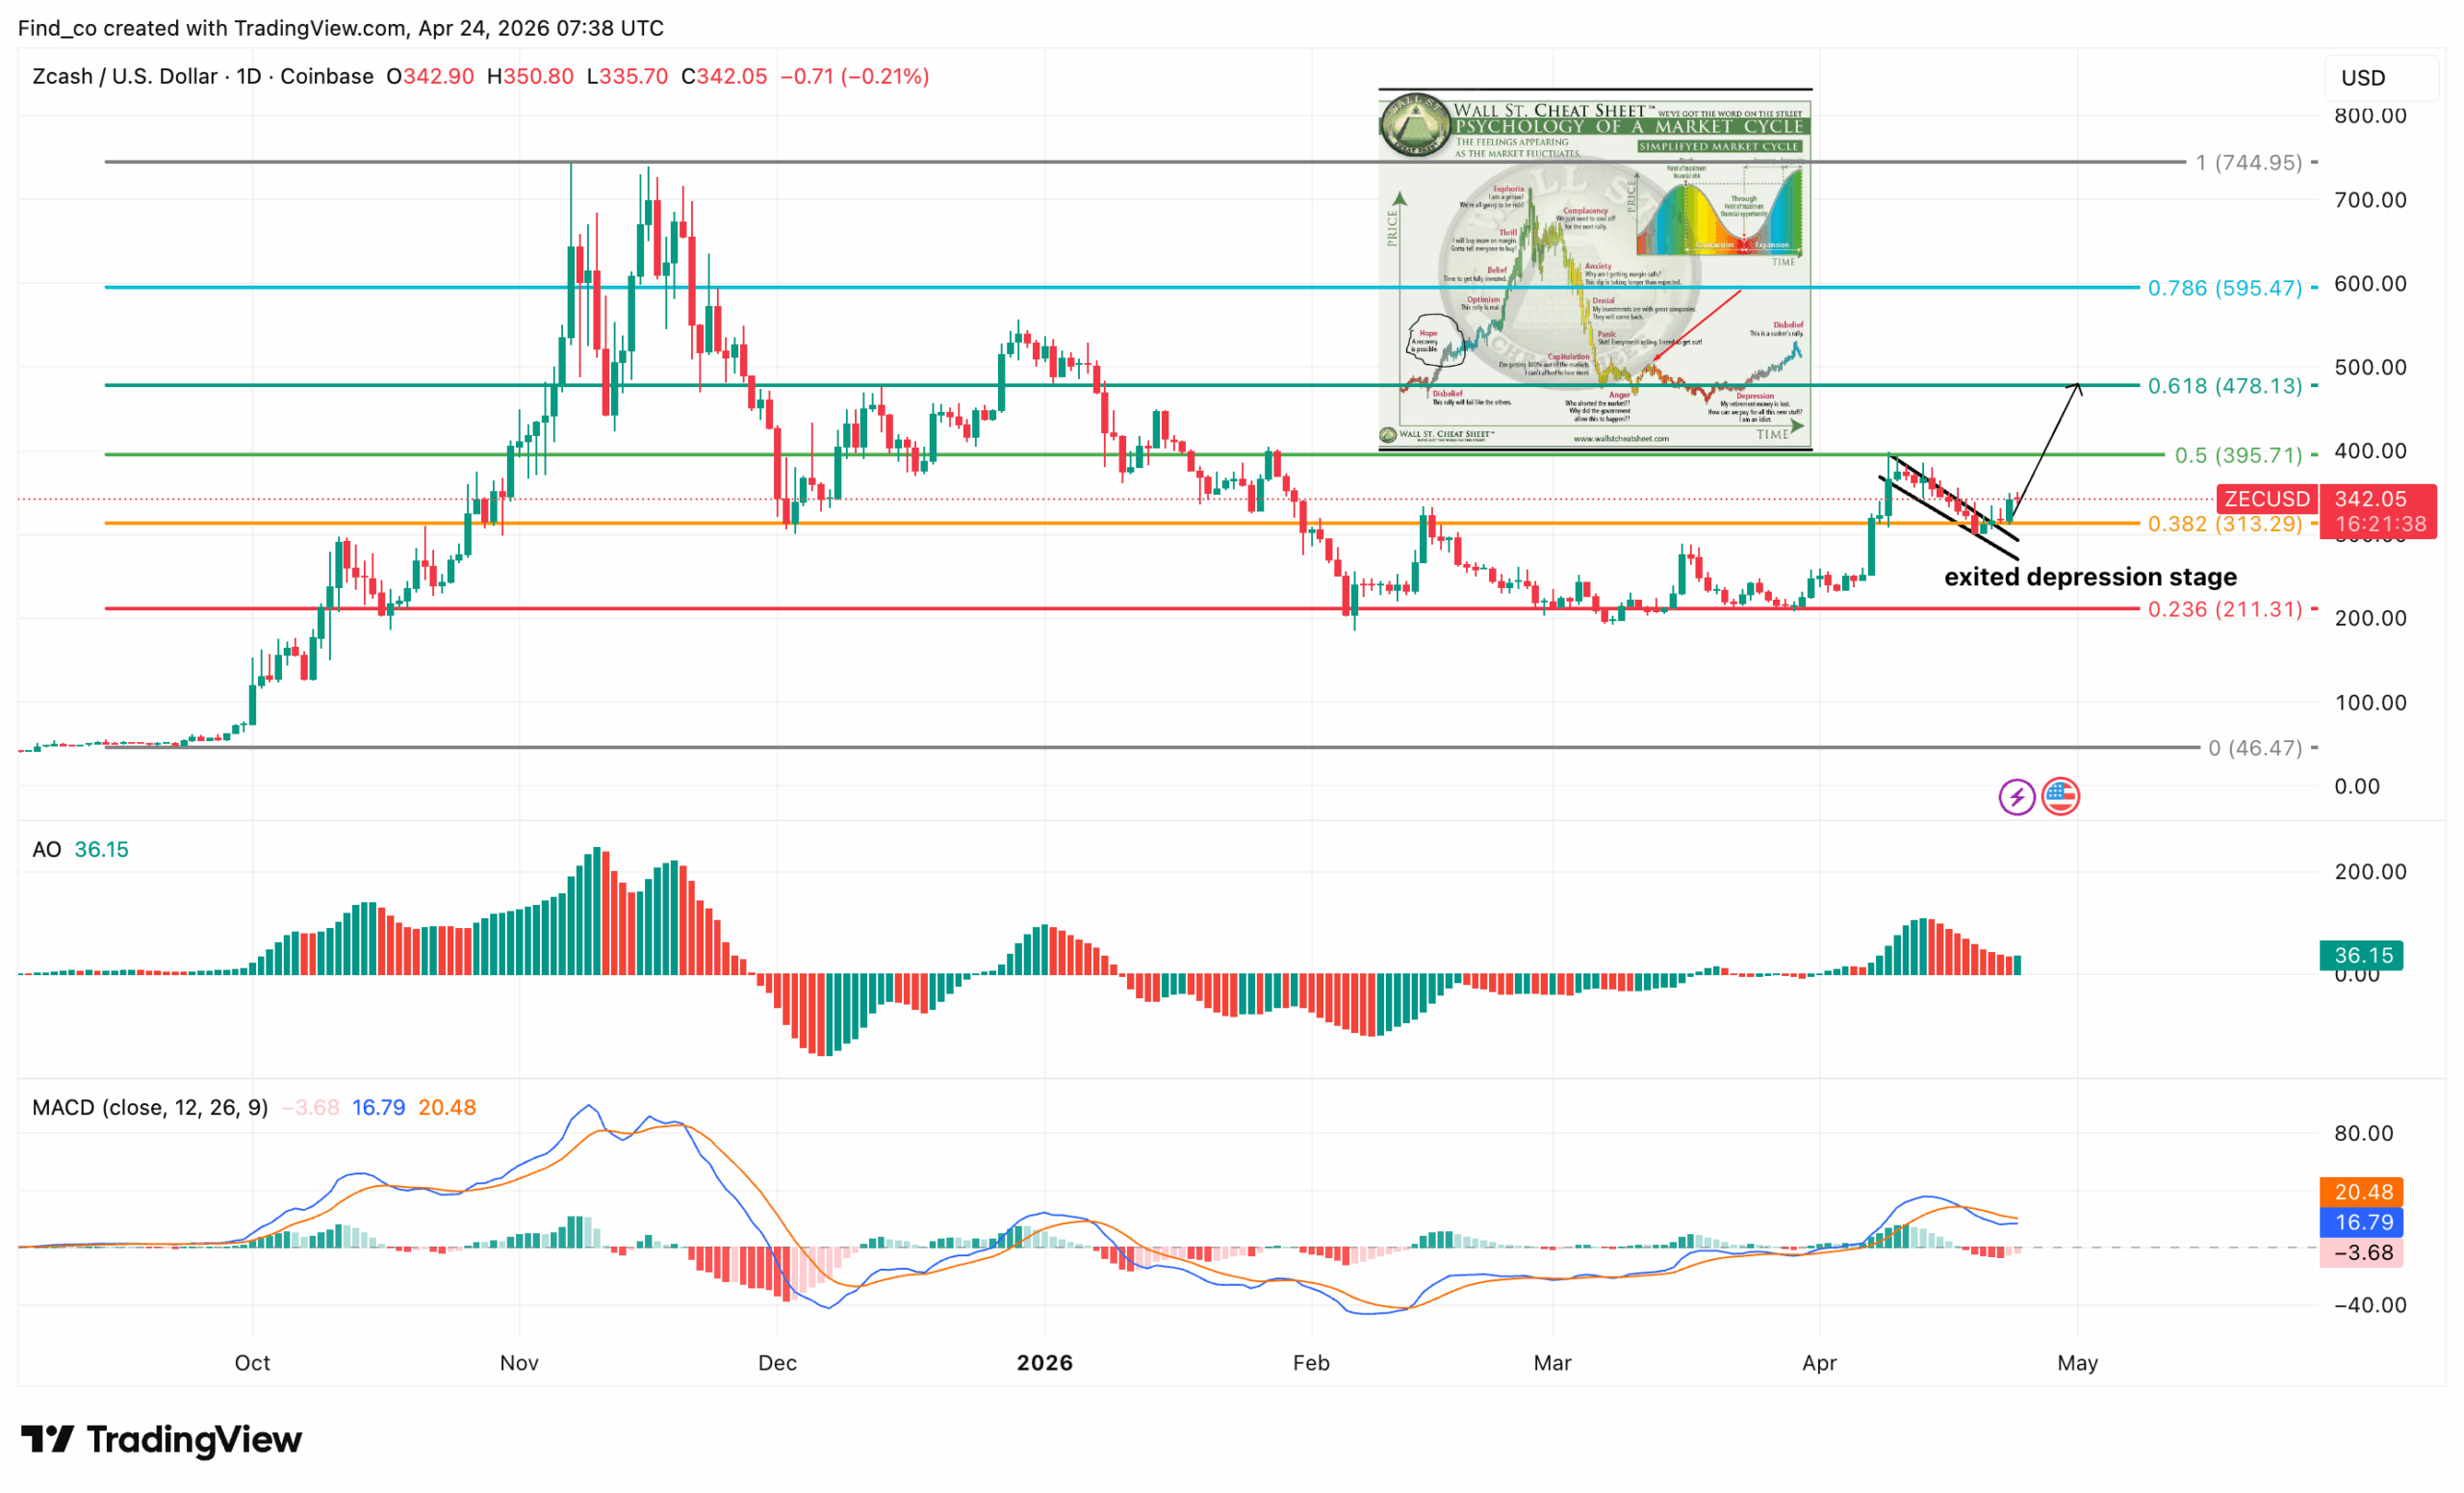
On the daily chart, ZEC is transitioning out of a long depression phase, and the structure clearly reflects that.
As shown below, the Zcash price traded around the $250 zone (0.236 Fib) for an extended period, which aligns with the highlighted “depression/accumulation” phase.
The move above that level, into the $300+ region, signals that the market has already shifted into an early recovery phase.
The recent pullback formed a small descending wedge, and the breakout from that wedge suggests continuation rather than exhaustion.
Disclaimer:
The information provided in this article is for informational purposes only. It is not intended to be, nor should it be construed as, financial advice. We do not make any warranties regarding the completeness, reliability, or accuracy of this information. All investments involve risk, and past performance does not guarantee future results. We recommend consulting a financial advisor before making any investment decisions.
Victor Olanrewaju is a crypto analyst and reporter at CCN with deep roots in on-chain research and technical analysis. His crypto journey began in 2017, but it was the 2020 Uniswap airdrop that sparked a full-time pivot into the space.
With a foundation in copywriting, Victor honed his craft creating high-converting content for leading crypto brokers — most notably an XRP price prediction that ranked #1 on Google during the 2021 bull run.
He later joined AMBCrypto in 2022, where he combined storytelling with technical and on-chain analysis to cover key market narratives.
In 2024, he expanded his expertise at BeInCrypto, collaborating with analysts and using tools like Glassnode, Santiment, and IntoTheBlock to break down Bitcoin and altcoin trends.
At CCN, Victor covers the top cryptocurrencies, memecoins, macro shifts, blending real-time insights with deep-dive metrics.
He holds a Bachelor’s degree in Physics from the University of Ibadan, equipping him to simplify complex data for a wide audience. Follow his work or connect on LinkedIn or X.