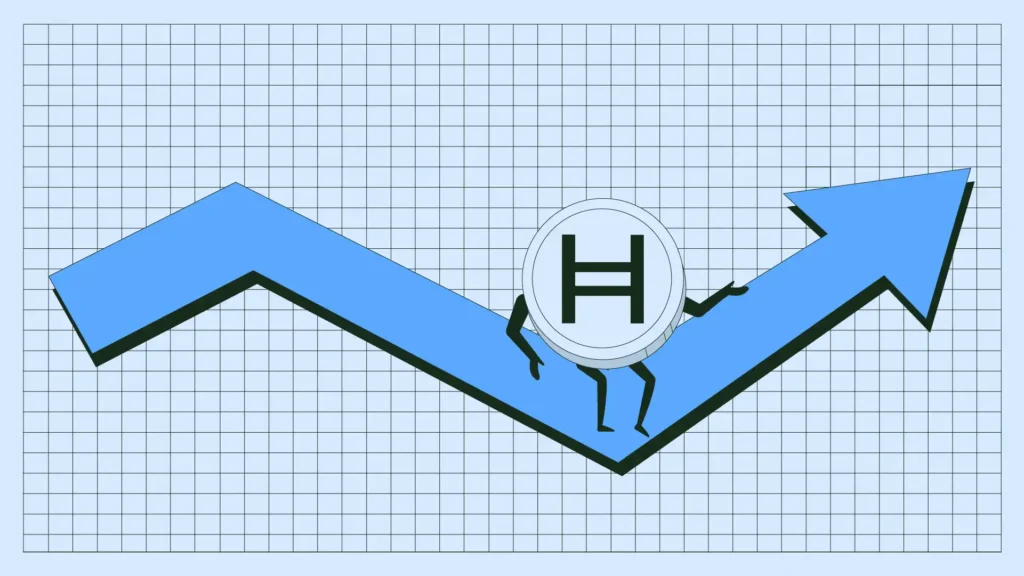
Can HBAR Reach a New All-Time High? | Credit: Hameem Sarwar
Share
Key Takeaways
Hedera (HBAR) has increased by 125% in less than a month.
The HBAR price trades less than 40% below its cycle high.
Can HBAR rally above its cycle highs and reach a new all-time high?
Hedera (HBAR) has surged 125% in under a month, nearing two key resistance levels and trading just 40% below its cycle high.
With strong bullish momentum, traders ponder whether HBAR can rise to a new all-time high.
Hedera’s fractal with XRP and XLM bodes well for the future since the former’s price is at a time high while the latter is close to doing so.
This analysis will break down the charts and determine if HBAR will reach new highs this cycle.
HBAR Price Analysis
The weekly time frame analysis shows that the price of HBAR is creating its fourth consecutive bullish weekly candlestick.
HBAR’s rally started once the price bounced at the $0.125 horizontal support area (green icon) and has become parabolic.
Try Our Recommended Crypto Exchanges
Sponsored
Disclosure
We sometimes use affiliate links in our content, when clicking on those we might receive a commission at no extra cost to you. By using this website you agree to our terms and conditions and privacy policy.
Momentum indicators suggest this will be the case. The Relative Strength Index (RSI) is above 50 (black circle), and the Moving Average Convergence/Divergence (MACD) is positive (black circles).
They created this signal once before, in October 2023 (vertical line), and it preceded the entire bull market rally this cycle.
Because of these positive readings, the Hedera prediction for 2025 is bullish, and the floodgates will open once the price closes above $0.340.
Local Top Possible?
While the long-term outlook is extremely bullish, zooming in on the six-hour chart shows signs of weakness.
This is because the price of Hedera trades inside an area is suitable for creating a local top.
Disclaimer:
The information provided in this article is for informational purposes only. It is not intended to be, nor should it be construed as, financial advice. We do not make any warranties regarding the completeness, reliability, or accuracy of this information. All investments involve risk, and past performance does not guarantee future results. We recommend consulting a financial advisor before making any investment decisions.
Valdrin Tahiri is a cryptocurrency analyst and reporter at CCN, specializing in technical analysis with a focus on Elliott Wave theory, on-chain metrics, and fundamental research. He brings over seven years of experience in the crypto space as both a trader and writer.
He discovered cryptocurrencies in 2017 while earning his MSc in Financial Markets at the Barcelona School of Economics, which sparked a deep interest in blockchain and market dynamics. Since then, he’s contributed to top crypto outlets like BeInCrypto and CoinGape.
Valdrin also served as Community Manager of BeInCrypto’s Telegram group for three years, helping grow it into one of the largest crypto communities worldwide. His expertise in market structure and price patterns allows him to break down complex trends into clear, actionable insights.
He’s published thousands of articles covering altcoins, Bitcoin cycles, and macro trends.