Can TWT Break Out Above Key Resistance? | Credit: Hameem Sarwar
Share
Key Takeaways
Trust Wallet Token (TWT) trades under resistance.
TWT has made three unsuccessful breakout attempts.
Can TWT finally break out and move to new highs?
Trust Wallet Token (TWT) has a subdued November relative to the rest of the crypto market, increasing by only 20%.
While TWT started December on a bullish note, reaching a high of $1.63, it failed to sustain the increase and has fallen this week.
More importantly, TWT has not broken out from a long-term horizontal resistance that has existed since 2021. Can TWT break out, and if so, how much will it increase? Let’s find out.
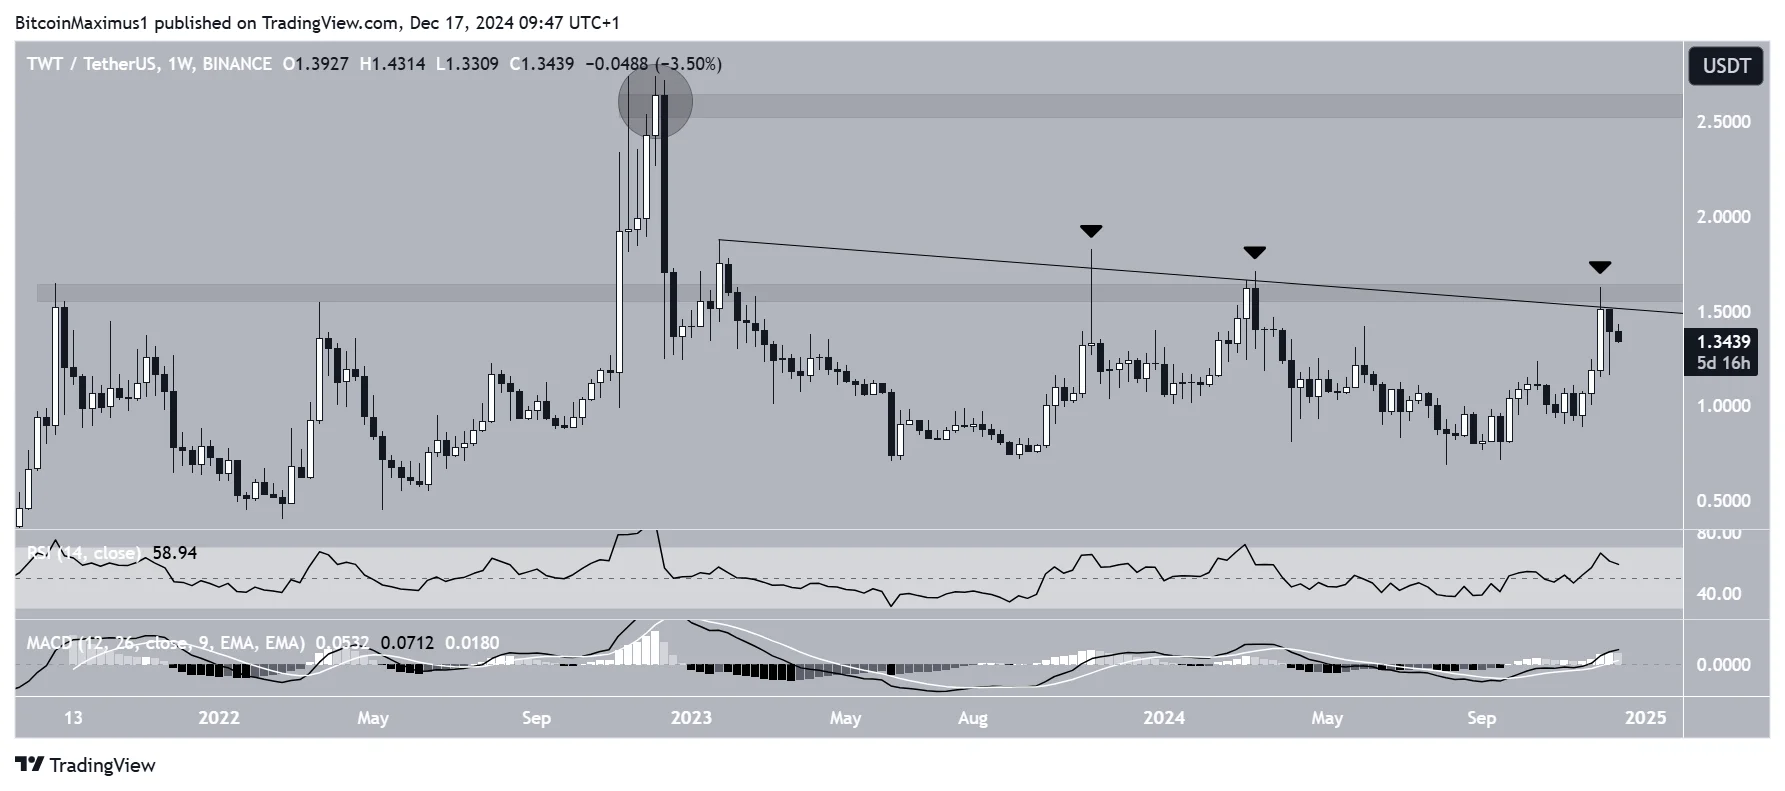
The weekly time frame TWT chart shows that the price has traded under the $1.60 horizontal resistance area since 2021.
The only exception is a brief breakout (black circle) in December 2022, which led to the all-time high price of $2.74. However, the breakout could not be sustained.
Since November 2023, the TWT price has made three unsuccessful breakout attempts (black icons), creating long upper wicks. These also validated a descending resistance trend line that has existed for over two years.
Therefore, a confluence of resistances between $1.40-$1.60 suppressed the upward movement.
Despite this resistance, technical indicators are bullish. The Relative Strength Index (RSI) and Moving Average Convergence/Divergence (MACD) are increasing and have recently crossed their bullish thresholds at 50 and 0, respectively.
So, the weekly time frame chart suggests the TWT price will break out from its confluence of resistances. If it breaks out, the next resistance will be at $2.60.
Will TWT Break Out?
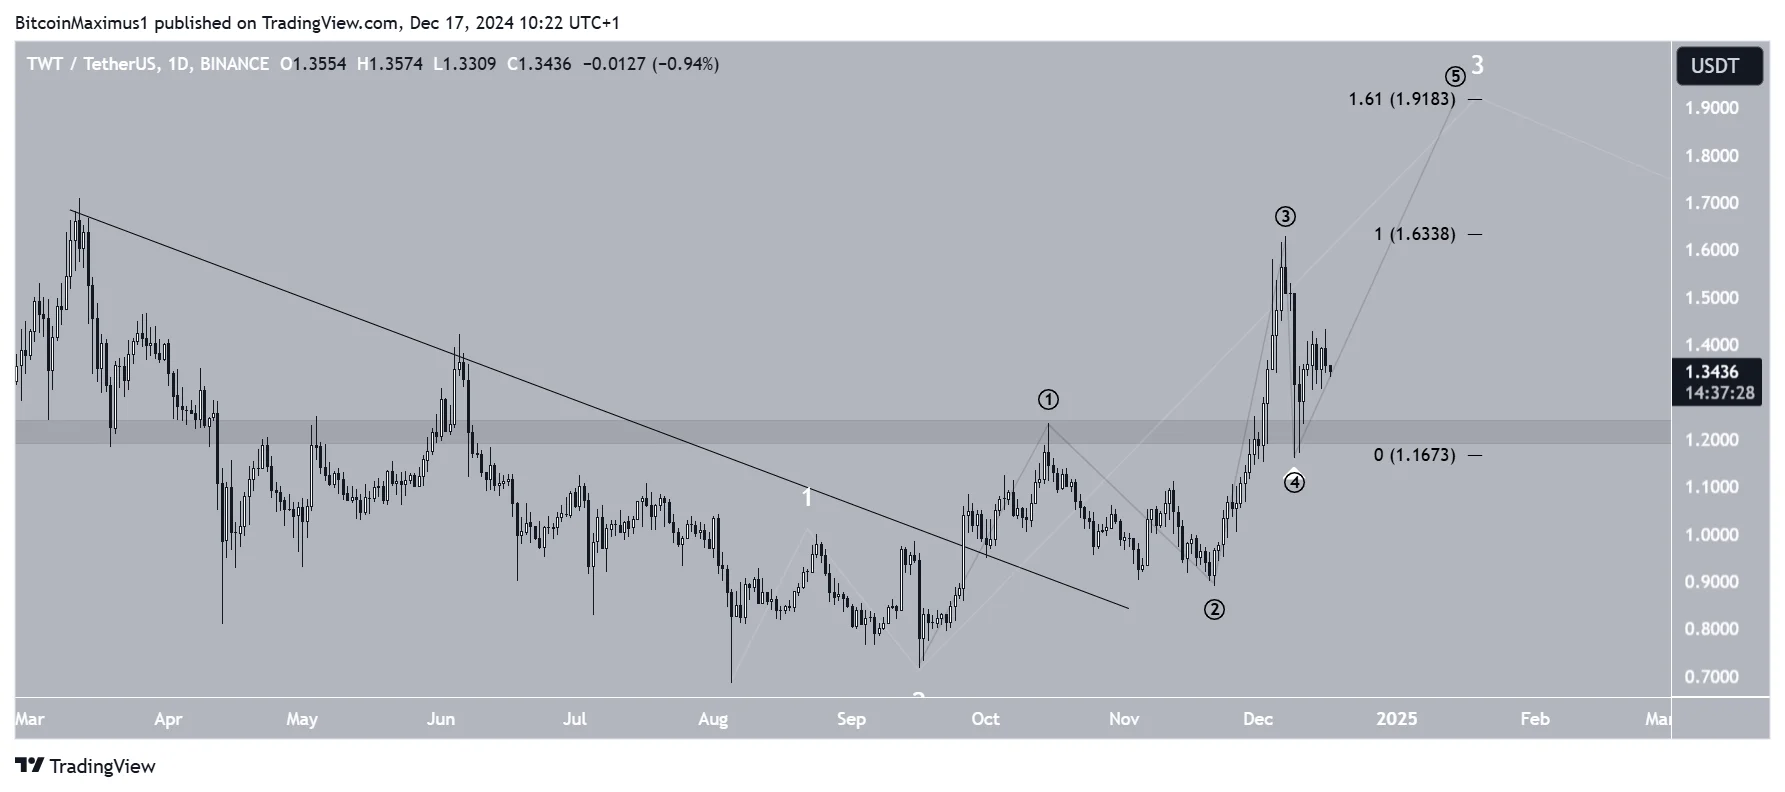
The daily time frame TWT readings are also bullish, aligning with the weekly ones. The chart shows the TWT price broke out from a shorter-term descending resistance trend line and reclaimed the $1.25 horizontal area, validating it as support (white icon).
The wave count shows an extended third wave (white) in a five-wave increase that started in August. The sub-wave count is in black.
If the count is accurate, TWT has started the fifth and final portion of wave three, with a target of $1.92, created by the 1.61 external Fibonacci retracement.
This would cause a breakout from the confluence of resistances.
Afterward, the TWT price could begin a lengthier correction before eventually completing wave five to new highs.
TWT Breakout Close
Even though the TWT price has struggled to break out from the $1.60 resistance for a long time, it will likely do so soon.
The price action, wave count, and indicator readings all point to an upward movement with an initial target of $1.92.
Disclaimer:
The information provided in this article is for informational purposes only. It is not intended to be, nor should it be construed as, financial advice. We do not make any warranties regarding the completeness, reliability, or accuracy of this information. All investments involve risk, and past performance does not guarantee future results. We recommend consulting a financial advisor before making any investment decisions.
Valdrin Tahiri is a cryptocurrency analyst and reporter at CCN, specializing in technical analysis with a focus on Elliott Wave theory, on-chain metrics, and fundamental research. He brings over seven years of experience in the crypto space as both a trader and writer.
He discovered cryptocurrencies in 2017 while earning his MSc in Financial Markets at the Barcelona School of Economics, which sparked a deep interest in blockchain and market dynamics. Since then, he’s contributed to top crypto outlets like BeInCrypto and CoinGape.
Valdrin also served as Community Manager of BeInCrypto’s Telegram group for three years, helping grow it into one of the largest crypto communities worldwide. His expertise in market structure and price patterns allows him to break down complex trends into clear, actionable insights.
He’s published thousands of articles covering altcoins, Bitcoin cycles, and macro trends.