How Will XRP React to RLUSD Launch? | Credit: Hameem Sarwar
Share
Key Takeaways
XRP has fallen since its yearly high of $2.90 on Dec. 3.
Ripple’s stablecoin RLUSD will launch on Dec. 18.
Can XRP begin another upward movement to new highs?
Since November, the XRP price has been the best-performing large-cap cryptocurrency, increasing over 400%. Even though the rally has stalled since Dec. 3, XRP’s bullish structure is still intact.
Additionally, there is a buzz surrounding the launch of RLUSD on Dec. 18.
With that in mind, let’s examine the XRP price action and determine whether the short-term correction is over.
RLUSD Launch
There is positive XRP sentiment regarding the release of RLUSD tomorrow, Dec.18. RLUSD will launch on the XRP ledger and the Ethereum blockchain. Ripple CEO Brad Garlinghouse tweeted the news, announcing that it will trade in several exchanges such as Uphold, MoonPay, and Bitso and teasing launches in Bitstamp and Zerohash.
The RLUSD stablecoin is described as an enterprise-grade USD-Denominated stablecoin. Ripple has committed to publishing monthly attestations of RLUSD’s reserve assets conducted by an independent auditor.
As per the announcement, RLUSD will facilitate cross-border payments, integrate with decentralized finance (DeFi) protocols, and provide collateralization for trading tokenized real-world assets (RWA).
The XRP price has fallen slightly since its yearly high of $2.92 reached on Dec. 2. The positive sentiment around the launch could cause a rebound and lead to new highs.
XRP Price Increase
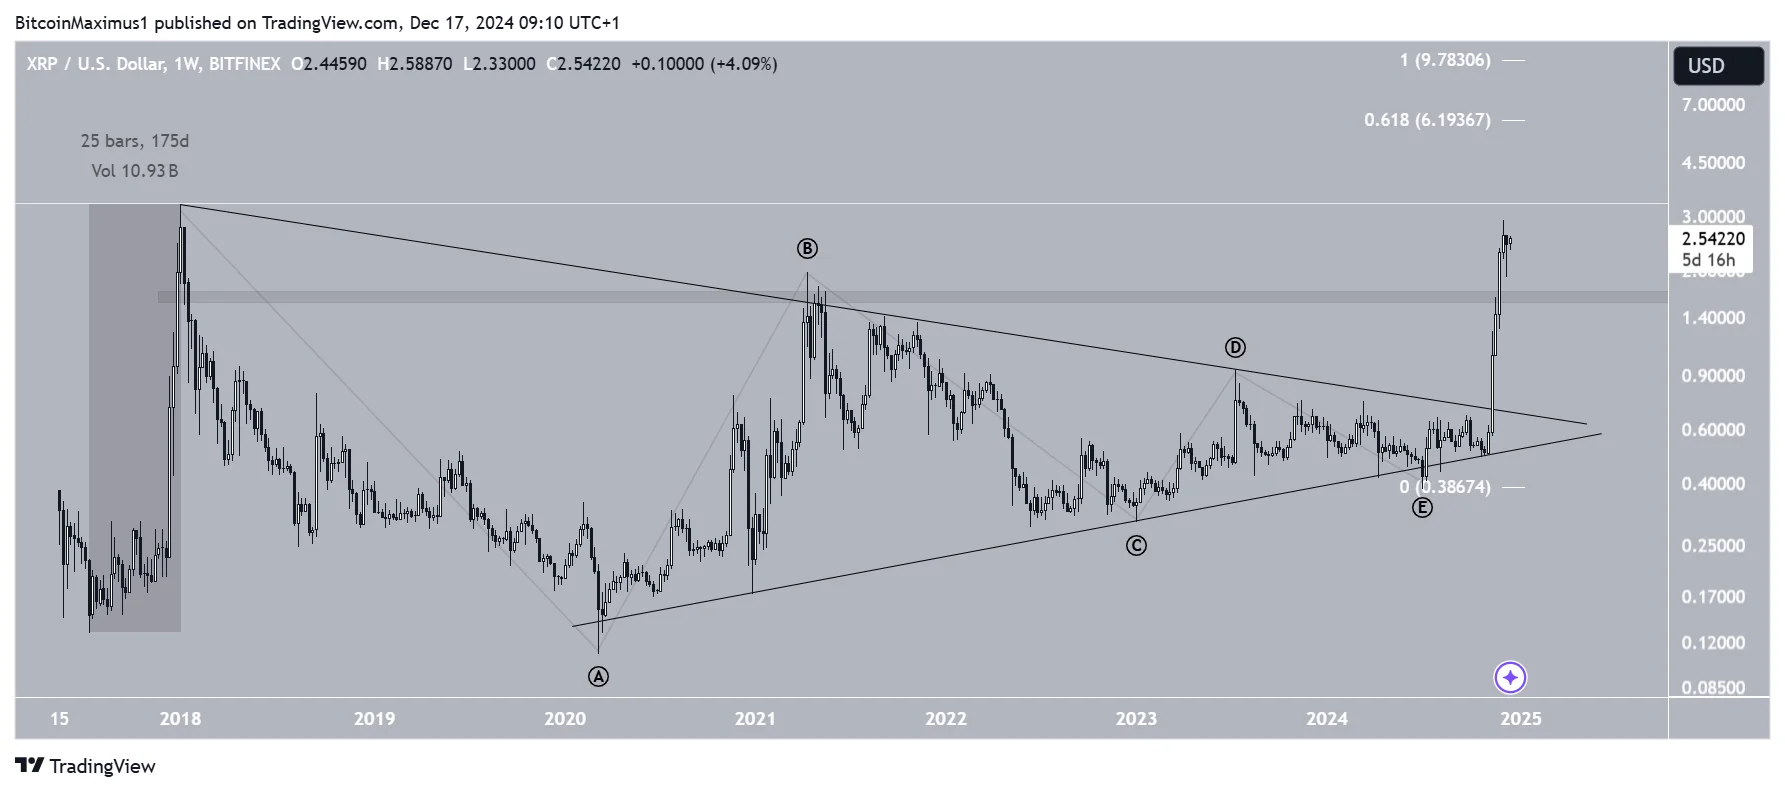
The weekly time frame chart shows that XRP has increased parabolically since breaking out from a long-term symmetrical triangle pattern. During the increase, XRP created five successive bullish weekly candlesticks, leading to a new yearly high of $2.91. The price fell slightly afterward, creating a bearish candlestick last week.
Technical indicators do not show any weakness yet since the Relative Strength Index (RSI) and Moving Average Convergence/Divergence (MACD) are increasing, and neither has generated any bearish divergence.
However, the MACD has reached a new all-time high, and the RSI is very close to doing so. These overbought levels could indicate that the upward movement will end soon.
New XRP All-Time High?
The long-term wave count (black) suggests the triangle correction ended in August 2024. If this is the case, XRP will start another upward movement, leading to the breakout.
If the increase is the same length as the previous one that led to the all-time high, the XRP price will reach a high of $9.78. A less optimistic target is $6.19, reached if the current XRP increase is 0.618 times the length of the previous one.
A likely target for the top of the increase is $3.53, created by the 1.61 external Fibonacci retracement of sub-wave four. This would be a new XRP all-time high. Afterward, the price could begin a lengthy correction as part of wave four.
New XRP Highs
The XRP price has broken out from a short-term descending parallel channel, indicating that the short-term correction is over. Anticipation regarding the RLUSD launch may have aided this breakout.
If this happens, the XRP price will reach a new all-time high. The first target for the movement’s top is $3.53.
Disclaimer:
The information provided in this article is for informational purposes only. It is not intended to be, nor should it be construed as, financial advice. We do not make any warranties regarding the completeness, reliability, or accuracy of this information. All investments involve risk, and past performance does not guarantee future results. We recommend consulting a financial advisor before making any investment decisions.
Valdrin Tahiri is a cryptocurrency analyst and reporter at CCN, specializing in technical analysis with a focus on Elliott Wave theory, on-chain metrics, and fundamental research. He brings over seven years of experience in the crypto space as both a trader and writer.
He discovered cryptocurrencies in 2017 while earning his MSc in Financial Markets at the Barcelona School of Economics, which sparked a deep interest in blockchain and market dynamics. Since then, he’s contributed to top crypto outlets like BeInCrypto and CoinGape.
Valdrin also served as Community Manager of BeInCrypto’s Telegram group for three years, helping grow it into one of the largest crypto communities worldwide. His expertise in market structure and price patterns allows him to break down complex trends into clear, actionable insights.
He’s published thousands of articles covering altcoins, Bitcoin cycles, and macro trends.