SUI price found support after a sharp downturn. Can it proceed moving upward or was its last all-time high the end of this rally?
Share
Key Takeaways
SUI peaked at $4.48, but the rally might not be over
The price is testing critical support at the 0.236 Fibonacci level ($3.79).
Declined from overbought levels, suggesting reduced bullish momentum.
SUI reached a new all-time high of $4.48 and has entered a correction phase. It retraced to key Fibonacci levels and is consolidating near $3.79, raising questions about the next major move.
Although signs of weakness were seen, the chart analysis suggests room for another higher high ahead.
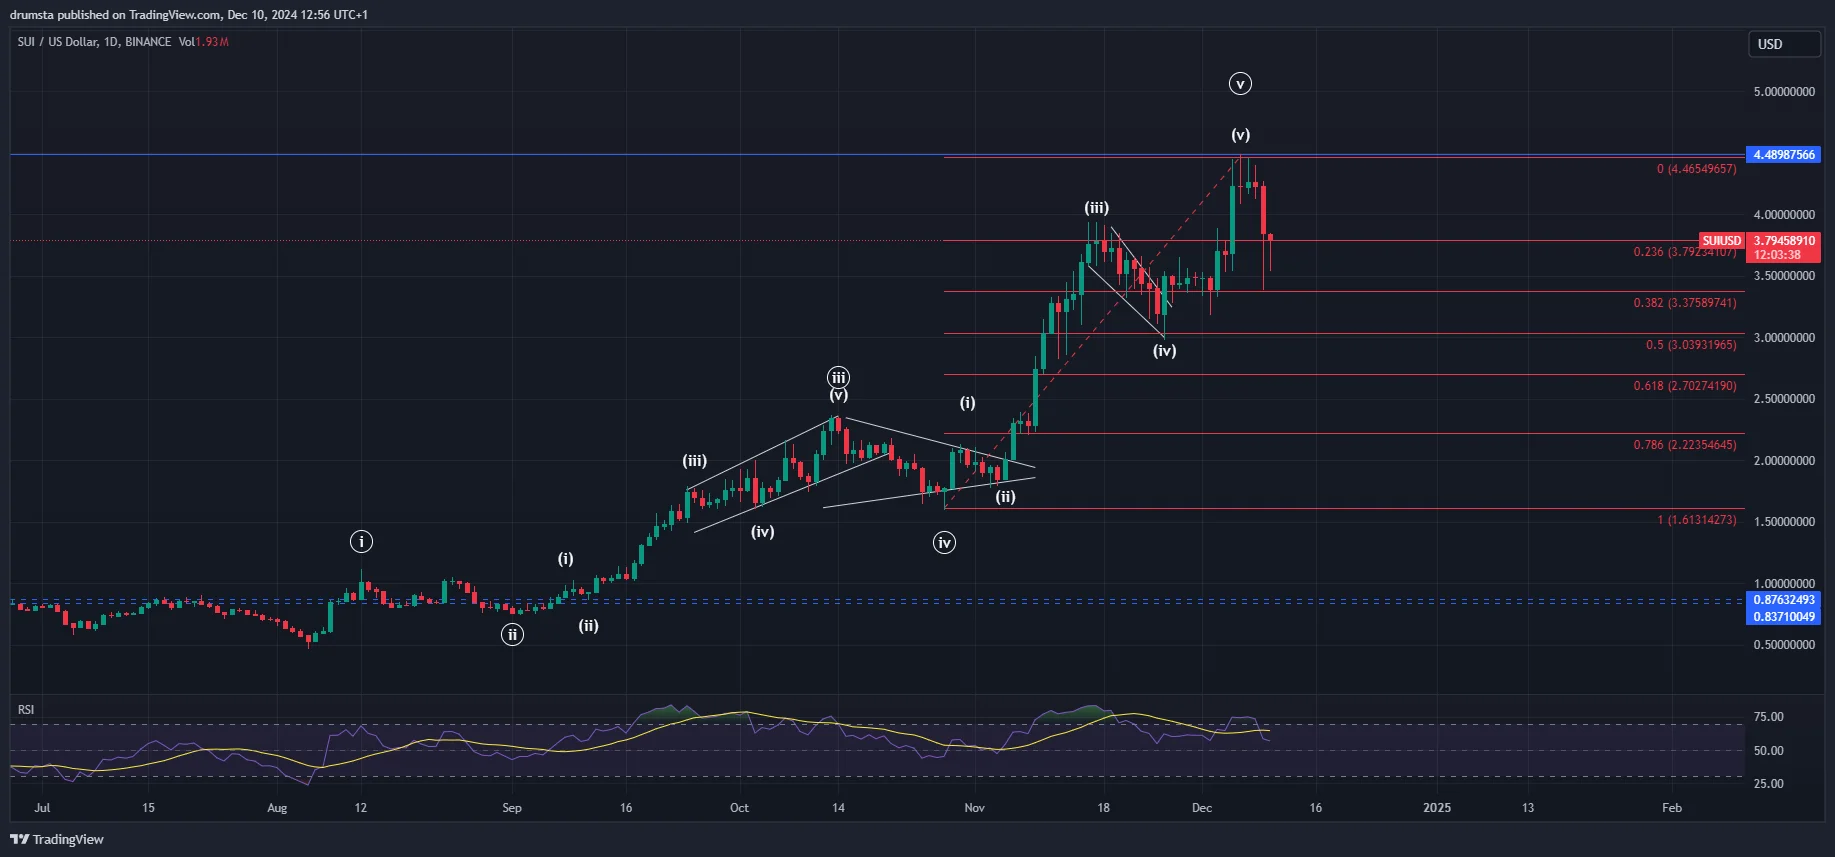
SUI has recently concluded a significant rally, with wave (v) in its Elliott Wave structure peaking at $4.48 on Dec. 6.
This rally demonstrated strong bullish momentum as the price surged through previous resistance levels, confirming a robust uptrend.
SUIUSD recovery after recent low | Credit: Nikola Lazic/TradingView
However, following this new all-time high, SUI has entered a corrective phase, retracing to test key Fibonacci levels to a low of $3.36 on Dec. 9.
Since then, it spiked back up by around 12% and is currently consolidating near the 0.236 Fibonacci retracement level at $3.79, which acts as the immediate support zone.
The Relative Strength Index (RSI) has declined from overbought levels, signaling reduced bullish momentum. This consolidation phase may continue, as corrections typically retest deeper Fibonacci levels, with $3.37 (0.382 Fib) and $3.03 (0.5 Fib) acting as critical supports.
If the price holds above the 0.382 or 0.5 Fibonacci retracement levels, SUI could stabilize and prepare for a renewed uptrend.
On the other hand, further decline could signal that the price is entering a deeper and longer corrective phase.
Key Observations
Wave (v) Completion: SUI peaked at $4.48, marking the end of its impulsive rally.
Correction developing: The price is retracing, testing the 0.236 Fibonacci level at $3.79.
RSI Cooling: RSI has declined from overbought levels, indicating a healthy correction phase.
SUI Price Prediction
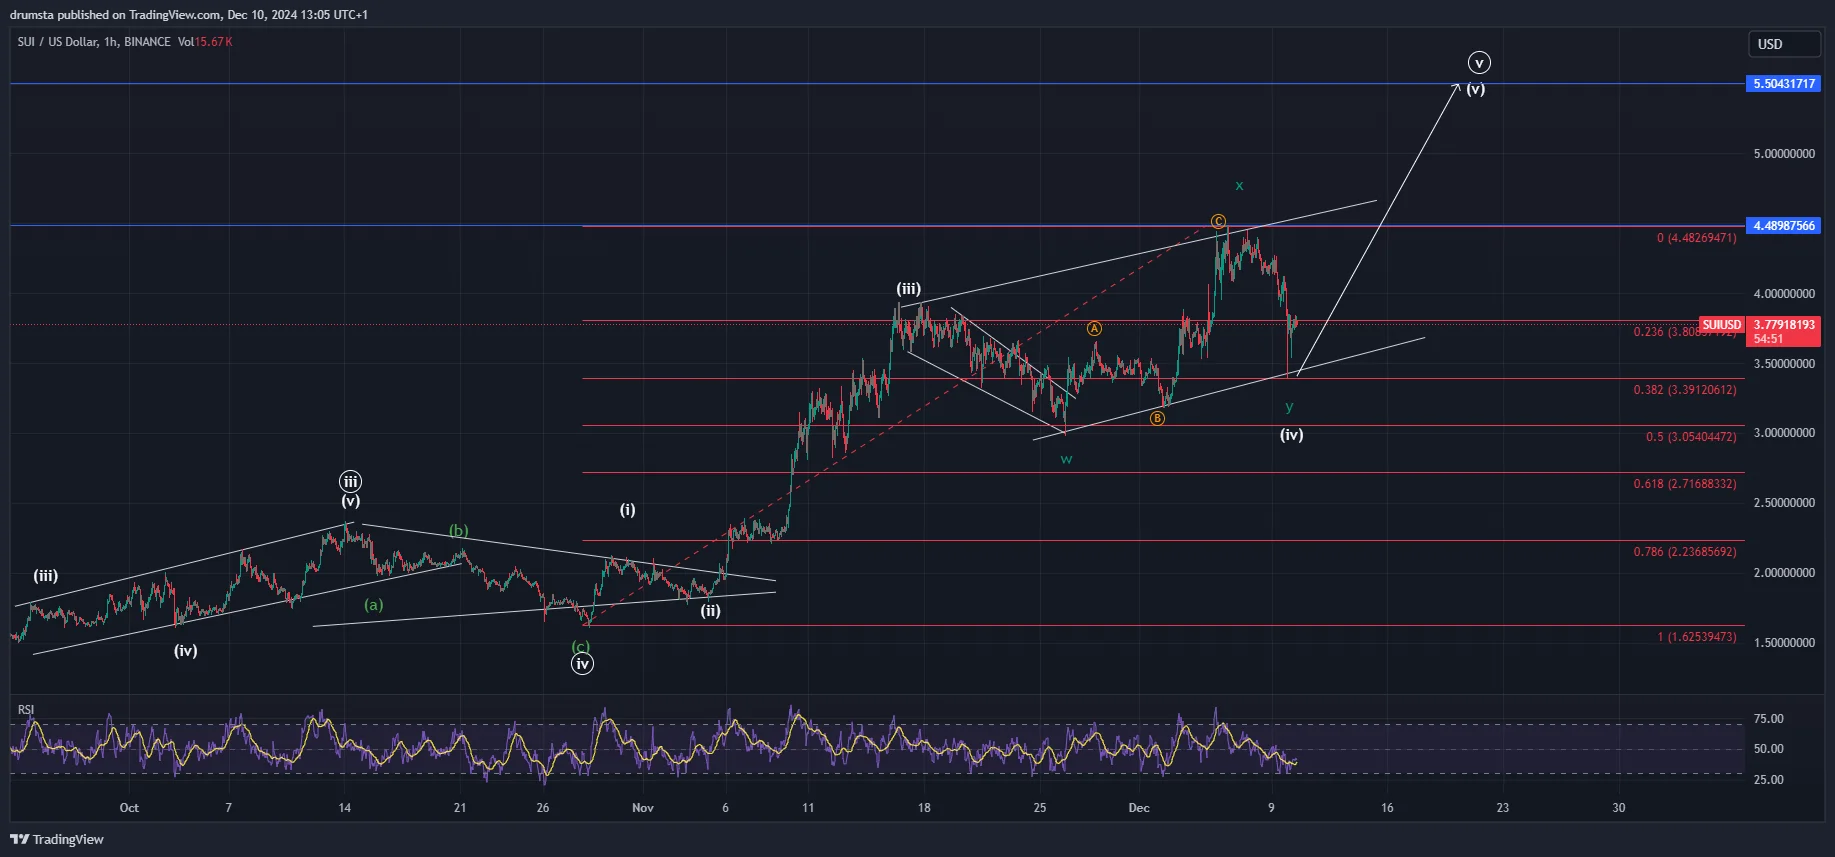
SUI’s 1-hour chart reveals that its prior high near $4 on Nov. 17 could be the completion of wave (iii), followed by a wave (iv) correction, forming a WXY structure.
This correction may have ended today at $3.40, which coincides with the 0.382 Fibonacci retracement level.
SUIUSD higher high possible | Credit: Nikola Lazic/TradingView
The ongoing correction aligns with Elliott Wave principles, where wave (iv) typically develops as a complex corrective pattern. However, the biggest factor contributing to this projection is the rise since Nov. 26 to an all-time high, showing a three-wave pattern.
The hourly RSI has cooled off significantly, indicating waning bearish momentum and a potential reversal.
If the current support holds, SUI could resume its bullish trajectory, break above $4.48, and continue toward higher Fibonacci extension levels.
If the breakout from the descending structure is confirmed, wave (v) could target $5.50 or beyond.
However, a breakdown below $3.39 (0.382 Fib) would invalidate the current wave count and could lead to deeper retracements toward $3.03 (0.5 Fib) or lower.
Key Levels to Watch
Support Levels:
$3.79 (0.236 Fibonacci): Immediate support and a pivot zone for wave (v).
$3.39 (0.382 Fibonacci): Critical support for maintaining the bullish wave structure.
$3.03 (0.5 Fibonacci): Strong support zone for potential deeper corrections.
Resistance Levels:
$4.48: Previous high and key breakout level.
$5.00: Psychological resistance and Fibonacci extension target.
$5.50: Higher extension target for wave (v).
Disclaimer:
The information provided in this article is for informational purposes only. It is not intended to be, nor should it be construed as, financial advice. We do not make any warranties regarding the completeness, reliability, or accuracy of this information. All investments involve risk, and past performance does not guarantee future results. We recommend consulting a financial advisor before making any investment decisions.
Nikola Lazic is a cryptocurrency analyst and investor working in the industry since 2017. He holds a bachelor's degree in Sociology, which enables him to better understand the psychology behind the crowd´s positioning. Consequently his preferred analytical tool is Elliott Wave Theory in combination with price action analysis.
Combining his experience in trading and investing with knowledge in content writing he strives to bring the most accurate and actionable information.