SUI regains strength as RSI and MACD confirm bullish trend | Credit: Derek Fenech
Share
Key Takeaways
After forming a falling channel post-unlock, SUI broke above resistance and the 20 EMA.
The DMI indicates that buyers are in control, while the ADX at 20.81 suggests the trend is still in its early stages.
If momentum holds, SUI’s price could target $3.93 and extend toward $4.57 or higher.
Sui (SUI) price gained after invalidating a bearish pattern, putting the asset on track to hit levels not seen in many months. The reversal comes after the recent token unlock, triggering volatility around the altcoin.
As it has happened with several SUI unlocks, the cryptocurrency is ready to end 2025 on a high note. Here is why.
SUI Smashes Resistance
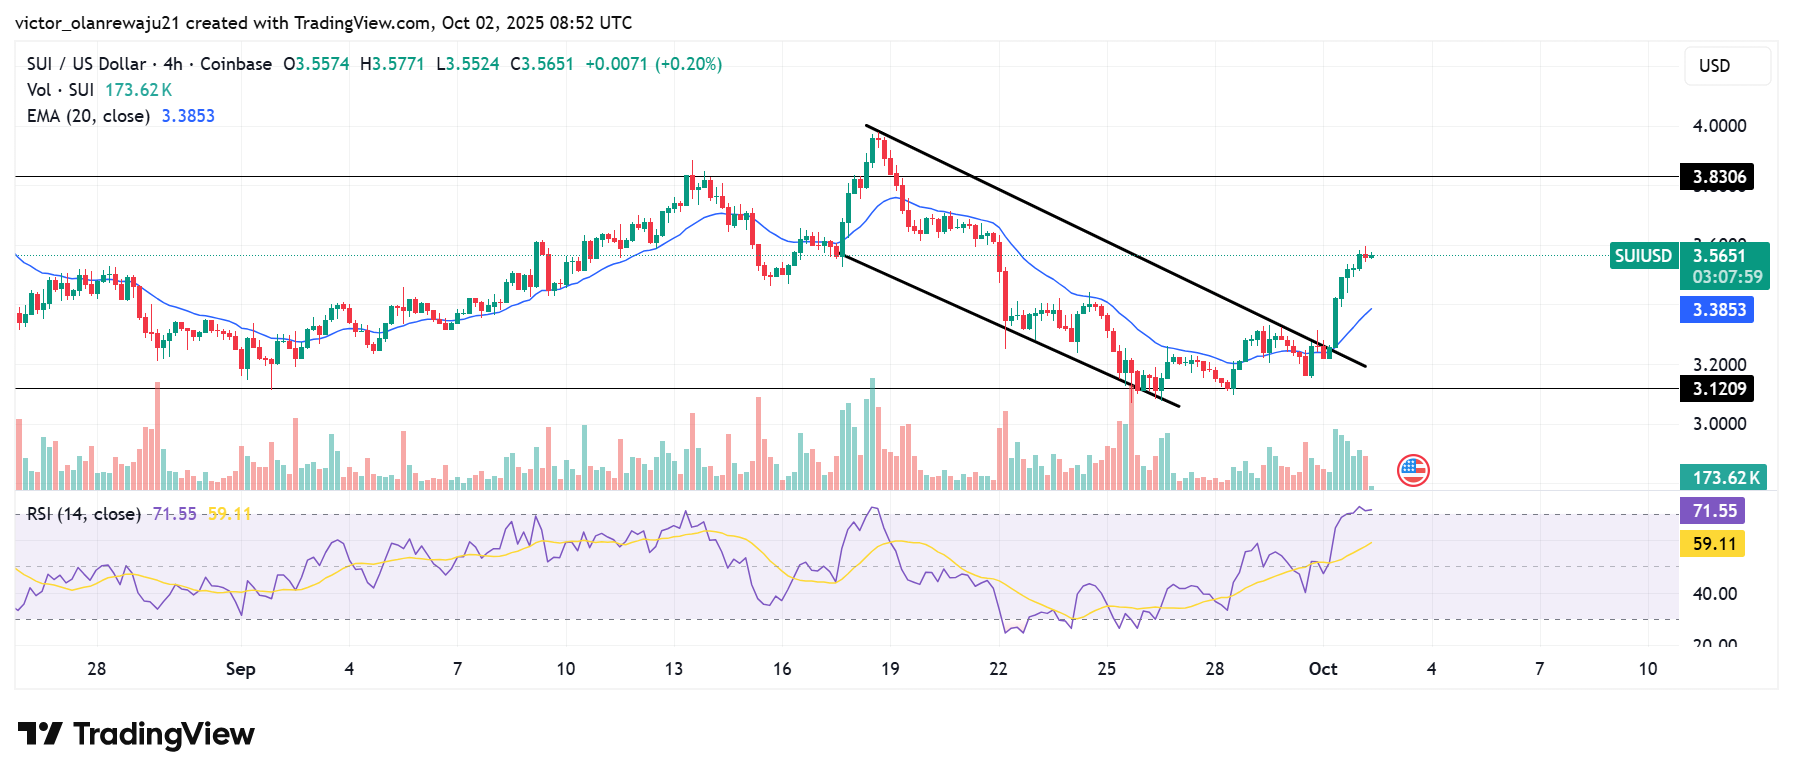
Between mid-September and Oct. 1, the SUI price printed many red candlesticks. As a result, the 4-hour chart formed a falling channel with stiff resistance and weak support.
Today, it is no longer the case. As seen below, SUI has broken above the upper trendline of the bearish pattern, indicating that bulls have overpowered the prevailing sellers’ dominance.
Get These Top Crypto Casino Offers Now!
Sponsored
Disclosure
We sometimes use affiliate links in our content, when clicking on those we might receive a commission at no extra cost to you. By using this website you agree to our terms and conditions and privacy policy.
Following the move, the Relative Strength Index (RSI) surged. The RSI reading indicates rising bullish momentum, which is likely to drive the cryptocurrency’s value above the overhead resistance points.
Additionally, the recent breakout has ensured that SUI’s price has broken above the 20-period Exponential Moving Average (EMA). Since SUI is above the 20 EMA (blue), it implies that the altcoin has strong support for keeping the price trending upward.
If this trend continues, the cryptocurrency may climb toward the resistance level at $3.83.
Momentum Bullish
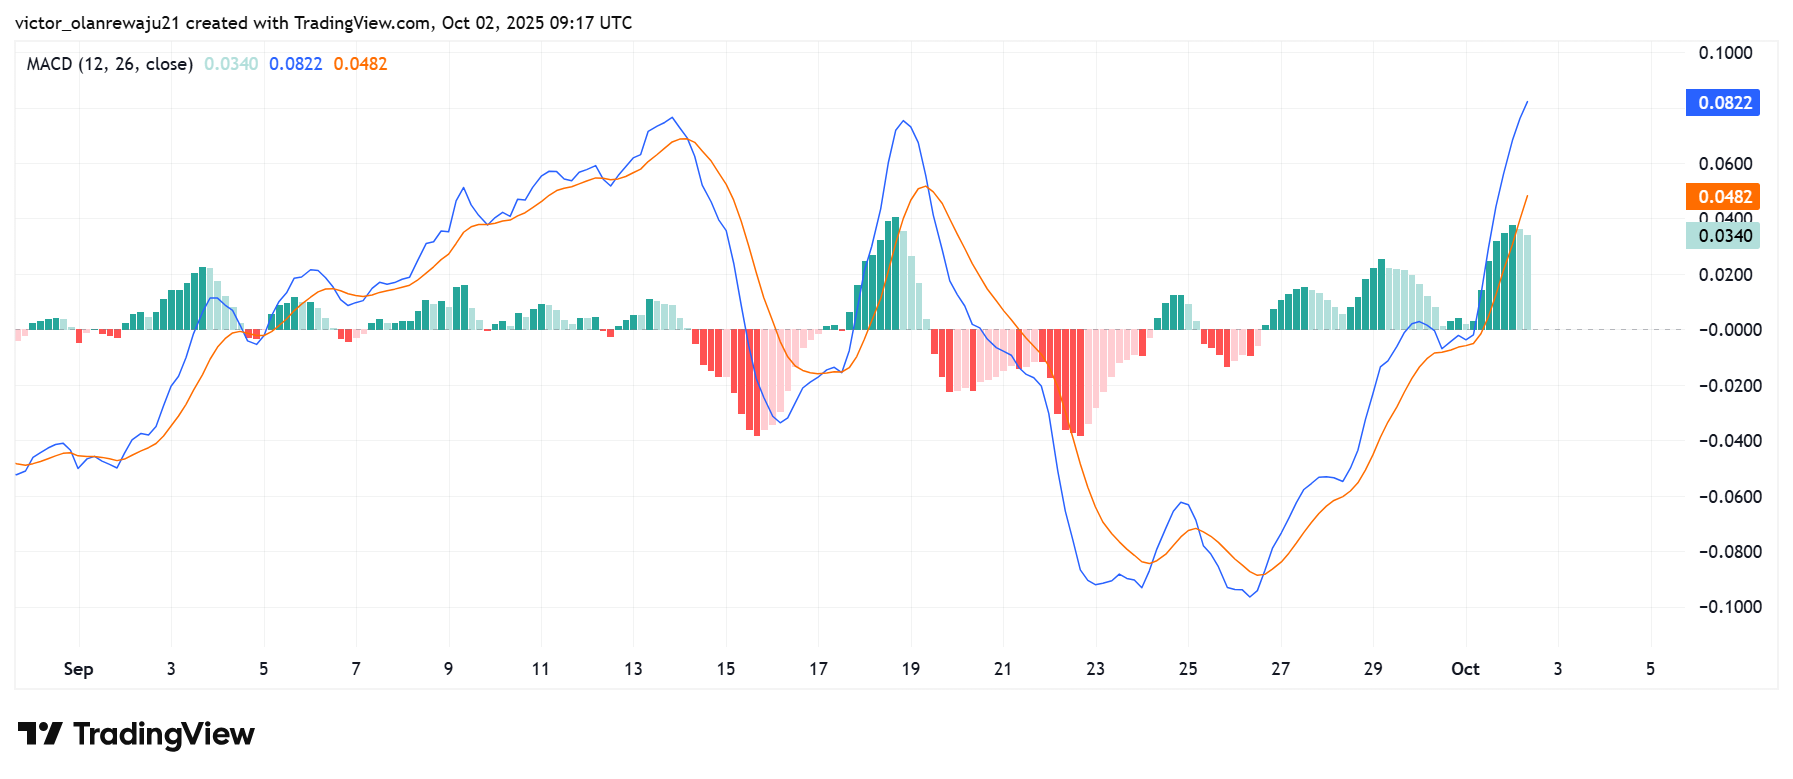
At the same time, the Moving Average Convergence Divergence (MACD) flashed a bullish crossover, further strengthening SUI’s outlook.
This shift occurred as the 12-day EMA (blue) crossed above the 26-day EMA (orange), a classic signal that momentum favors buyers.
Additionally, the MACD histogram has turned positive, indicating that bullish momentum is gaining traction. This aligns with the earlier RSI rebound, pointing to growing buying pressure.
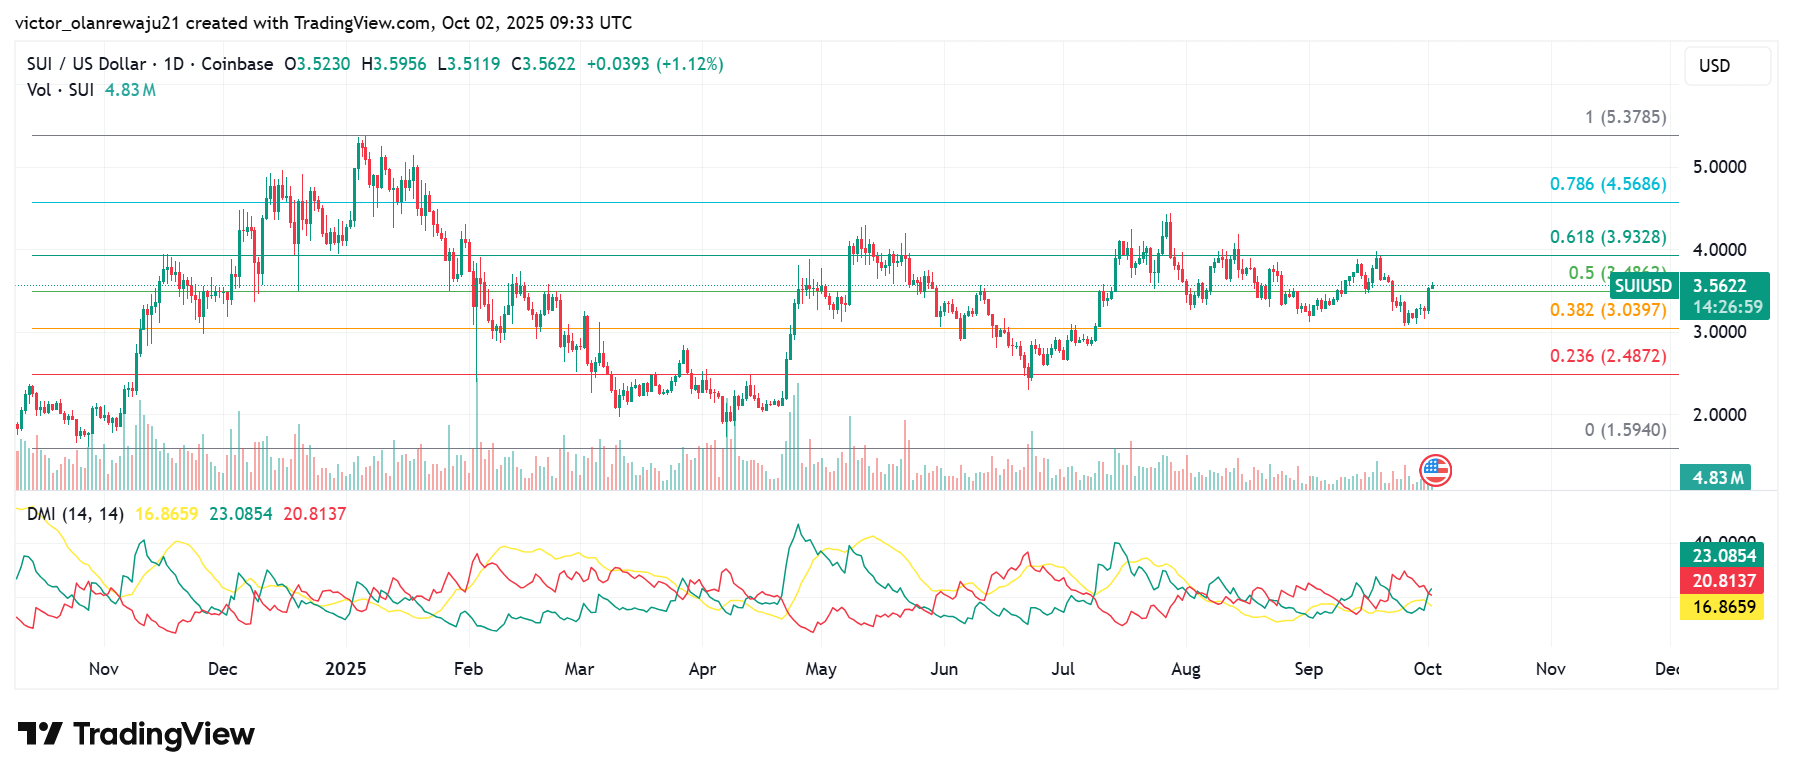
Examining the daily chart, CCN analyzed the Directional Movement Index (DMI), which provides key insights into SUI’s trend strength.
At press time, the +DMI (green) is 23.08, while the –DMI (red) sits at 16.87. This gap shows buyers have the upper hand, as bullish strength outweighs selling pressure.
Meanwhile, in yellow, the Average Directional Index (ADX) reads 20.81. The ADX measures the strength of the prevailing trend.
Values below 20 typically signal a weak or consolidating market, while rising readings above 25 confirm a strengthening trend.
The ADX climbing toward that threshold suggests SUI may be in the early stages of a bullish trend. If the ADX continues to rise alongside a dominant +DMI, it could attract more buyers and push SUI’s price toward higher resistance levels.
If this setup holds, SUI’s price might breach the resistance at $3.93. Once that happens, the next level the coin could reach is $4.57.
It might rise to $5.34 in a highly bullish case, marking a new all-time high. However, if demand fails to intensify, this might not happen, meaning SUI’s price might decline to $3.03.
Disclaimer:
The information provided in this article is for informational purposes only. It is not intended to be, nor should it be construed as, financial advice. We do not make any warranties regarding the completeness, reliability, or accuracy of this information. All investments involve risk, and past performance does not guarantee future results. We recommend consulting a financial advisor before making any investment decisions.
Victor Olanrewaju is a crypto analyst and reporter at CCN with deep roots in on-chain research and technical analysis. His crypto journey began in 2017, but it was the 2020 Uniswap airdrop that sparked a full-time pivot into the space.
With a foundation in copywriting, Victor honed his craft creating high-converting content for leading crypto brokers — most notably an XRP price prediction that ranked #1 on Google during the 2021 bull run.
He later joined AMBCrypto in 2022, where he combined storytelling with technical and on-chain analysis to cover key market narratives.
In 2024, he expanded his expertise at BeInCrypto, collaborating with analysts and using tools like Glassnode, Santiment, and IntoTheBlock to break down Bitcoin and altcoin trends.
At CCN, Victor covers the top cryptocurrencies, memecoins, macro shifts, blending real-time insights with deep-dive metrics.
He holds a Bachelor’s degree in Physics from the University of Ibadan, equipping him to simplify complex data for a wide audience. Follow his work or connect on LinkedIn or X.