How Long Will the SUI Price Increase Continue? | Credit: Hameem Sarwar
Share
Key Takeaways
SUI reached an all-time high of $4.98 on Dec. 16.
The price has increased by over 500% in 2024.
How long will SUI’s bullish trend continue?
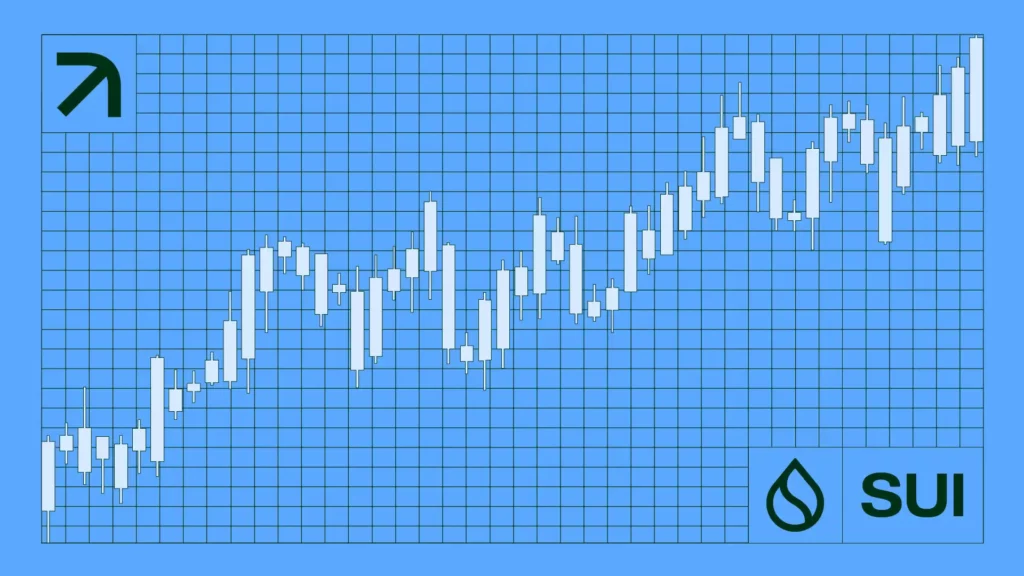
The SUI price has increased rapidly since the beginning of the year. After a correction from March to August, SUI started another upward movement and has continuously made new all-time highs since October.
More recently, SUI reached a high of $4.98 on Dec. 16. SUI’s Total Value Locked (TVL) and volume mirrors the price increase, confirming it is backed by on-chain activity.
With that in mind, let’s look at the SUI price action in different time frames to determine how long the upward movement will continue.
The weekly time frame chart shows that SUI has increased by 520% since the start of the year. The rally accelerated in November after SUI broke out from the previous all-time high and validated it as support (white icon).
The second portion of the upward movement follows a parabolic ascending support trend line (white), which, while unsustainable in the long term, can lead to considerable gains in the short term.
More recently, SUI bounced at the trend line (black circle) last week, creating a long lower wick. The trend line is at $4.10, and the bullish trend remains intact as long as the parabolic trend line remains in place.
Technical indicators show overbought conditions but no apparent weakness. The Relative Strength Index (RSI) and Moving Average Convergence/Divergence (MACD) are increasing, and neither has generated any bearish divergence.
Nevertheless, since the price is at an all-time high, looking at the wave count can help determine the next targets for a possible top.
Wave three is 1.61 times the length of wave one, so it may be nearing its end. If there is another extension, the next most likely target will be $6.66.
Unlike the weekly time frame, a bearish divergence (green) is developing in the 3-day one, a sign that the upward movement may end soon.
If that happens, the SUI price could begin wave four, possibly returning to validate the channel’s resistance near $2.20 as support.
The short-term count aligns with this possibility. The sub-wave count shows a completed five-wave upward movement that creates wave three.
Sub-wave five developed into an ending diagonal, as evidenced by the ascending wedge pattern. This further reiterates the possibility that the upward movement is over.
Similarly to the daily time frame, the RSI has generated a bearish divergence. If so, the SUI price could correct toward the 0.5-0.618 Fibonacci retracement support region at $2.18 – $2.71, completing wave four.
SUI Cools Off
The SUI price increase in 2024 has been impressive, to say the least. While the price continuously makes new highs, the wave count, price action, and indicator readings suggest that SUI will reach its top soon.
As a result, the price could correct in the short term before the upward movement resumes sometime in 2025.
Disclaimer:
The information provided in this article is for informational purposes only. It is not intended to be, nor should it be construed as, financial advice. We do not make any warranties regarding the completeness, reliability, or accuracy of this information. All investments involve risk, and past performance does not guarantee future results. We recommend consulting a financial advisor before making any investment decisions.
Valdrin Tahiri is a cryptocurrency analyst and reporter at CCN, specializing in technical analysis with a focus on Elliott Wave theory, on-chain metrics, and fundamental research. He brings over seven years of experience in the crypto space as both a trader and writer.
He discovered cryptocurrencies in 2017 while earning his MSc in Financial Markets at the Barcelona School of Economics, which sparked a deep interest in blockchain and market dynamics. Since then, he’s contributed to top crypto outlets like BeInCrypto and CoinGape.
Valdrin also served as Community Manager of BeInCrypto’s Telegram group for three years, helping grow it into one of the largest crypto communities worldwide. His expertise in market structure and price patterns allows him to break down complex trends into clear, actionable insights.
He’s published thousands of articles covering altcoins, Bitcoin cycles, and macro trends.