What's The WLD Trend's Direction? | Credit: Hameem Sarwar
Share
Key Takeaways
Worldcoin (WLD) trades in a range between $2.50 and $4.30.
The Worldcoin price has nearly returned to the range low.
Will WLD break out or fall from this horizontal range?
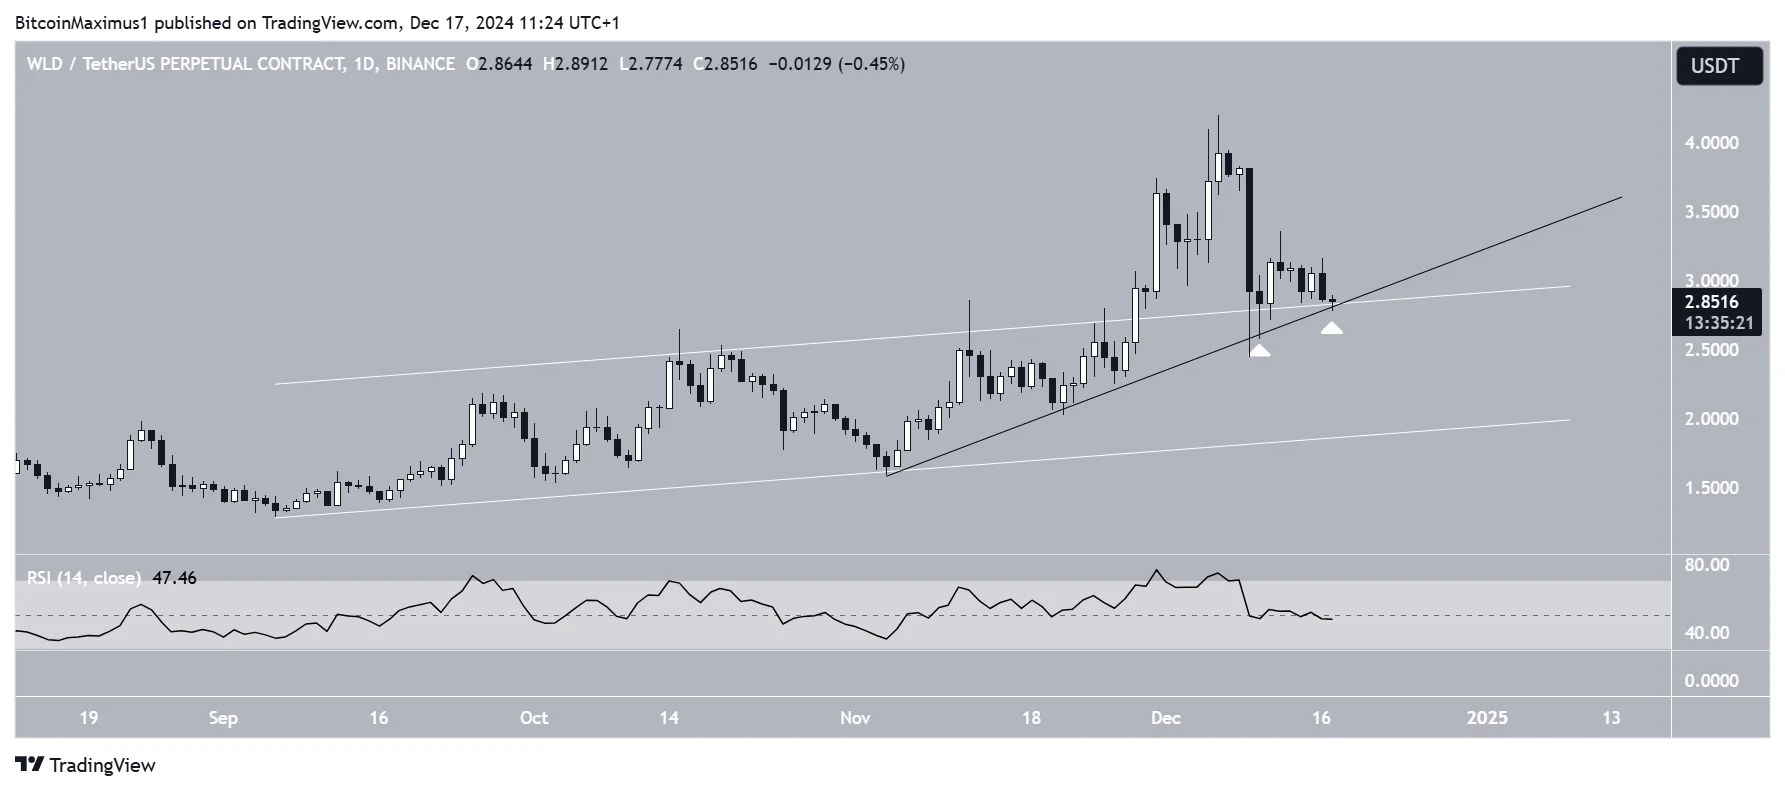
Worldcoin (WLD) has increased since August, breaking from a long-term descending parallel channel. The upward movement culminated with a high of $4.20 in December, an increase of 230% since the August lows.
Even though the price has fallen since it retested and validated the previous horizontal resistance as support.
Will WLD begin an upward movement after this retest, or will it fail to do so, invalidating the previous breakout? Let’s find out.
The weekly time frame chart shows that WLD has increased since breaking out from a descending parallel channel in September. The channel had previously existed since the all-time high and contained the entire correction. Therefore, the WLD price has likely ended its correction with the breakout.
This view was reiterated when WLD closed above the $2.50 horizontal resistance, a key level since launch. Last week, the WLD price was returned to validate it as support and create a long lower wick (white icon).
During this increase, the WLD price was rejected by the $4.30 horizontal resistance area, creating a range between $2.50 and $4.30.
Technical indicators support the upward movement. Both the Relative Strength Index (RSI) and Moving Average Convergence/Divergence (MACD) generated bullish divergences (green) before the breakout. The indicators are now increasing. The RSI has already moved above 50, while the MACD is close to moving above 0.
Therefore, the weekly time frame chart suggests WLD will eventually break out from this range. If that happens, the next resistance will be at $8.50, near the all-time high of $11.96.
Additionally, WLD follows a shorter-term, steeper ascending support trend line, which aligns with the channel’s resistance trend line. The daily RSI is also at 50, reaching the trend line from above.
As a result, the current level is critical for the future WLD trend. If WLD bounces, it will validate several support levels and confirm the correction is over.
However, a breakdown could trigger a significant decline toward the long-term support at $2.
Future Trend Unclear
While the weekly time frame of the WLD chart is bullish, the daily one is still unclear.
Whether the Worldcoin price bounces or breaks down from the current support level near $2.50-$2.80 can determine the direction of the future trend.
A bounce can catalyze an upward movement toward the range high of $4.30 and a possible breakout, while a breakdown could trigger a drop to $2.
Disclaimer:
The information provided in this article is for informational purposes only. It is not intended to be, nor should it be construed as, financial advice. We do not make any warranties regarding the completeness, reliability, or accuracy of this information. All investments involve risk, and past performance does not guarantee future results. We recommend consulting a financial advisor before making any investment decisions.
Valdrin Tahiri is a cryptocurrency analyst and reporter at CCN, specializing in technical analysis with a focus on Elliott Wave theory, on-chain metrics, and fundamental research. He brings over seven years of experience in the crypto space as both a trader and writer.
He discovered cryptocurrencies in 2017 while earning his MSc in Financial Markets at the Barcelona School of Economics, which sparked a deep interest in blockchain and market dynamics. Since then, he’s contributed to top crypto outlets like BeInCrypto and CoinGape.
Valdrin also served as Community Manager of BeInCrypto’s Telegram group for three years, helping grow it into one of the largest crypto communities worldwide. His expertise in market structure and price patterns allows him to break down complex trends into clear, actionable insights.
He’s published thousands of articles covering altcoins, Bitcoin cycles, and macro trends.