mXRP Explained: XRP’s First Liquid Staking Token That Pays Up to 8%.
Share
Key Takeaways
The XRP price is less than 15% away from its all-time high.
XRP is likely in the fifth and final wave of its upward movement.
Will XRP reach a new all-time high this cycle, and if so, when?
XRP is now trading less than 15% below its all-time high, and the charts hint it could be gearing up for one last big push.
While there’s some bullish buzz, including optimism around a potential BlackRock XRP ETF, this rally isn’t being fueled primarily by headlines. Instead, it’s riding the broader market trend.
Price action suggests we may be in the fifth and final wave of the move, with momentum still firmly in the bulls’ favor.
The big question now: just how high can XRP climb before this run loses steam?
XRP Technical Analysis
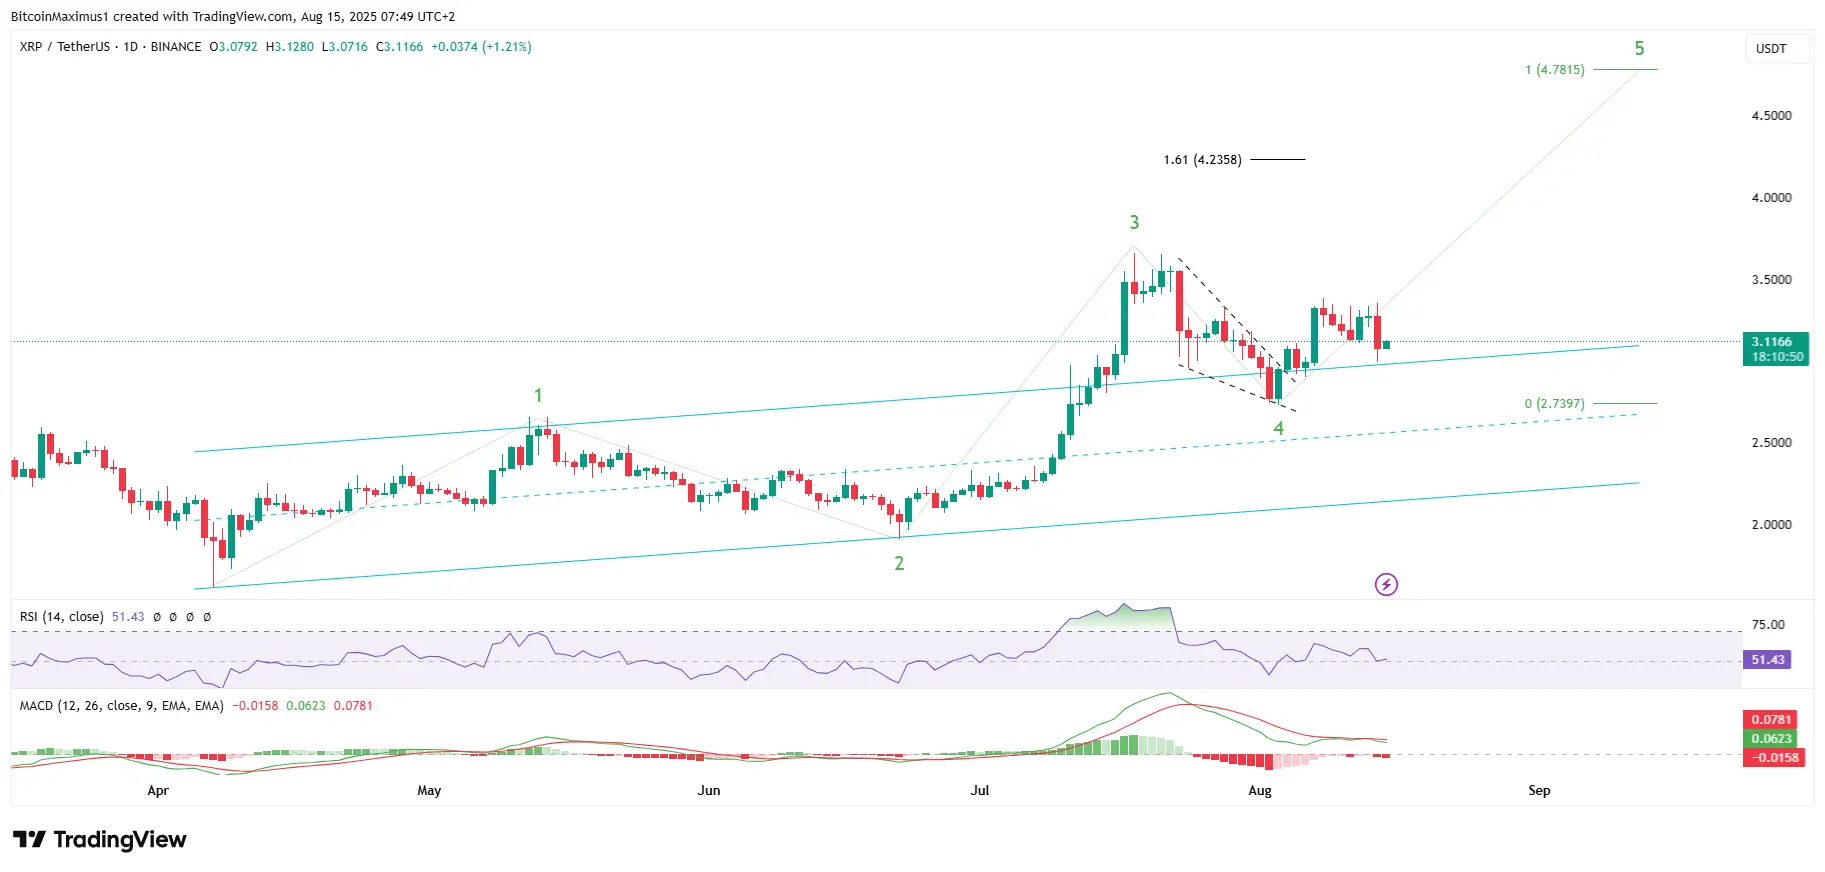
XRP began its bullish trend reversal on April 7, creating a higher low on June 22.
While the increase until then was gradual, XRP accelerated afterward, hitting a new all-time high of $3.66 on July 18.
Try Our Recommended Crypto Exchanges
Sponsored
Disclosure
We sometimes use affiliate links in our content, when clicking on those we might receive a commission at no extra cost to you. By using this website you agree to our terms and conditions and privacy policy.
XRP confirmed its bullish trend by breaking out from an ascending parallel channel and briefly returning inside it on Aug. 3.
This movement is called a fourth-wave pullback, and signals that the trend’s fifth and final wave has begun.
Shortly after bouncing, XRP broke out from a descending wedge, and the price is attempting to regain its footing today.
If successful, the next likely area for a top is between $4.23 and $4.77.
The 1.61 external Fibonacci retracement of wave four creates the lower range, while the upper range is created by giving wave five the same length as waves one and three combined.
If the indicator follows previous history, the XRP price will reach another high before eventually correcting, as predicted by the price action.
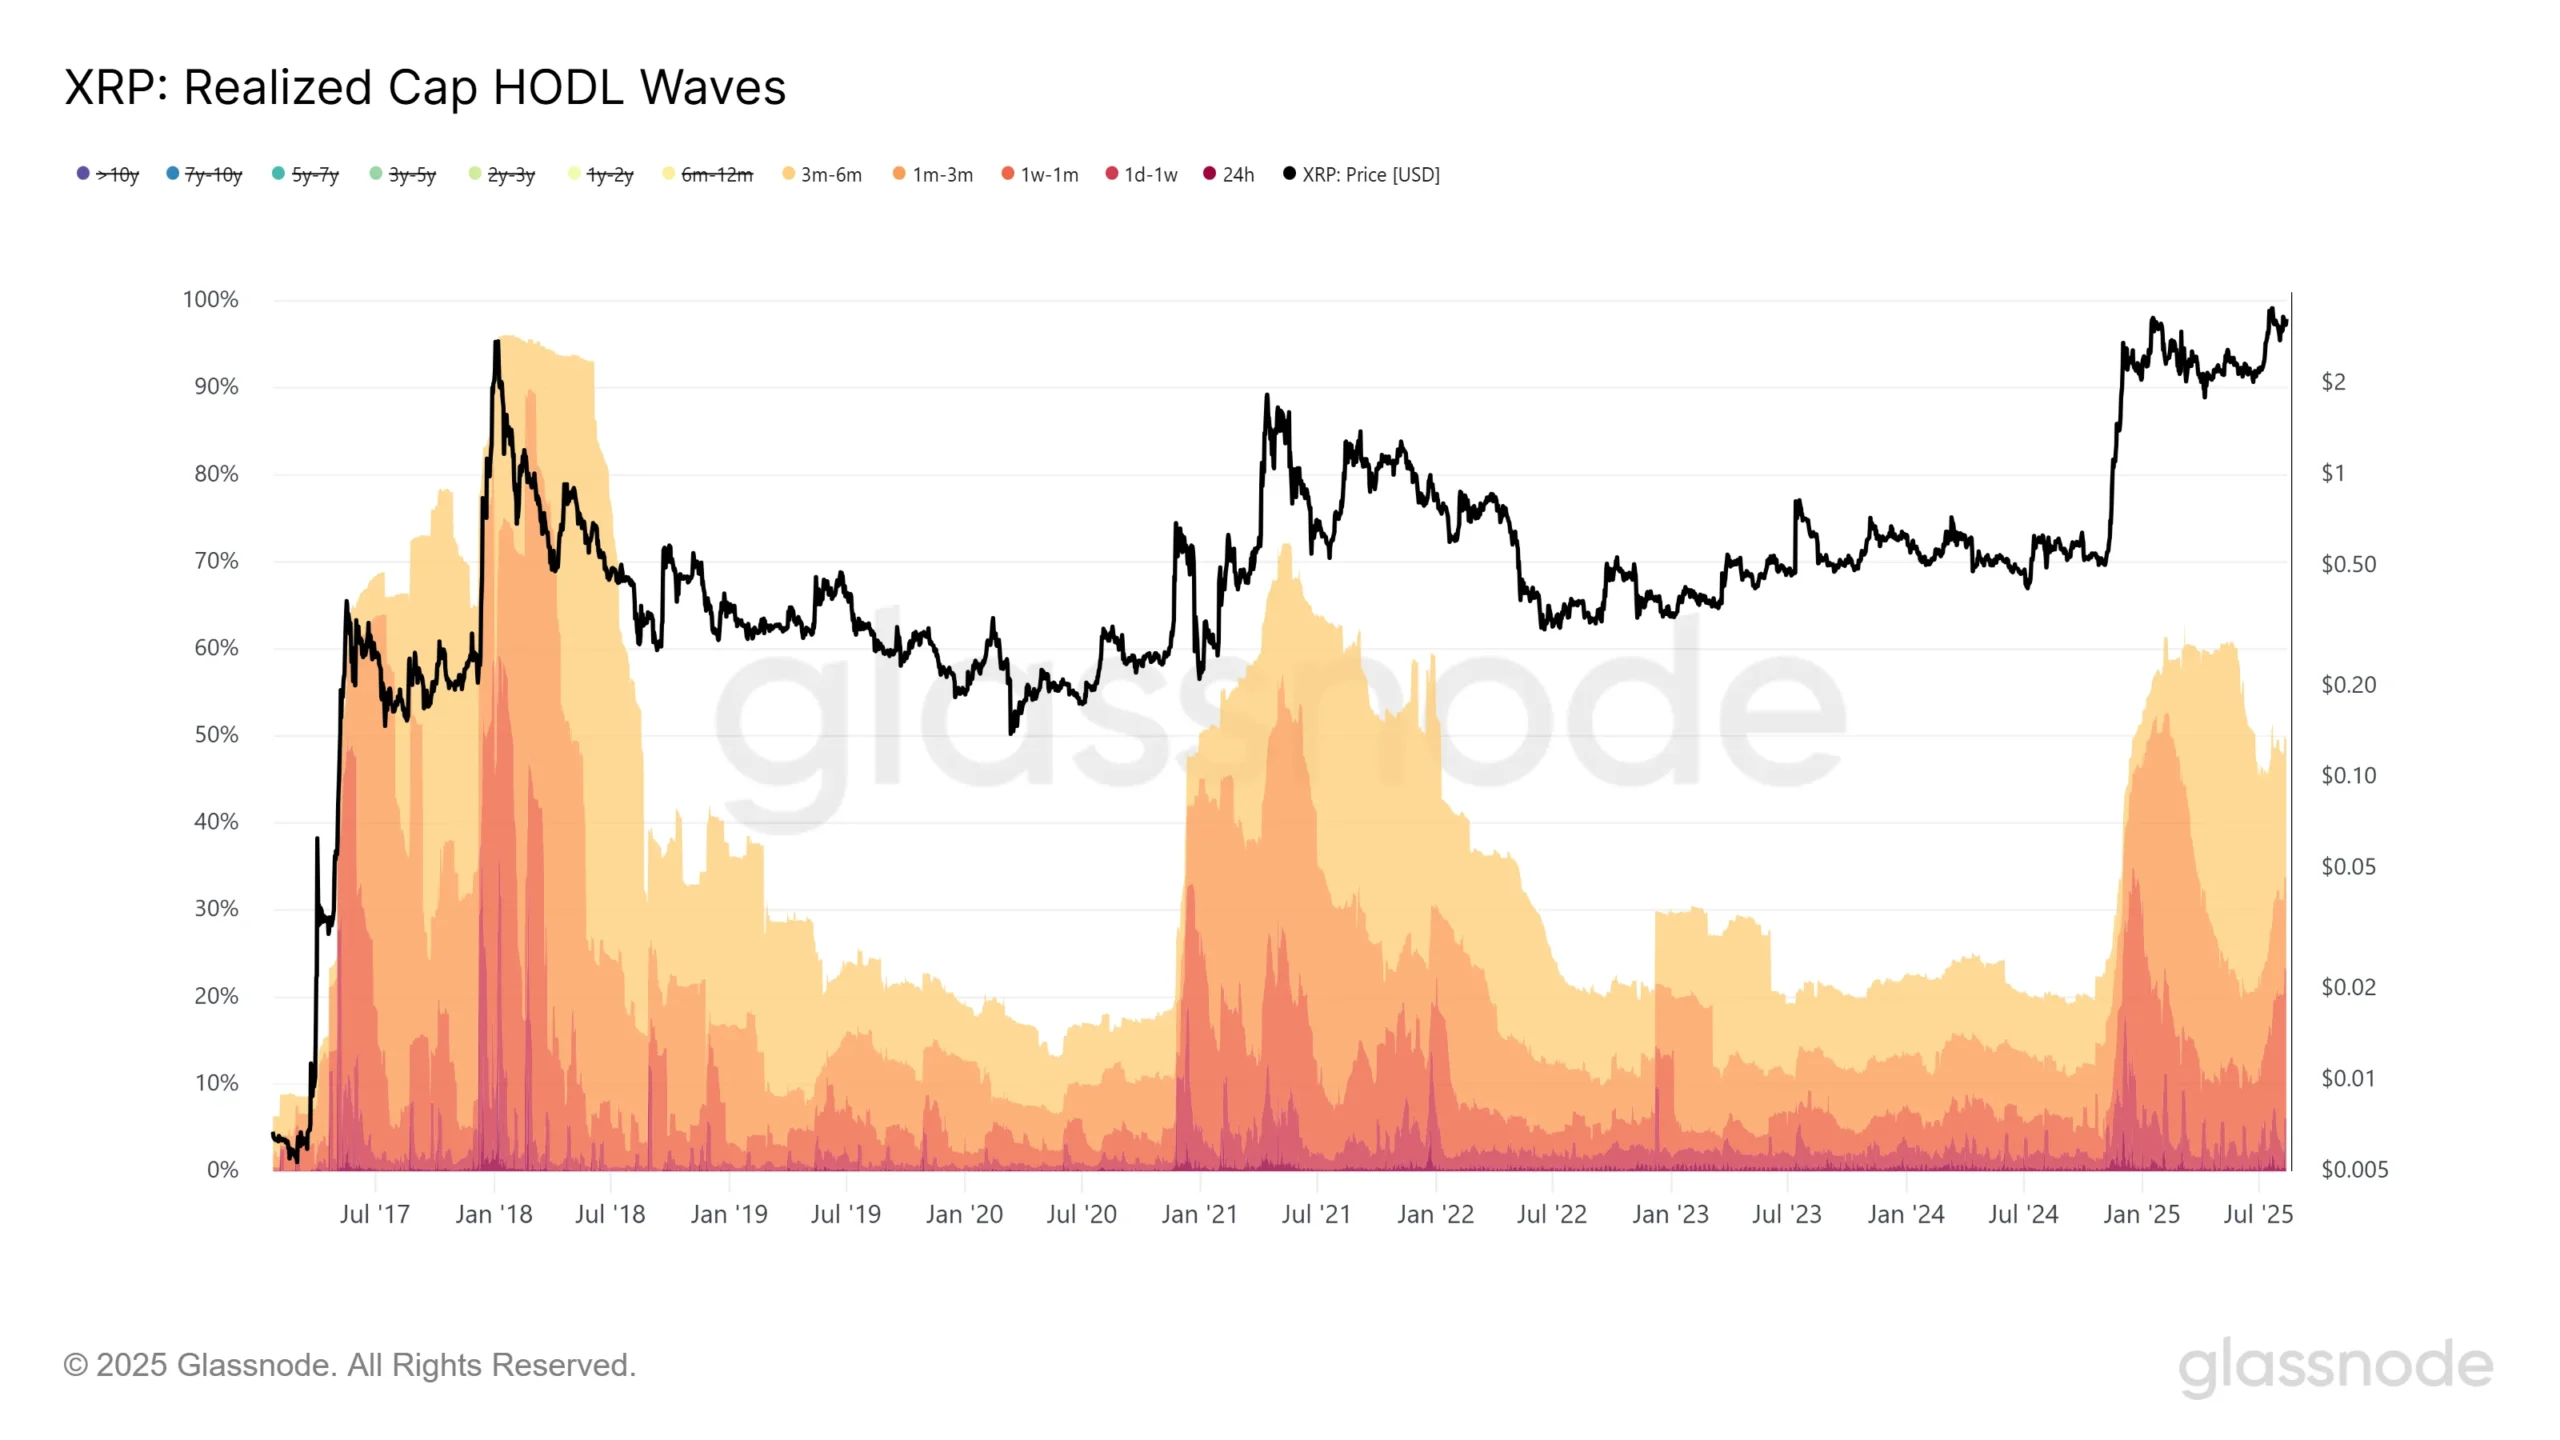
The Realized Cap HODL Wave states the same thing. The indicator uses different colored bands to show whether short- or long-term buyers dominate trading.
Historically, periods when short-term holders (<6 months) have more than 50% of the trading activity have coincided with market cycle tops.
Currently, the HODL waves are at 50% and growing. If the next push is driven by short-term holders, as is often the case, the indicator could cross into the danger threshold at 70%.
So, the technical and on-chain analysis for XRP agrees: The price will reach a new all-time high, but that will be the final rally this cycle.
XRP All-Time High
If XRP can break above $3.40, the next stop could be between $4.23 and $4.78, setting a new all-time high.
However, with on-chain data showing signs of a market top, this rally might be the last leg before a correction.
The next few weeks will be crucial in deciding whether XRP can finish this cycle on a high.
Disclaimer:
The information provided in this article is for informational purposes only. It is not intended to be, nor should it be construed as, financial advice. We do not make any warranties regarding the completeness, reliability, or accuracy of this information. All investments involve risk, and past performance does not guarantee future results. We recommend consulting a financial advisor before making any investment decisions.
Valdrin Tahiri is a cryptocurrency analyst and reporter at CCN, specializing in technical analysis with a focus on Elliott Wave theory, on-chain metrics, and fundamental research. He brings over seven years of experience in the crypto space as both a trader and writer.
He discovered cryptocurrencies in 2017 while earning his MSc in Financial Markets at the Barcelona School of Economics, which sparked a deep interest in blockchain and market dynamics. Since then, he’s contributed to top crypto outlets like BeInCrypto and CoinGape.
Valdrin also served as Community Manager of BeInCrypto’s Telegram group for three years, helping grow it into one of the largest crypto communities worldwide. His expertise in market structure and price patterns allows him to break down complex trends into clear, actionable insights.
He’s published thousands of articles covering altcoins, Bitcoin cycles, and macro trends.