The Avalanche (AVAX) price attempts to create a bullish engulfing candlestick.
AVAX has traded inside a corrective pattern since its cycle high in March 2024.
Has AVAX finally started the upward movement that will lead to a breakout?
The crypto market pulled back yesterday, and Avalanche (AVAX) was no exception, sliding nearly 10%.
But while Bitcoin (BTC) recovered today, it’s AVAX that’s stealing the spotlight, jumping 6% and once again making a run at the $26 resistance level for the fifth time.
Let’s dive into the charts to see if this could finally be the breakout.
AVAX Price Bounces
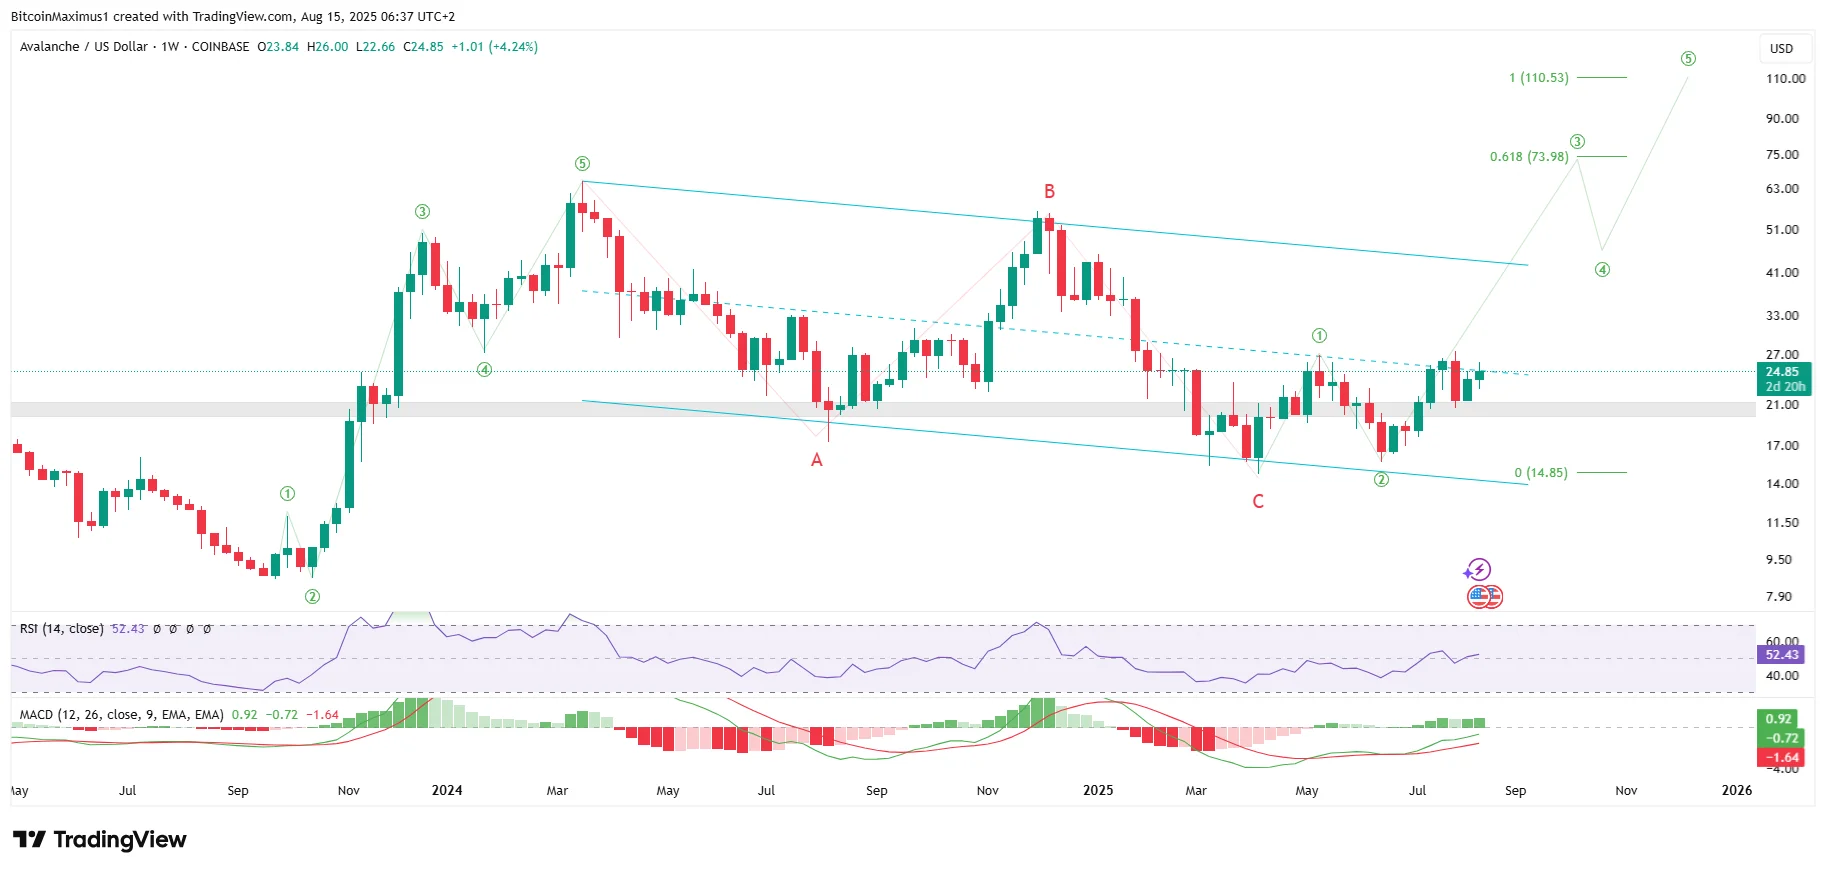
The weekly chart shows that since hitting its cycle high in March 2024, AVAX has declined inside a descending parallel channel.
In April, AVAX bounced at the channel’s support trend line (green icon), and after some choppiness, it created a higher low and reclaimed the $20 horizontal area.
Try Our Recommended Crypto Exchanges
Sponsored
Disclosure
We sometimes use affiliate links in our content, when clicking on those we might receive a commission at no extra cost to you. By using this website you agree to our terms and conditions and privacy policy.
Reclaiming $20 was the first step in creating a bullish structure, and the final confirmation will be breaking out from the channel’s midline, which is what the AVAX price is attempting to do today.
The wave count suggests a breakout is imminent. It shows a completed A-B-C correction (red), hinting that expansion is right around the corner.
According to the count, the AVAX price is in wave three of a new five-wave upward movement, which is usually the most rapid portion of the ascent.
The two main targets are $74 and $110, making the current increase 0.618 and 1 times as long as the previous one.
But first, the bulls must clear one crucial hurdle: the channel’s midline at $26.
Momentum indicators already show promise. The Relative Strength Index (RSI) crossed 50, and the Moving Average Convergence/Divergence (MACD) is almost positive.
Because of these charts, the AVAX price prediction for the rest of 2025 is bullish. Let’s analyze the short-term movement to see if the bottom is in.
Parabola Ahead
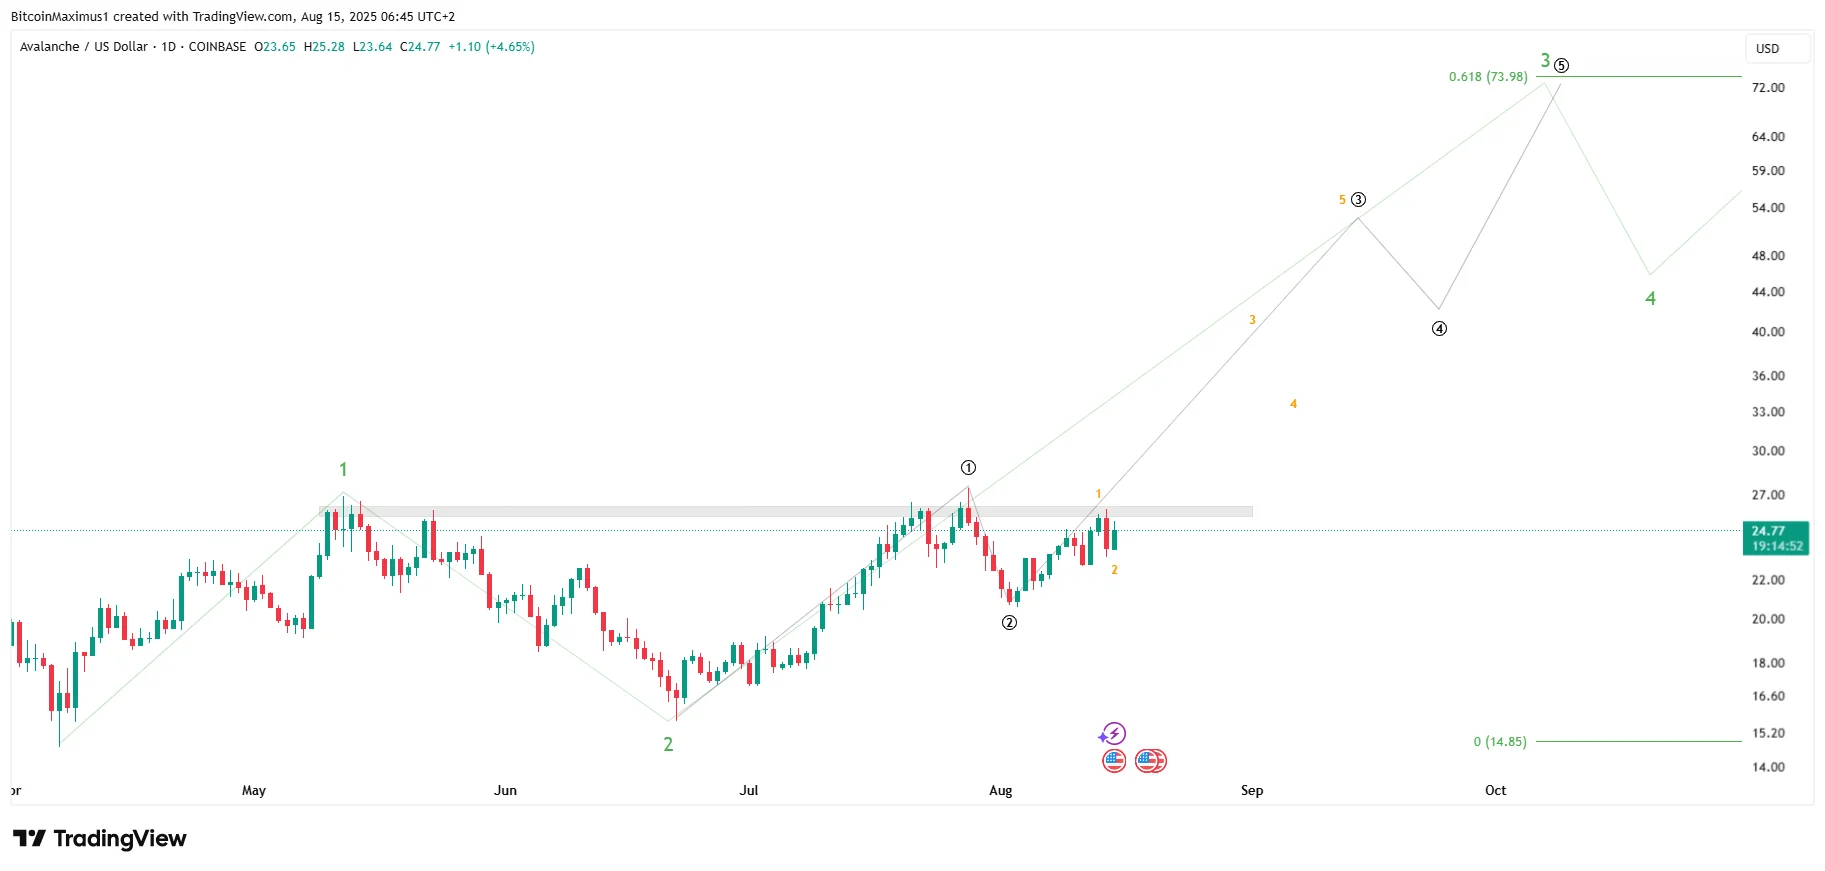
While the weekly AVAX chart is bullish, it pales compared to the daily one.
This series of 1-2/1-2 structures previously led to significant breakouts for LINK and PENDLE.
In Avalanche’s setup, the breakout is right around the corner.
The AVAX price has completed its third 1-2 wave formation, so a breakout is imminent.
Disclaimer:
The information provided in this article is for informational purposes only. It is not intended to be, nor should it be construed as, financial advice. We do not make any warranties regarding the completeness, reliability, or accuracy of this information. All investments involve risk, and past performance does not guarantee future results. We recommend consulting a financial advisor before making any investment decisions.
Valdrin Tahiri is a cryptocurrency analyst and reporter at CCN, specializing in technical analysis with a focus on Elliott Wave theory, on-chain metrics, and fundamental research. He brings over seven years of experience in the crypto space as both a trader and writer.
He discovered cryptocurrencies in 2017 while earning his MSc in Financial Markets at the Barcelona School of Economics, which sparked a deep interest in blockchain and market dynamics. Since then, he’s contributed to top crypto outlets like BeInCrypto and CoinGape.
Valdrin also served as Community Manager of BeInCrypto’s Telegram group for three years, helping grow it into one of the largest crypto communities worldwide. His expertise in market structure and price patterns allows him to break down complex trends into clear, actionable insights.
He’s published thousands of articles covering altcoins, Bitcoin cycles, and macro trends.