Key Takeaways
- Solana (SOL) failed to close above the $250 horizontal resistance area.
- Despite its rejection, SOL has increased by 130% since April.
- Will SOL break out from the $250 resistance area before the end of the year?
Solana’s price crashed by 10% yesterday, but has regained its footing today, creating a higher low.
While last week’s failure to break out from the long-term resistance is worrying, Solana’s bullish trend remains intact.
With that in mind, let’s examine the price action and figure out what lies ahead for the rest of the year.
Solana Hits Resistance
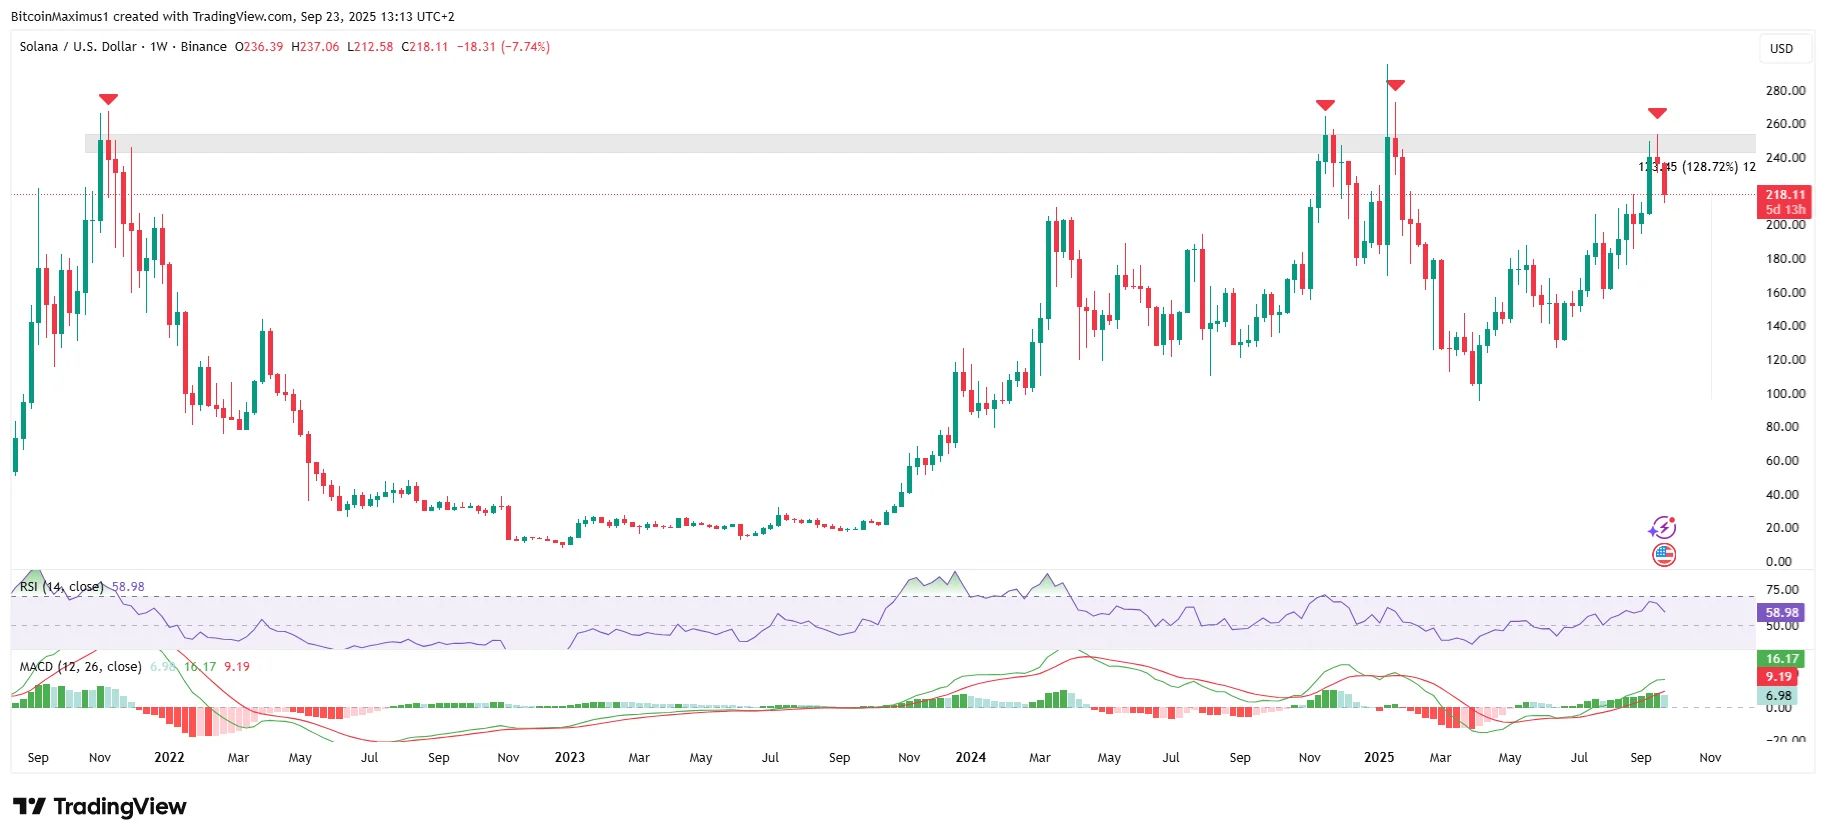
The weekly time frame technical analysis shows that Solana has traded under the $250 horizontal resistance area since 2021.
The price has moved above this level several times, reaching its all-time high of $295 in January 2025.
However, SOL could never sustain its increase (red icons) and always closed below this resistance area. Therefore, the $250 resistance is still intact.
Last week, Solana made another unsuccessful breakout attempt, following it with a bearish candlestick this week.
Despite the decline, Solana’s trend of higher highs and higher lows since April is still intact, measuring a 130% rally since the lows.
Resistances weaken with each breakout attempt, so the SOL price will likely break out on the next attempt.
If that happens, the rally could become parabolic, since there will be no more overhead resistance.
- SOL/USDT Weekly Chart | Credit: Valdrin Tahiri/TradingView
Momentum indicators also suggest the decline is nothing to worry about. The Relative Strength Index (RSI) is above 50, and the Moving Average Convergence/Divergence (MACD) is still positive.
Therefore, the Solana price is expected to break out from the $210 resistance area and move to a new all-time high.
New Solana All-Time High?
Solana’s long-term wave count shows that the price is in the fifth and final wave of its upward movement that began in December 2023.
Based on the wave count, the main horizontal range is at $210, marking the top of wave three.
Since the SOL price trades above this level, the prediction is bullish, and new highs are likely.
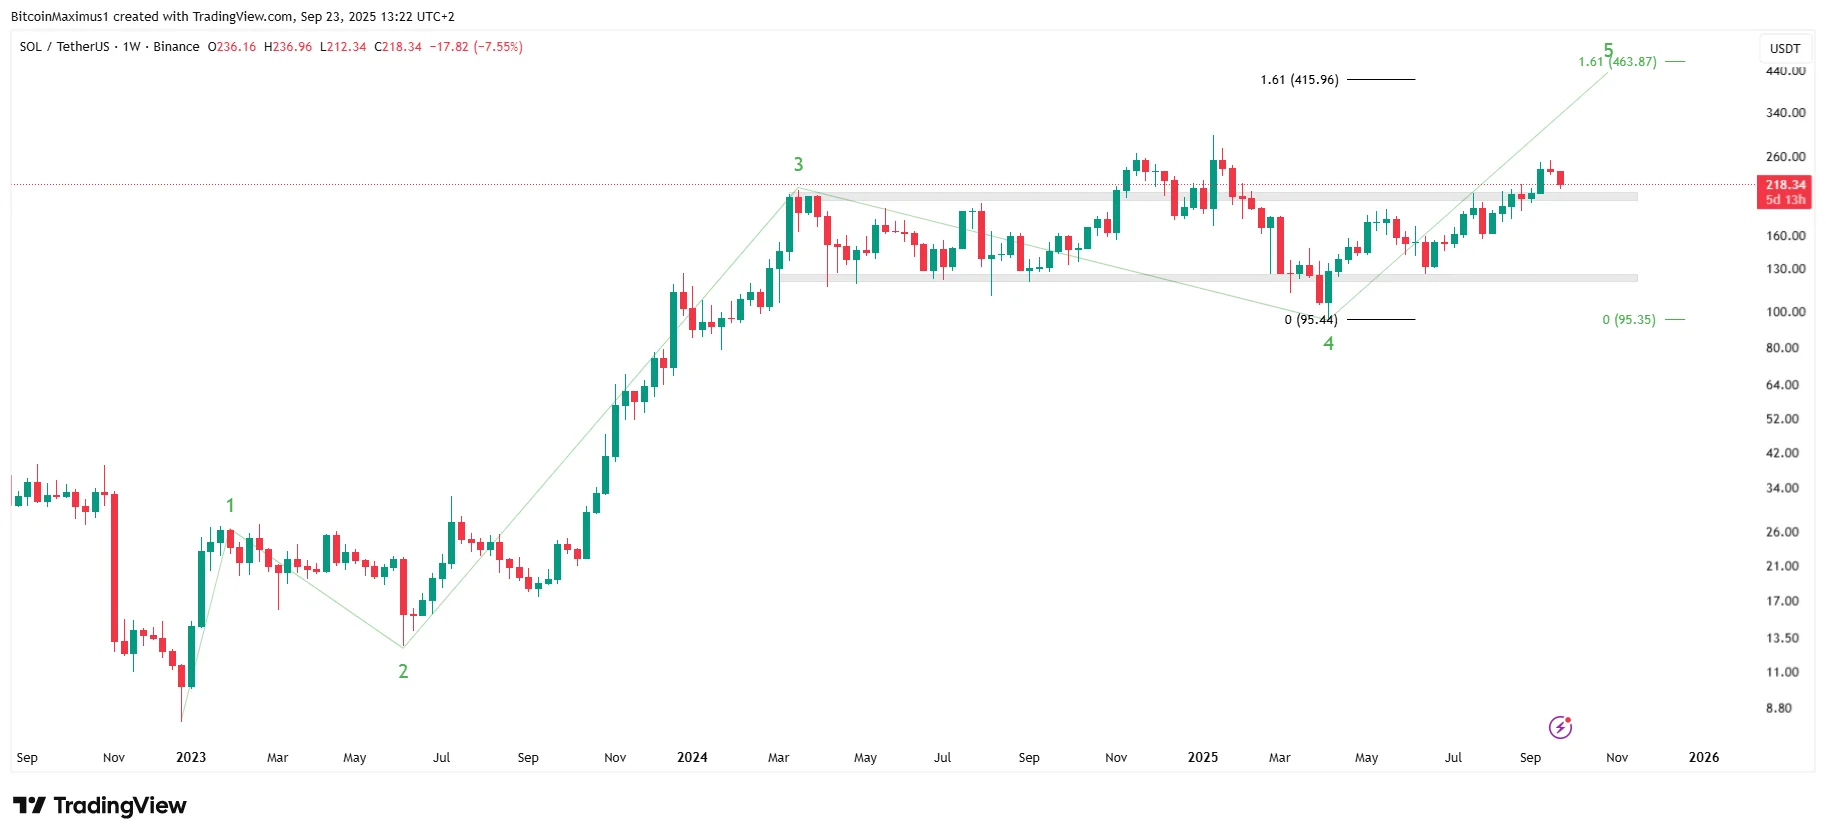
- SOL/USDT Weekly Chart | Credit: Valdrin Tahiri/TradingView
As long as it does, wave five will remain intact.
While the sub-wave count is still unclear, Solana will likely reach its wave five high inside the $416-464 range.
This range is created by the 1.61 external Fibonacci retracement (black) and by giving wave five the same length as wave one (green).
Solana Outperforms Ethereum
While Ethereum has been the best altcoin performer since April, especially when looking at large cryptocurrencies, that has changed in the past few weeks.
After bouncing at the 0.039 ETH horizontal support area in Aug. 2025, the SOL price broke out from a descending resistance trend line (dashed).
Since April, the trend line has caused several rejections, so the breakout is a sign that the correction has ended.

- SOL/ETH Weekly Chart | Credit: Valdrin Tahiri/TradingView
If the upward movement continues, the SOL price could reach a top between the 0.5-0.618 Fibonacci retracement resistance levels at 0.064 and 0.071 ETH.
Solana will likely outperform Ethereum until the rest of the year.
Final Thoughts
Despite its recent rejection at the $250 resistance, Solana remains in a strong bullish structure.
As long as the $210 level holds, the price action and wave count point toward new highs.
If momentum continues, SOL could break out and rally into the $416–$464 range before the end of the year.
The information provided in this article is for informational purposes only. It is not intended to be, nor should it be construed as, financial advice. We do not make any warranties regarding the completeness, reliability, or accuracy of this information. All investments involve risk, and past performance does not guarantee future results. We recommend consulting a financial advisor before making any investment decisions.

Valdrin Tahiri is a cryptocurrency analyst and reporter at CCN, specializing in technical analysis with a focus on Elliott Wave theory, on-chain metrics, and fundamental research. He brings over seven years of experience in the crypto space as both a trader and writer.
He discovered cryptocurrencies in 2017 while earning his MSc in Financial Markets at the Barcelona School of Economics, which sparked a deep interest in blockchain and market dynamics. Since then, he’s contributed to top crypto outlets like BeInCrypto and CoinGape.
Valdrin also served as Community Manager of BeInCrypto’s Telegram group for three years, helping grow it into one of the largest crypto communities worldwide. His expertise in market structure and price patterns allows him to break down complex trends into clear, actionable insights.
He’s published thousands of articles covering altcoins, Bitcoin cycles, and macro trends.