Why Solana is at Risk of a Dump | Credit : Hameem Sarwar
Share
Key Takeaways
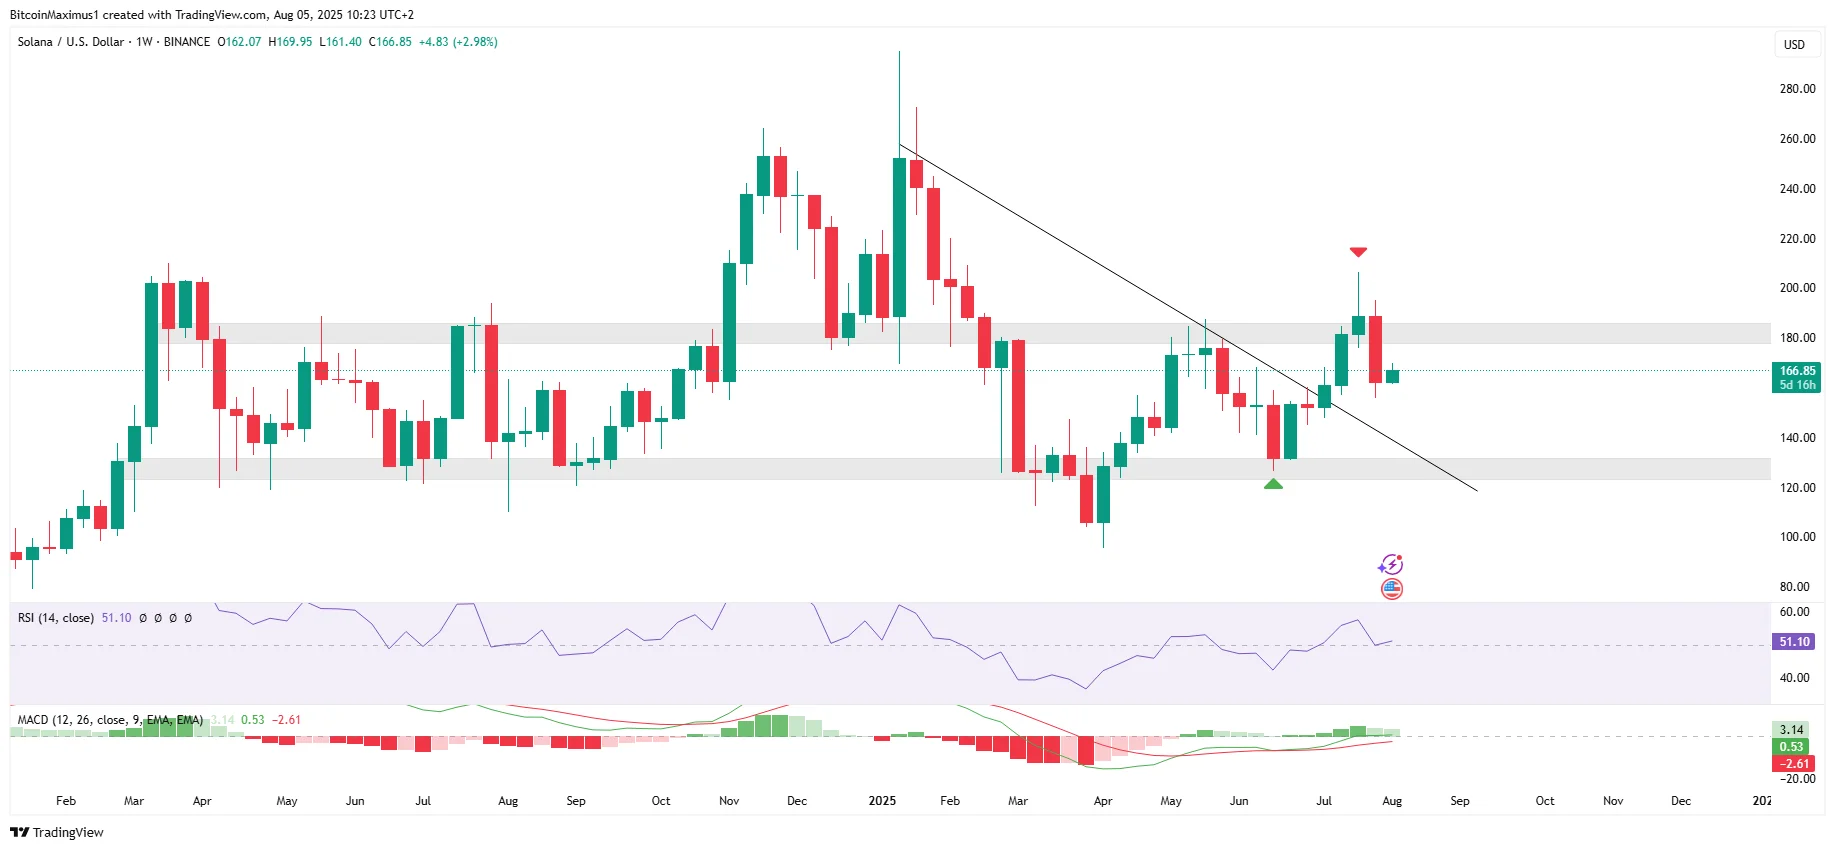
The Solana (SOL) price trades inside a long-term horizontal range.
Solana failed to break out from its range high and fell last week.
Will Solana continue its descent toward its range low of $145?
Since early 2024, the Solana (SOL) price has remained range-bound between $125 and $180.. It shows signs of consolidation with no clear long-term breakout.
After a failed breakout attempt last week, traders are watching closely for a potential decline toward the range low.
However, a nearly 28,000 SOL purchase by Bit Mining has raised optimism that better times are ahead.
BIT Mining SOL Purchase
BIT Mining Limited announced the launch of its first Solana validator and the purchase of 27,191 SOL ($4.89 million) to begin building its SOL treasury.
This move is part of a broader strategy revealed in July to invest up to $300 million in Solana assets and infrastructure.
Try Our Recommended Crypto Exchanges
Sponsored
Disclosure
We sometimes use affiliate links in our content, when clicking on those we might receive a commission at no extra cost to you. By using this website you agree to our terms and conditions and privacy policy.
This sign of weakness could lead to a retest of the range low of $125.
Momentum indicators do not confirm whether the trend is bullish or bearish. The Relative Strength Index (RSI) is 50 while the Moving Average Convergence/Divergence (MACD) is 0.
So, the long-term technical analysis does not confirm if the Solana price prediction for the rest of 2025 is bullish or bearish.
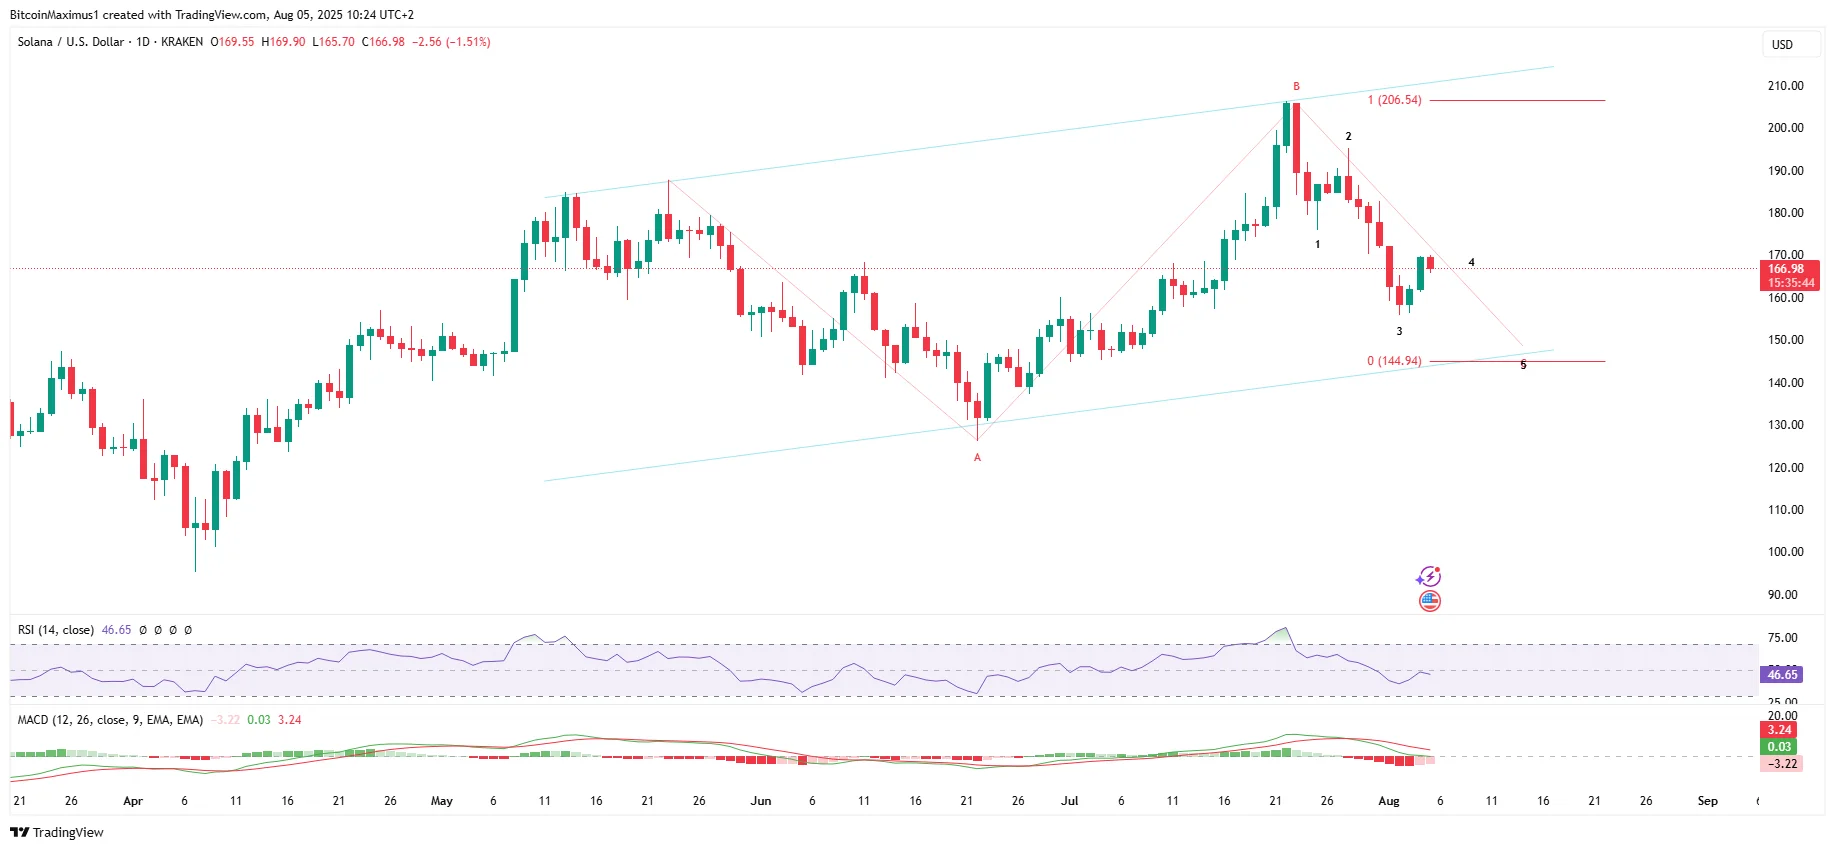
What’s Next for SOL?
The daily time frame nudges the SOL price toward bearish territory because of the wave count and indicator readings.
Solana’s wave count shows an A-B-C correction (red), likely of the running variety.
If that is the case, the price of SOL is currently in the final stages of wave C, which could end at the channel’s support trend line.
Disclaimer:
The information provided in this article is for informational purposes only. It is not intended to be, nor should it be construed as, financial advice. We do not make any warranties regarding the completeness, reliability, or accuracy of this information. All investments involve risk, and past performance does not guarantee future results. We recommend consulting a financial advisor before making any investment decisions.
Valdrin Tahiri is a cryptocurrency analyst and reporter at CCN, specializing in technical analysis with a focus on Elliott Wave theory, on-chain metrics, and fundamental research. He brings over seven years of experience in the crypto space as both a trader and writer.
He discovered cryptocurrencies in 2017 while earning his MSc in Financial Markets at the Barcelona School of Economics, which sparked a deep interest in blockchain and market dynamics. Since then, he’s contributed to top crypto outlets like BeInCrypto and CoinGape.
Valdrin also served as Community Manager of BeInCrypto’s Telegram group for three years, helping grow it into one of the largest crypto communities worldwide. His expertise in market structure and price patterns allows him to break down complex trends into clear, actionable insights.
He’s published thousands of articles covering altcoins, Bitcoin cycles, and macro trends.