Chainlink's Correction Could End Soon | Credit: Hameem Sarwar
Share
Key Takeaways
Chainlink’s (LINK) price trades in a range between $13.50 and $17.
LINK has completed a short-term A-B-C corrective structure.
Can LINK break out from its range high and move to new highs?
Chainlink (LINK) has been bouncing between $13.50 and $17, flashing both bullish momentum and warning signs.
After a strong July rally, the price pulled back, raising questions about whether the breakout was real or just another fakeout.
Let’s take a closer look at the charts to see where LINK might be headed next.
Chainlink Price Analysis
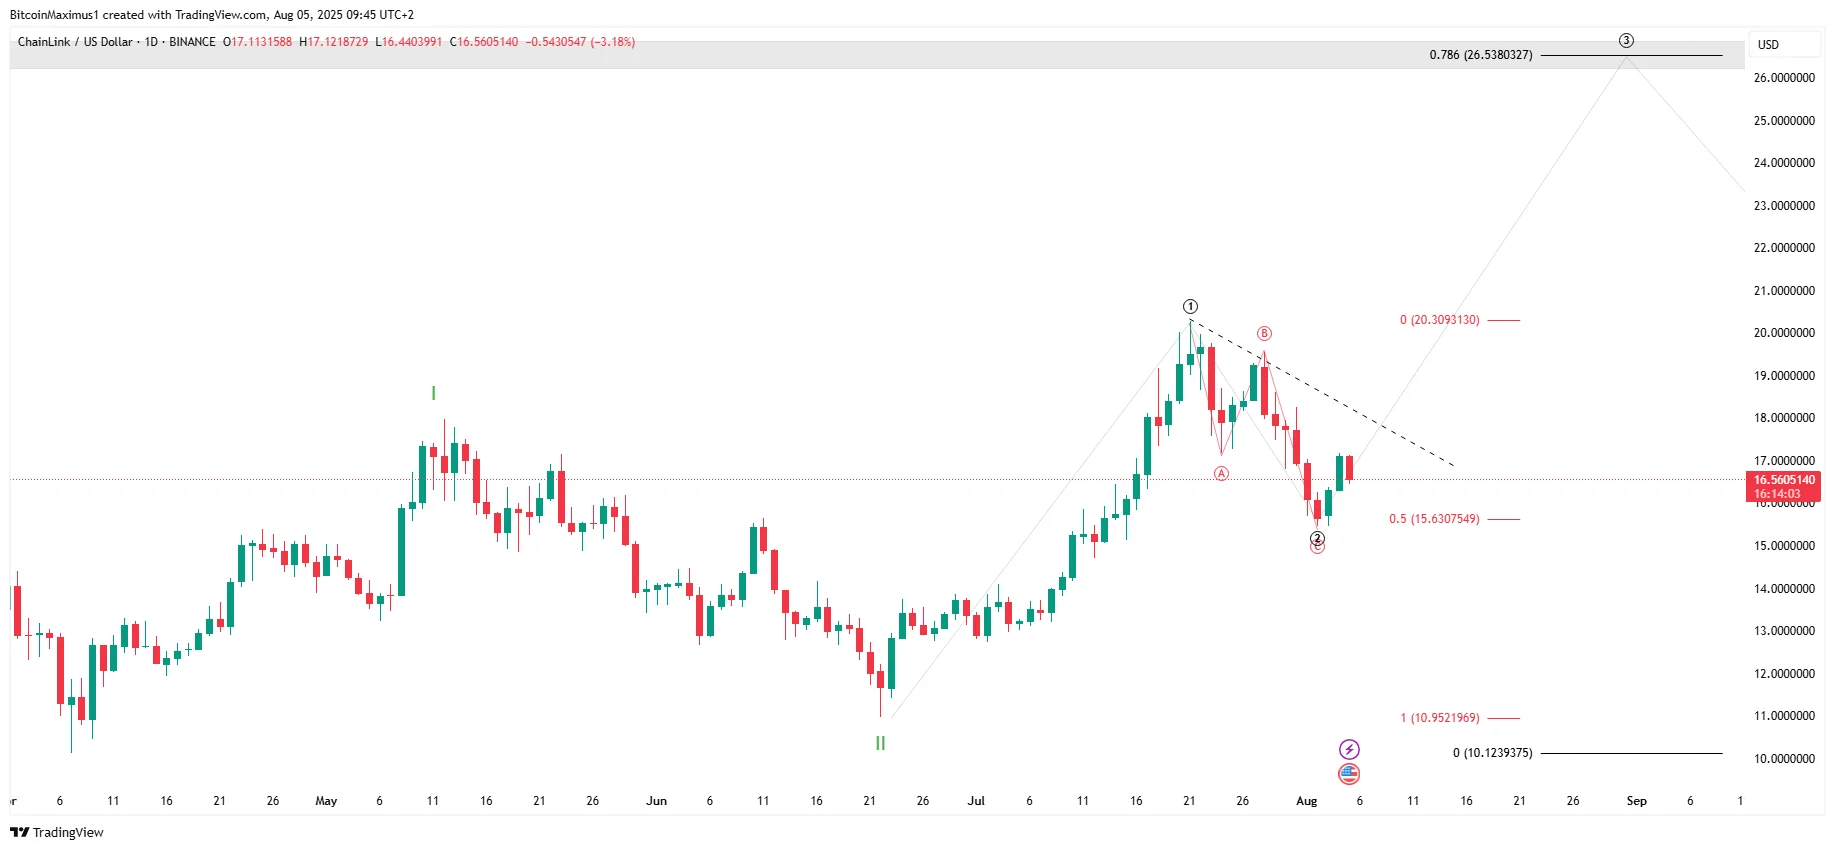
On the daily chart, Chainlink broke out from a long-standing descending resistance trend line in July, ending a downtrend that had lasted more than six months.
The rally peaked at $20.28 on July 28, but since then, LINK has pulled back, dropping steadily for two weeks, a typical cool-off after a strong upward move.
Try Our Recommended Crypto Exchanges
Sponsored
Disclosure
We sometimes use affiliate links in our content, when clicking on those we might receive a commission at no extra cost to you. By using this website you agree to our terms and conditions and privacy policy.
What’s raising eyebrows now is LINK’s drop back below the $17 horizontal support, a key level it had previously broken above.
Failing to reclaim this zone casts doubt on the strength of the July breakout and suggests it may have been a short-lived deviation rather than a true trend reversal.
To confirm a bullish continuation, LINK will need to close decisively above $17 and hold it as support.
Still, there are some encouraging signs. The price isn’t confined to a corrective channel, and the recent legs upward don’t mirror each other, traits often associated with impulsive (bullish) structures rather than corrections.
But despite this, momentum indicators remain flat. he Relative Strength Index (RSI) is at 50, and the Moving Average Convergence/Divergence (MACD) is 0, pointing to indecision in the market.
As it stands, the technical outlook for LINK remains mixed, with no clear signal yet for where it’s headed next.
LINK Correction Over?
A closer look at the wave count shows a completed A-B-C correction (red) that ended at the 0.5 Fibonacci retracement support level.
The current bounce took the Chainlink price above the low of wave A, confirming the decline is a correction.
What also stands out is that the ongoing decline is much shallower than the one starting in May.
So, one possibility is that LINK is in a 1-2/1-2 wave structure, having just finished the second one. A parabolic upward movement will ensue if this is the case, taking the LINK price to $26.53.
However, Chainlink has yet to break out from its corrective trend line (dashed) and its July. Until it does that, the bullish prediction from the wave count will not be confirmed.
Decisive Close Ahead
While Chainlink’s price analysis indicates the possibility of a breakout, the failure to reclaim the $17 level casts doubt on its legitimacy.
A decisive close above this area could set the stage for a parabolic rally toward $26.53.
Valdrin Tahiri is a cryptocurrency analyst and reporter at CCN, specializing in technical analysis with a focus on Elliott Wave theory, on-chain metrics, and fundamental research. He brings over seven years of experience in the crypto space as both a trader and writer.
He discovered cryptocurrencies in 2017 while earning his MSc in Financial Markets at the Barcelona School of Economics, which sparked a deep interest in blockchain and market dynamics. Since then, he’s contributed to top crypto outlets like BeInCrypto and CoinGape.
Valdrin also served as Community Manager of BeInCrypto’s Telegram group for three years, helping grow it into one of the largest crypto communities worldwide. His expertise in market structure and price patterns allows him to break down complex trends into clear, actionable insights.
He’s published thousands of articles covering altcoins, Bitcoin cycles, and macro trends.