Solana price weakens across all timeframes | Credit: Hameem Sarwar
Share
Key Takeaways
SOL hits multi-month lows as bearish momentum strengthens.
LTH-NUPL drop signals fragile sentiment among long-term holders.
Short-term holders selling adds volatility and downward pressure.
Solana (SOL) price has entered a critical phase after plunging to its lowest level since June 23.
The recent drop reflects mounting selling pressure across the crypto market, and SOL’s technical structure looks increasingly fragile.
Indicators across several timeframes show worsening bearish momentum, weakening buyer strength, and a high risk of continued downside.
With SOL’s price slipping toward key support while momentum oscillators turn negative, Solana may be approaching a potential correction.
What could be Solana’s worst-case scenarios in the near term? Let’s find out.
Solana Extends Decline
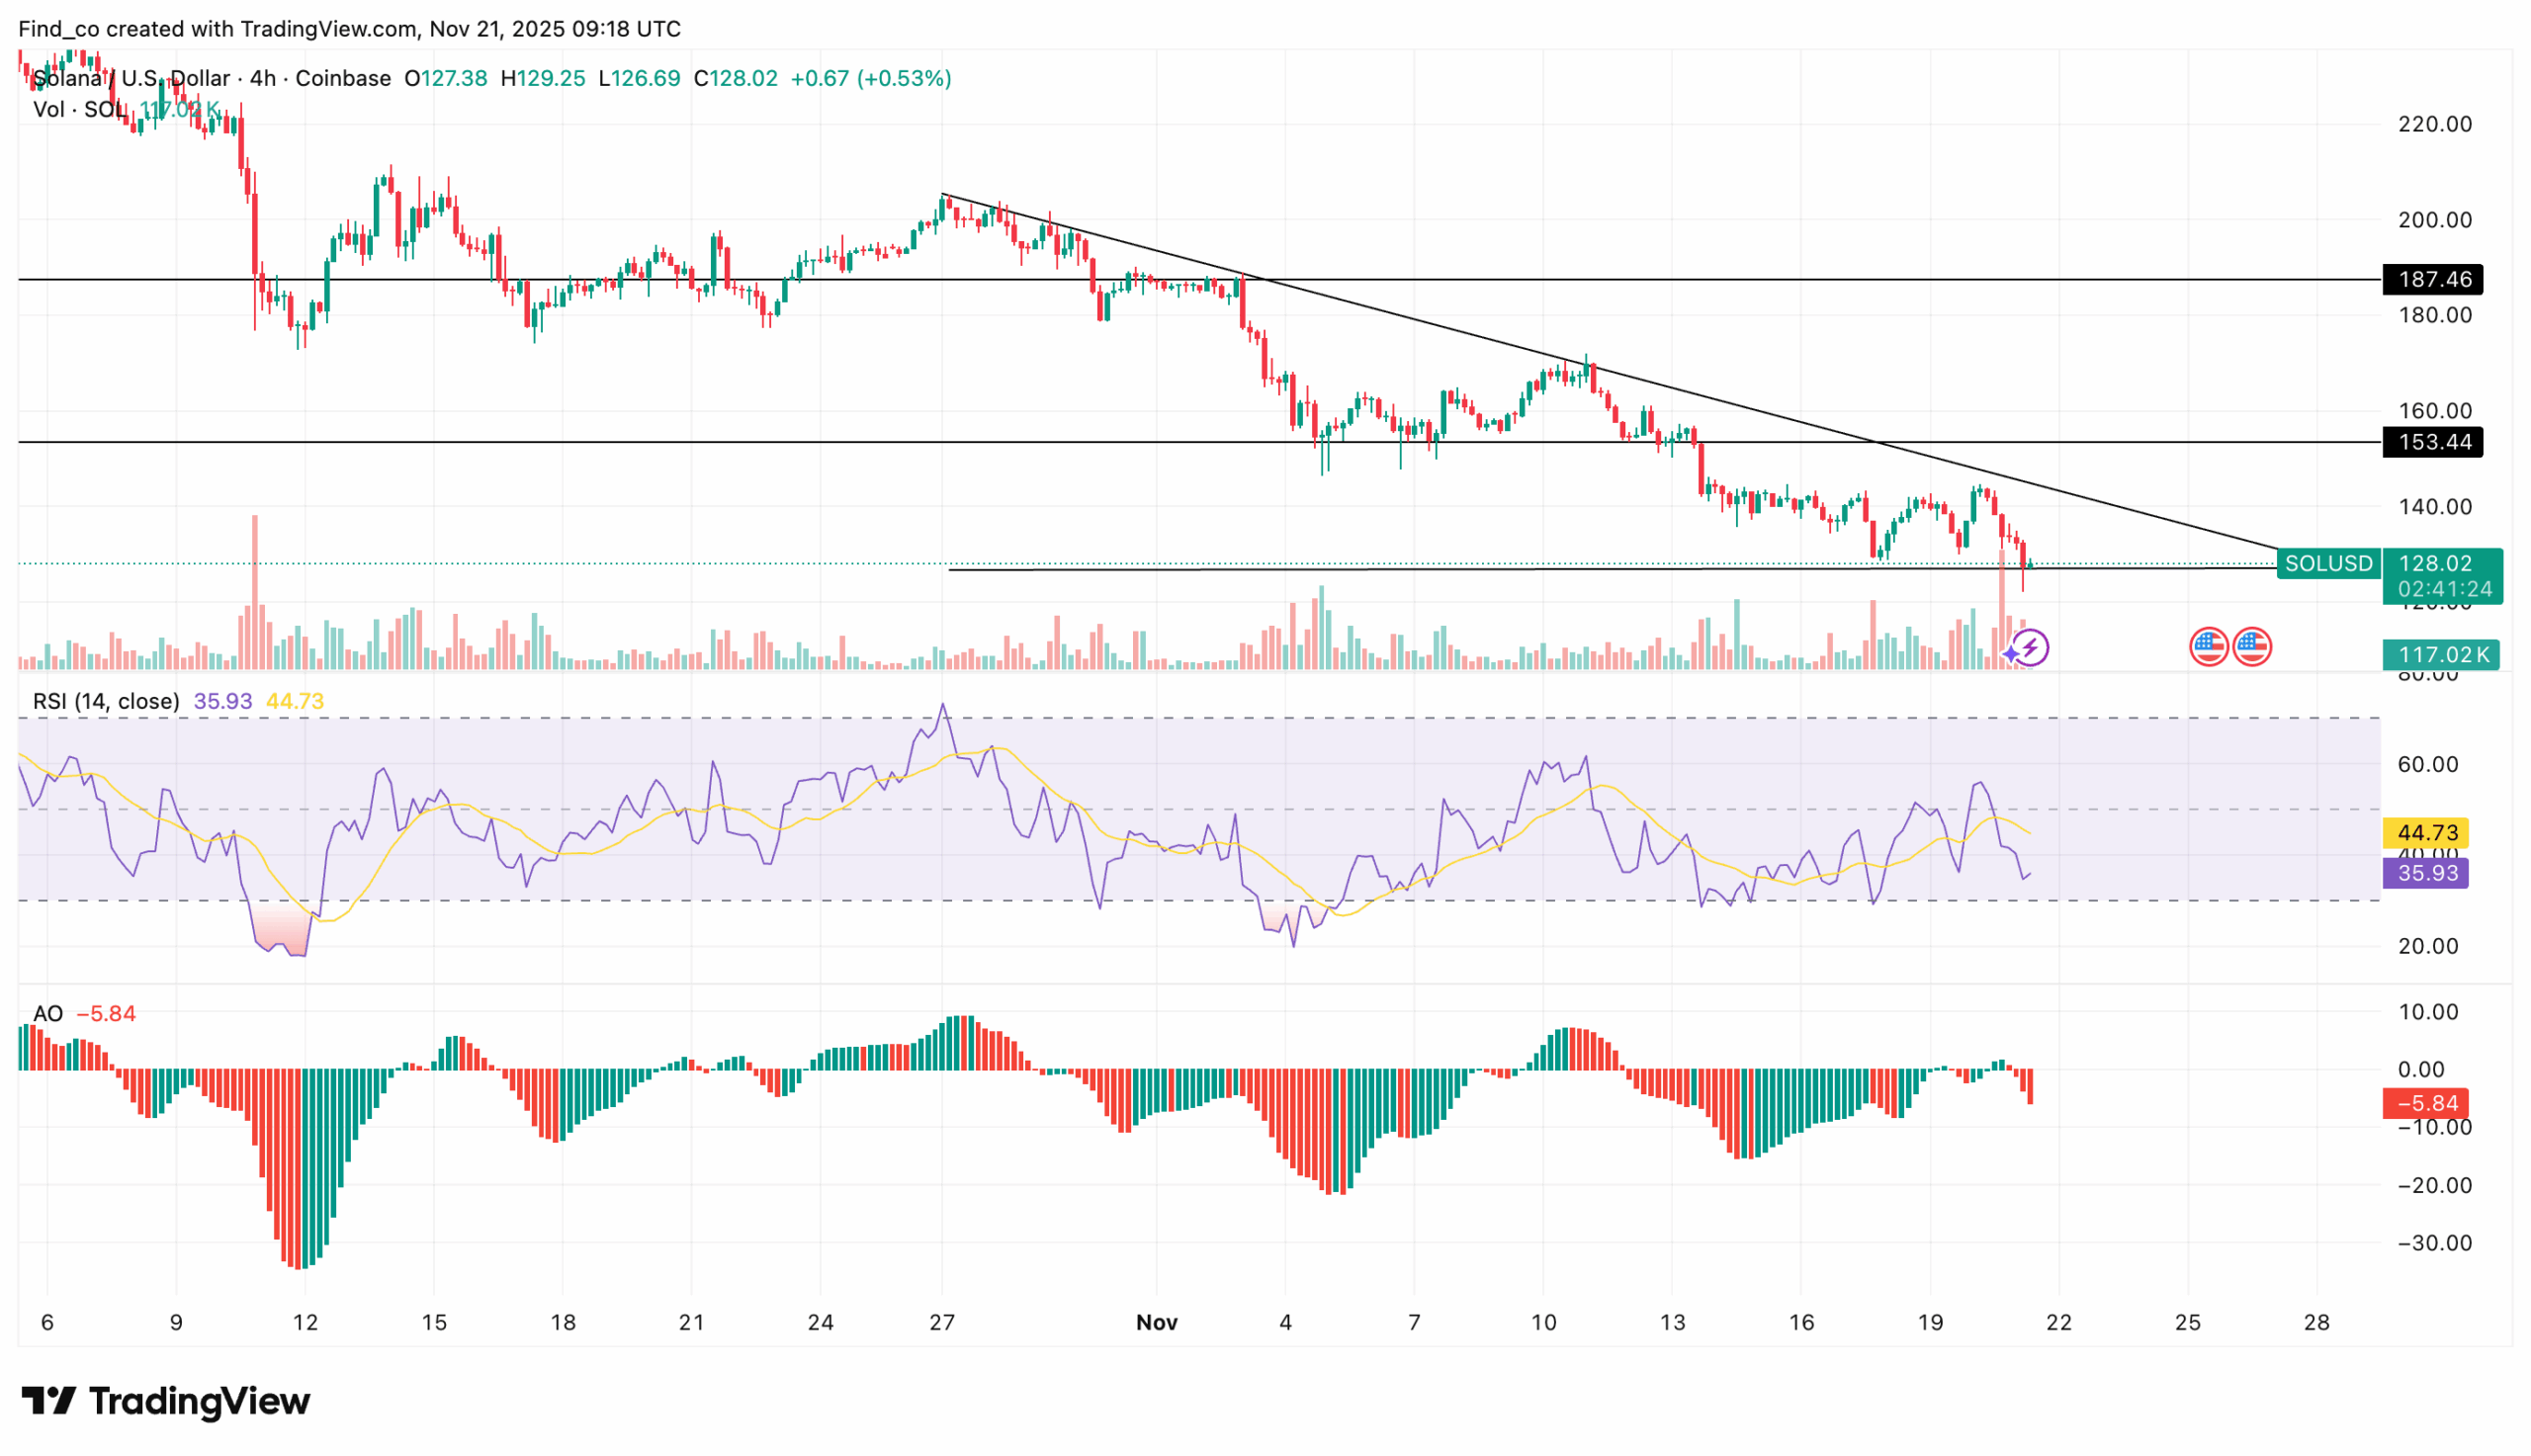
On the 4-hour chart, the Relative Strength Index (RSI) continues to issue warning signals as bearish pressure grows.
The RSI currently sits at 36.80, sliding toward the oversold threshold and the deeper extreme near 30.
A continued move into this zone typically reflects accelerating bearish momentum and precedes sharper declines or capitulation-driven sell-offs.
Get These Top Crypto Casino Offers Now!
Sponsored
Disclosure
We sometimes use affiliate links in our content, when clicking on those we might receive a commission at no extra cost to you. By using this website you agree to our terms and conditions and privacy policy.
The RSI’s repeated rejection of the neutral 50 line indicates that bulls have struggled to regain control, reinforcing seller dominance. Unless the RSI rebounds firmly above the 50.00 range, the risk of further downside remains high.
From a complementary technical standpoint, the Awesome Oscillator (AO) has turned negative, producing expanding red histogram bars with a reading of –5.84.
This deepening negative momentum highlights rising sell pressure and confirms a bearish trend structure on the lower timeframes.
When the AO sinks further below zero with growing amplitude, it signals the early phase of a more substantial downward continuation.
If buyers fail to defend the current support level, SOL price could enter a prolonged bearish phase.
Looking at on-chain data, the Long-Term Holder NUPL (LTH-NUPL) has fallen into the Hope (orange) zone.
This metric tracks the net unrealized profit and loss of coins held for at least 155 days. Furthermore, it gives a clear picture of how holders are behaving.
A drop into the Hope zone typically indicates that long-term holders are still in modest profit. However, it also shows that they are beginning to feel uncertain about the trend.
It reflects a phase where confidence is fragile. If demand fails to improve from here, Solana’s price could experience a deeper correction.
Combined with weakening long-term holder sentiment, the continued distribution from short-term holders suggests that Solana faces meaningful headwinds unless buying confidence returns.
SOL Price Analysis: Heavy Selloffs Ahead
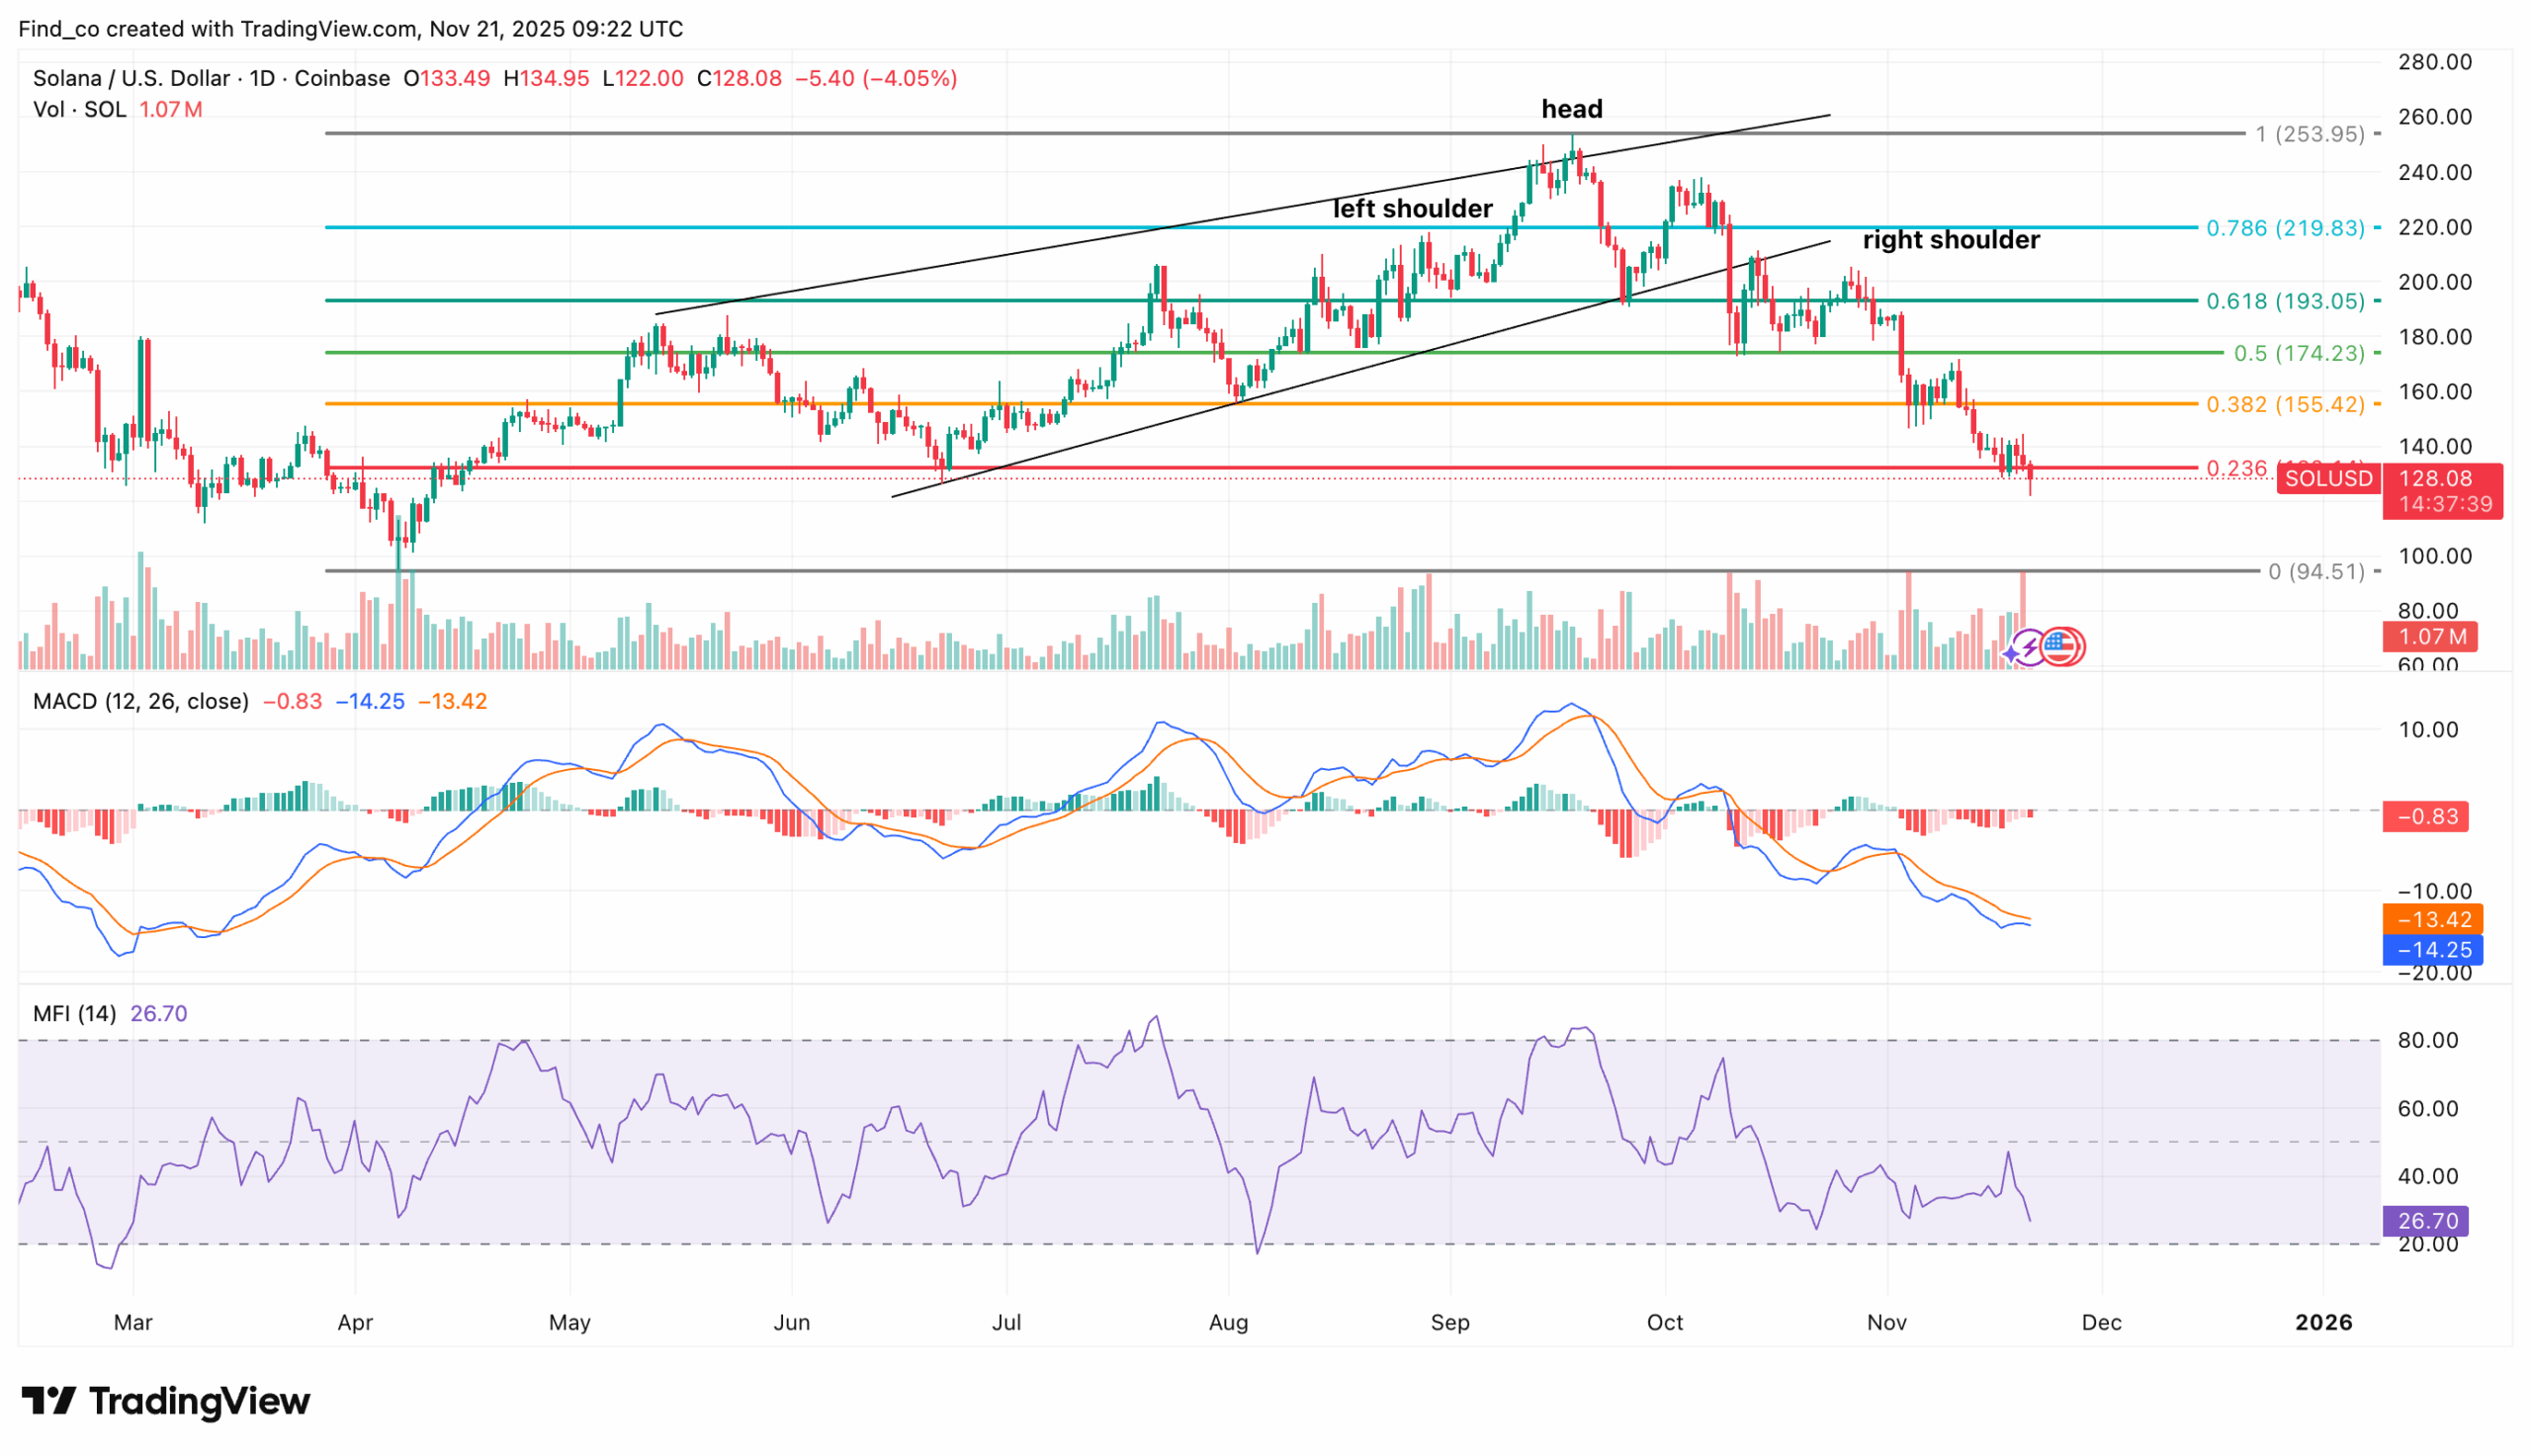
On the daily chart, Solana’s price was trapped within a rising wedge pattern, a formation that precedes a downtrend. At the time of this press release, SOL continues to form lower lows and lower highs.
The Moving Average Convergence Divergence (MACD) indicator is in negative territory, as it prints consecutive red histogram bars.
This reflects strong selling pressure and shifts momentum decisively in favor of the bears. The 26-day EMA (orange) has crossed over the 12-day EMA (blue), further signaling a bearish trend.
Besides that, the formation of a head and shoulders pattern accelerated the downtrend.
The Money Flow Index (MFI) supports this view, as it currently sits in negative territory at 26.70. Although slightly above the oversold zone, it remains far from indicating any meaningful buyer strength.
A reading this low indicates that sellers are in control of momentum, and capital continues to flow out of the market.
A closer look at the Fibonacci retracement levels reveals that SOL is currently trading below the 0.236 Fib level and is trending toward the lower support at 94.51.
Disclaimer:
The information provided in this article is for informational purposes only. It is not intended to be, nor should it be construed as, financial advice. We do not make any warranties regarding the completeness, reliability, or accuracy of this information. All investments involve risk, and past performance does not guarantee future results. We recommend consulting a financial advisor before making any investment decisions.
Victor Olanrewaju is a crypto analyst and reporter at CCN with deep roots in on-chain research and technical analysis. His crypto journey began in 2017, but it was the 2020 Uniswap airdrop that sparked a full-time pivot into the space.
With a foundation in copywriting, Victor honed his craft creating high-converting content for leading crypto brokers — most notably an XRP price prediction that ranked #1 on Google during the 2021 bull run.
He later joined AMBCrypto in 2022, where he combined storytelling with technical and on-chain analysis to cover key market narratives.
In 2024, he expanded his expertise at BeInCrypto, collaborating with analysts and using tools like Glassnode, Santiment, and IntoTheBlock to break down Bitcoin and altcoin trends.
At CCN, Victor covers the top cryptocurrencies, memecoins, macro shifts, blending real-time insights with deep-dive metrics.
He holds a Bachelor’s degree in Physics from the University of Ibadan, equipping him to simplify complex data for a wide audience. Follow his work or connect on LinkedIn or X.