BONK crypto weakens, failing to hold $0.000017 resistance | Credit: Hameem Sarwar
Share
Key Takeaways
BONK is down 33%, struggling below $0.000017 resistance.
Indicators show strong selling and low buying pressure.
BONK’s price risks a further decline unless something changes.
Solana-based memecoin BONK has dropped nearly 33% over the past month as bearish momentum intensifies with no signs of slowing.
At press time, BONK trades at $0.000015, consolidating near local lows.
The market structure remains weak, with BONK’s price failing to reclaim the $0.000017 resistance.
Price action shows intense selling pressure and minimal buying activity, keeping bulls on the sidelines. So, what next?
BONK Downtrend Continues
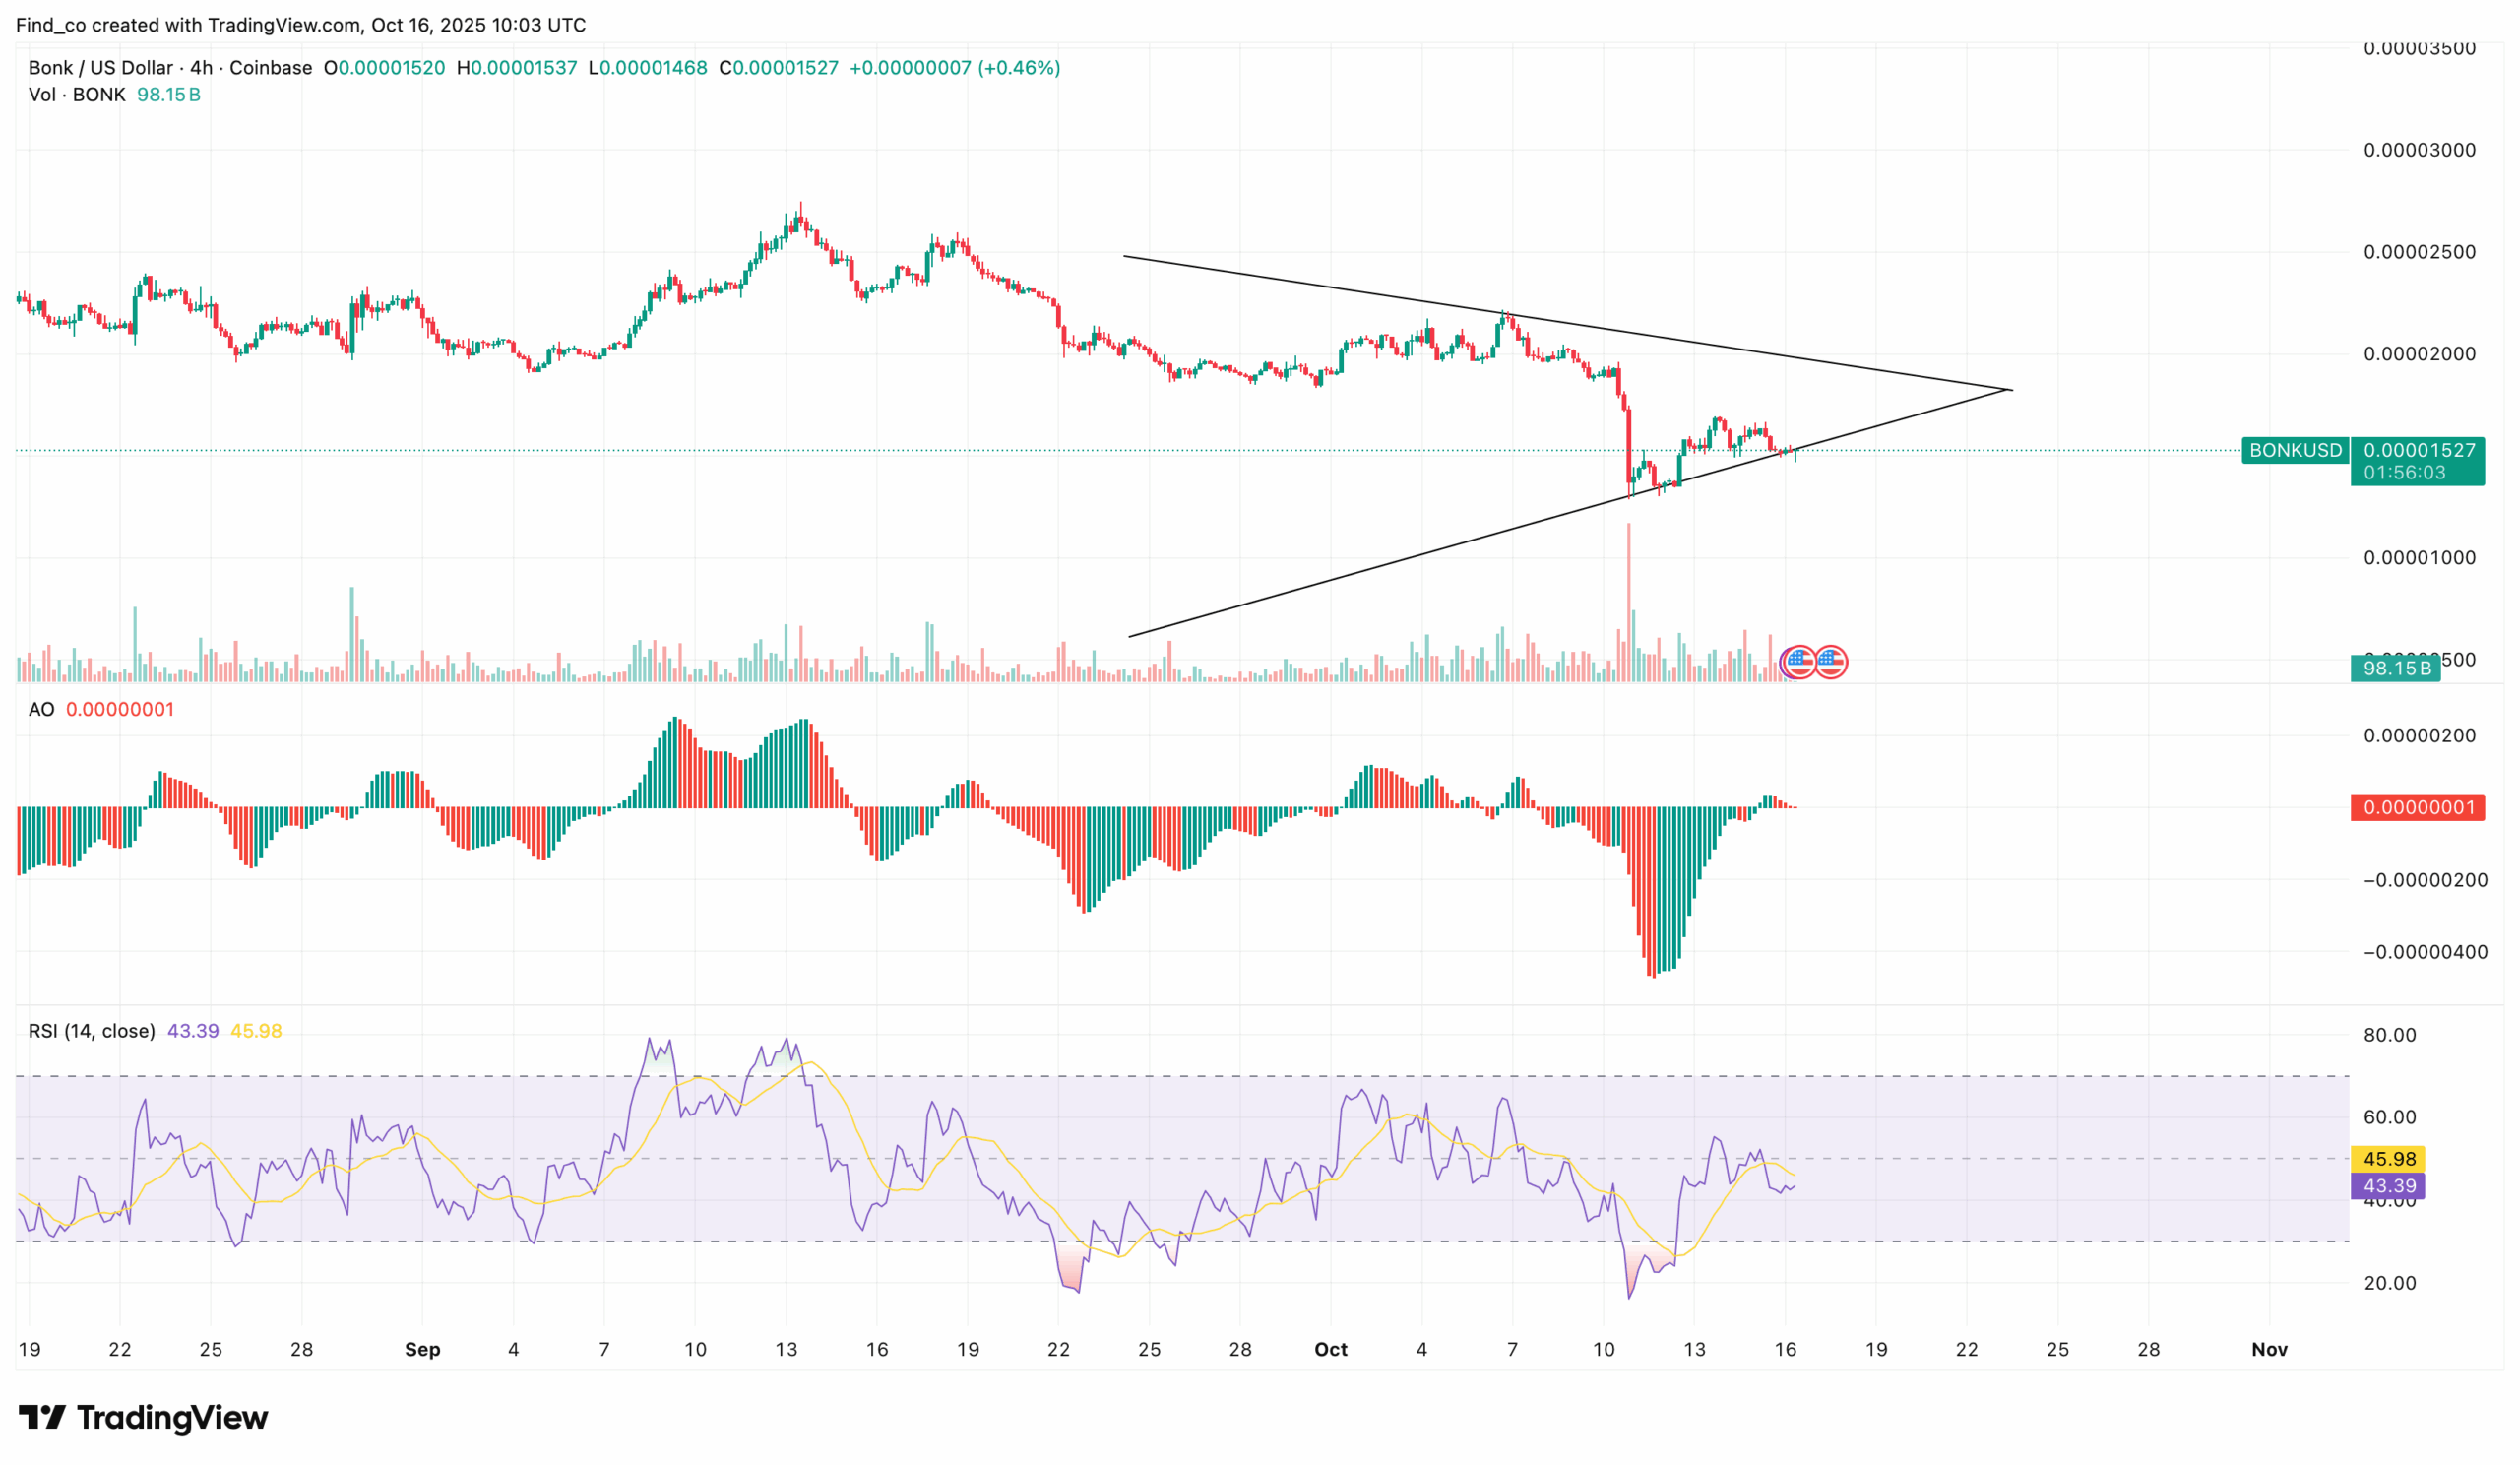
On the 4-hour chart, the Awesome Oscillator (AO) reads 0.00000018 and displays a fading sequence of red bars, signaling growing bearish momentum as buyers fail to gain traction.
The histogram’s struggle to cross above the zero line highlights the persistent weakness in upward momentum.
Get These Top Crypto Casino Offers Now!
Sponsored
Disclosure
We sometimes use affiliate links in our content, when clicking on those we might receive a commission at no extra cost to you. By using this website you agree to our terms and conditions and privacy policy.
From another angle, the Relative Strength Index (RSI) sits at 42.89, hovering close to oversold territory.
This reading shows that while BONK is not yet extremely oversold, buying interest remains weak. The RSI’s failure to move above the midline at 50 further confirms the short-term bearish outlook.
Should bearish momentum continue, BONK could experience further lower lows, especially as the price is close to the lower trendline of the symmetrical triangle.
On the daily chart, Bonk’s Bull Bear Power (BBP) trades deep in the negative region at -0.0000038, emphasizing the market’s ongoing bearish control. The indicator shows no sign of recovery as sellers maintain dominance.
This pattern mirrors the broader downtrend, where buyers struggle against persistent resistance.
The Moving Average Convergence Divergence (MACD) supports this bearish setup, with the 26-day EMA (orange) crossing above the 12-day EMA (blue), signaling sustained downward momentum.
BONK’s MACD histogram bars also remain below the zero line, confirming that selling pressure continues to dominate.
If current momentum holds, BONK could extend its decline, potentially testing lower zones near $0.0000040.
The Fibonacci retracement levels indicate that BONK is still struggling to hold above the 0.236 Fib at $0.000013 while trading near $0.000016.
Without a decisive close above the 0.382 Fib level at $0.000021, there is a risk of a deeper correction toward the 0.236 Fib level at $0.000013.
However, if BONK rebounds from current levels, it could retest the 0.382 Fib level at $0.000021 and possibly push toward the 0.618 Fib level at $0.000028, though this would require an apparent increase in trading volume.
Psuedonymous trader Rikwoo believes BONK could soon rebound. He noted that it could be set for a possible short squeeze if it holds a key support line.
“Based on the recent CVD and funding activity observed on $SOL, it shows similar absorption behavior. CVD and funding on BONK confirm early absorption, while OI decreased during the dump → possible short squeeze setup. The 3D trendline held perfectly as structural support. On 4H, the price is forming a higher low above the reclaimed zone. If momentum holds, the target zone sits near 0.0000188. Invalidation below 0.0000137.” The analyst opined.
Disclaimer:
The information provided in this article is for informational purposes only. It is not intended to be, nor should it be construed as, financial advice. We do not make any warranties regarding the completeness, reliability, or accuracy of this information. All investments involve risk, and past performance does not guarantee future results. We recommend consulting a financial advisor before making any investment decisions.
Victor Olanrewaju is a crypto analyst and reporter at CCN with deep roots in on-chain research and technical analysis. His crypto journey began in 2017, but it was the 2020 Uniswap airdrop that sparked a full-time pivot into the space.
With a foundation in copywriting, Victor honed his craft creating high-converting content for leading crypto brokers — most notably an XRP price prediction that ranked #1 on Google during the 2021 bull run.
He later joined AMBCrypto in 2022, where he combined storytelling with technical and on-chain analysis to cover key market narratives.
In 2024, he expanded his expertise at BeInCrypto, collaborating with analysts and using tools like Glassnode, Santiment, and IntoTheBlock to break down Bitcoin and altcoin trends.
At CCN, Victor covers the top cryptocurrencies, memecoins, macro shifts, blending real-time insights with deep-dive metrics.
He holds a Bachelor’s degree in Physics from the University of Ibadan, equipping him to simplify complex data for a wide audience. Follow his work or connect on LinkedIn or X.